

Protective mechanism of shenmai on myocardial ischemia-reperfusion through the energy metabolism pathway
- PMID: 31396317
- PMCID: PMC6684917
Protective mechanism of shenmai on myocardial ischemia-reperfusion through the energy metabolism pathway
Abstract
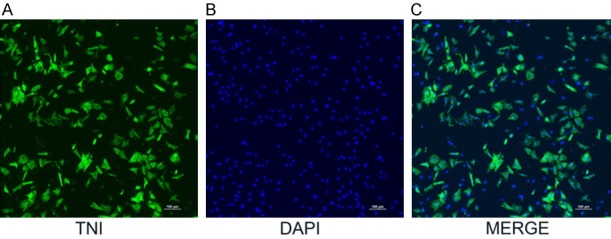
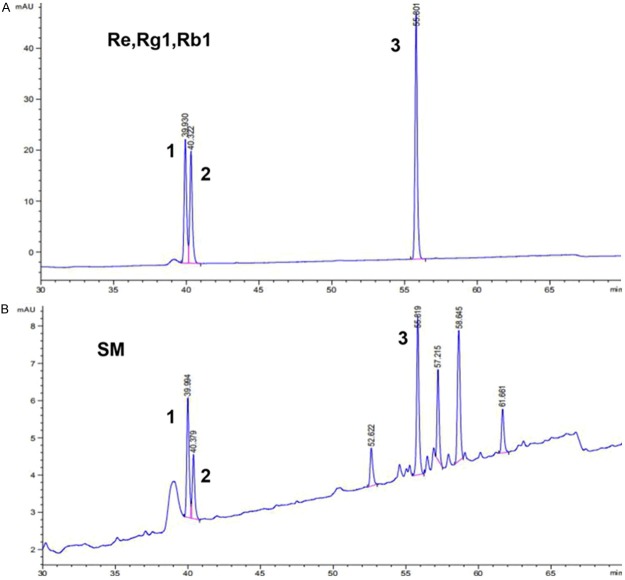
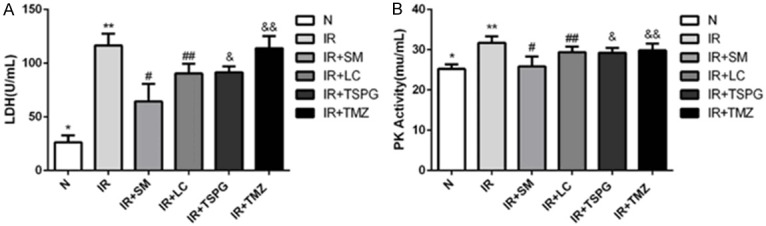
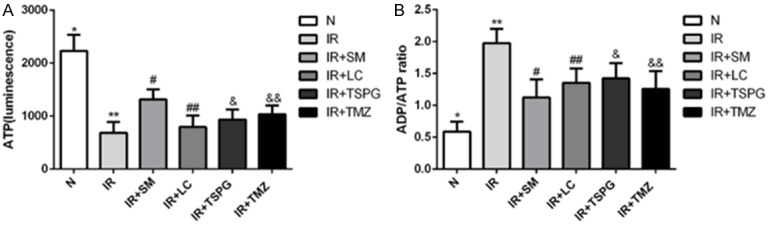
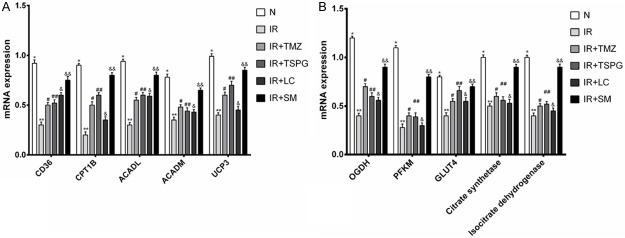
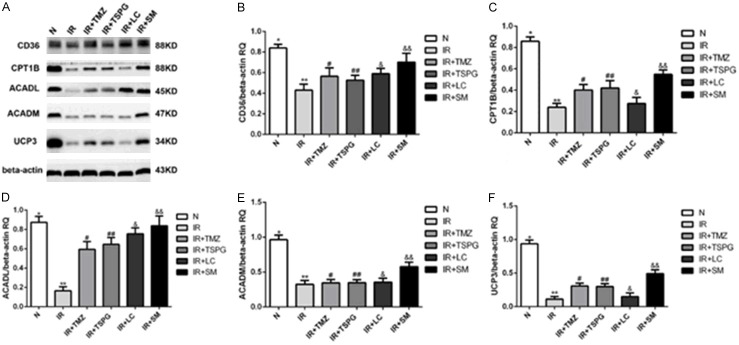
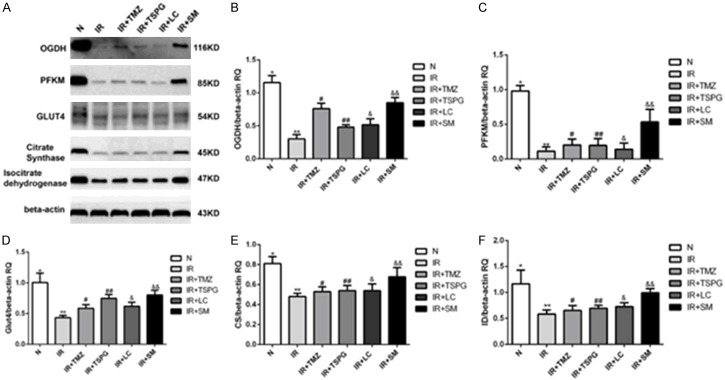
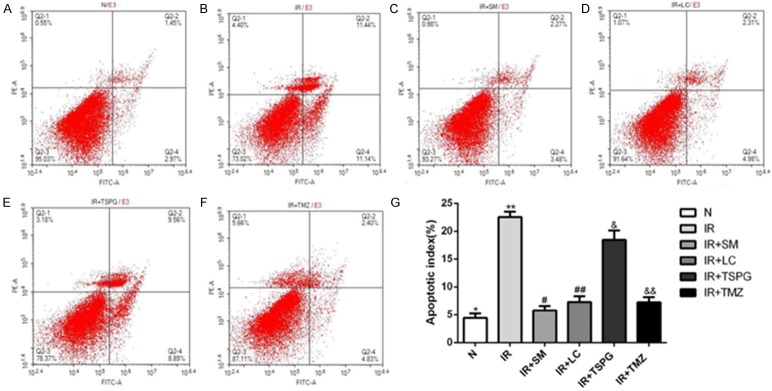
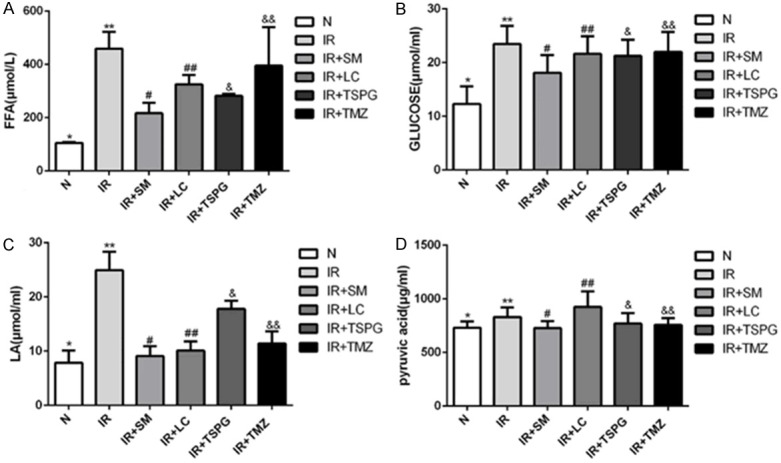
Shenmai (SM) injection has been reported to attenuate ischemia-reperfusion (I/R) injury, but its effect on energy metabolism during I/R and the underlying mechanism remain unknown. To explore the protective mechanism of SM on ischemic cardiomyopathy, primary cardiomyocytes from SD rats were treated with SM, total saponins of Panax ginseng (TSPG), L-carnitine (LC) and trimetazidine (TMZ). Changes in glucose, free fatty acids (FFAs), pyruvic acid (PA), lactic acid (LA) and intracellular ATP capacity were observed with the appropriate assays. For each treatment group, the key enzymes and transporters of myocardial energy metabolism were detected and compared via Western blot. Furthermore, impairments after I/R were assessed by examining cardiomyocyte apoptosis and LDH and PK activity in the culture medium. Our results indicated that SM and TSPG markedly alleviated the decrease in key enzymes and transporters and the utilization of metabolic substrates following I/R, while SM prevented aberrant apoptosis and restored the depleted ATP resulting from I/R. Notably, the effects of SM were superior to those of its main components TSPG, LC and TMZ. Thus, the protective effect of SM in ischemic cardiomyopathy may be mediated by the upregulation of key enzymes and restoration of the depleted ATP content in the energy metabolism process.
Keywords: Shenmai; cardiomyocytes; energy metabolism; ischemia-reperfusion; total saponins of Panax ginseng.
Conflict of interest statement
None.
Figures
Similar articles
-
Effects of Shenmai injection and its bioactive components following ischemia/reperfusion in cardiomyocytes.Exp Ther Med. 2015 Oct;10(4):1348-1354. doi: 10.3892/etm.2015.2662. Epub 2015 Jul 28. Exp Ther Med. 2015. PMID: 26622490 Free PMC article.
-
The protective effect of trimetazidine on myocardial ischemia/reperfusion injury through activating AMPK and ERK signaling pathway.Metabolism. 2016 Mar;65(3):122-30. doi: 10.1016/j.metabol.2015.10.022. Epub 2015 Oct 19. Metabolism. 2016. PMID: 26892523 Free PMC article.
-
Ophiopogonin D Reduces Myocardial Ischemia-Reperfusion Injury via Upregulating CYP2J3/EETs in Rats.Cell Physiol Biochem. 2018;49(4):1646-1658. doi: 10.1159/000493500. Epub 2018 Sep 18. Cell Physiol Biochem. 2018. PMID: 30227401
-
Protective Effects and Target Network Analysis of Ginsenoside Rg1 in Cerebral Ischemia and Reperfusion Injury: A Comprehensive Overview of Experimental Studies.Cells. 2018 Dec 12;7(12):270. doi: 10.3390/cells7120270. Cells. 2018. PMID: 30545139 Free PMC article. Review.
-
Regulation by carnitine of myocardial fatty acid and carbohydrate metabolism under normal and pathological conditions.Basic Res Cardiol. 2000 Apr;95(2):75-83. doi: 10.1007/s003950050167. Basic Res Cardiol. 2000. PMID: 10826498 Review.
Cited by
-
Circular RNA_101237 mediates anoxia/reoxygenation injury by targeting let‑7a‑5p/IGF2BP3 in cardiomyocytes.Int J Mol Med. 2020 Feb;45(2):451-460. doi: 10.3892/ijmm.2019.4441. Epub 2019 Dec 23. Int J Mol Med. 2020. PMID: 31894303 Free PMC article.
-
Comparison of Protective Effects of Shenmai Injections Produced by Medicinal Materials from Different Origins on Cardiomyocytes.Evid Based Complement Alternat Med. 2022 Mar 18;2022:7205476. doi: 10.1155/2022/7205476. eCollection 2022. Evid Based Complement Alternat Med. 2022. PMID: 35341144 Free PMC article.
-
Effect and possible mechanisms of saponins in Chinese herbal medicine exerts for the treatment of myocardial ischemia-reperfusion injury in experimental animal: a systematic review and meta-analysis.Front Cardiovasc Med. 2023 Jul 26;10:1147740. doi: 10.3389/fcvm.2023.1147740. eCollection 2023. Front Cardiovasc Med. 2023. PMID: 37564906 Free PMC article. Review.
-
The Neuroprotective Effect of Shenmai Injection on Oxidative Stress Injury in PC12 Cells Based on Network Pharmacology.Evid Based Complement Alternat Med. 2022 May 27;2022:6969740. doi: 10.1155/2022/6969740. eCollection 2022. Evid Based Complement Alternat Med. 2022. PMID: 35668778 Free PMC article.
-
Efficacy and Safety of Traditional Chinese Medicine Injections for Heart Failure With Reduced Ejection Fraction: A Bayesian Network Meta-Analysis of Randomized Controlled Trials.Front Pharmacol. 2021 Nov 30;12:659707. doi: 10.3389/fphar.2021.659707. eCollection 2021. Front Pharmacol. 2021. PMID: 34916929 Free PMC article. Review.
References
-
- Lesnefsky EJ, Moghaddas S, Tandler B, Kerner J, Hoppel CL. Mitochondrial dysfunction in cardiac disease: ischemia--reperfusion, aging, and heart failure. J Mol Cell Cardiol. 2001;33:1065–1089. - PubMed
-
- He K, Yan L, Pan CS, Liu YY, Cui YC, Hu BH, Chang X, Li Q, Sun K, Mao XW, Fan JY, Han JY. ROCK-dependent ATP5D modulation contributes to the protection of notoginsenoside NR1 against ischemia-reperfusion-induced myocardial injury. Am J Physiol Heart Circ Physiol. 2014;307:H1764–1776. - PubMed
-
- Rouslin W, Broge CW, Grupp IL. ATP depletion and mitochondrial functional loss during ischemia in slow and fast heart-rate hearts. Am J Physiol. 1990;259:H1759–1766. - PubMed
LinkOut - more resources
Full Text Sources