. 2019 Aug 7:5:27.
doi: 10.1038/s41540-019-0104-5. eCollection 2019.

Identification of hyper-rewired genomic stress non-oncogene addiction genes across 15 cancer types

Affiliations

Identification of hyper-rewired genomic stress non-oncogene addiction genes across 15 cancer types

Jessica Xin Hjaltelin et al. NPJ Syst Biol Appl. .

Abstract

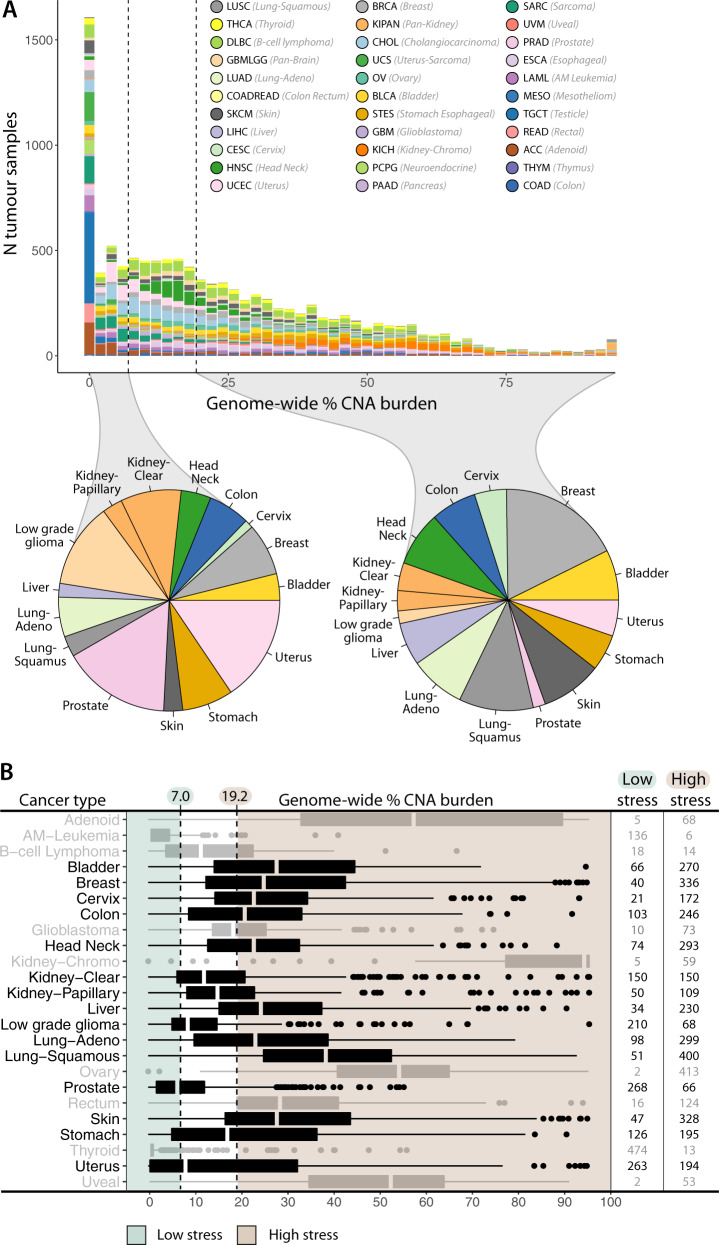
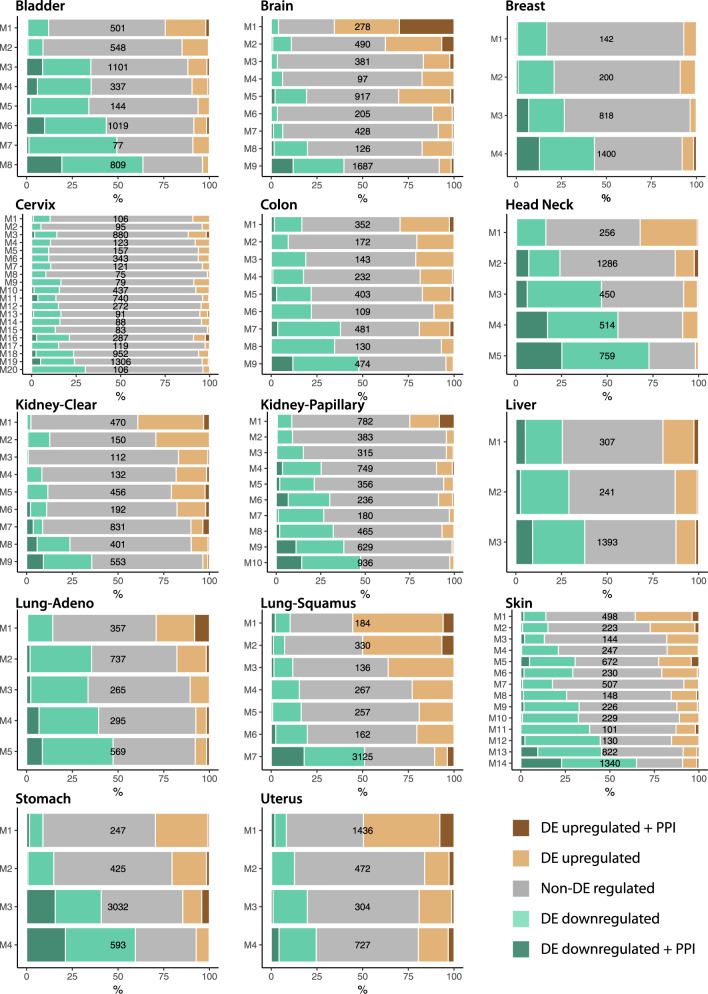
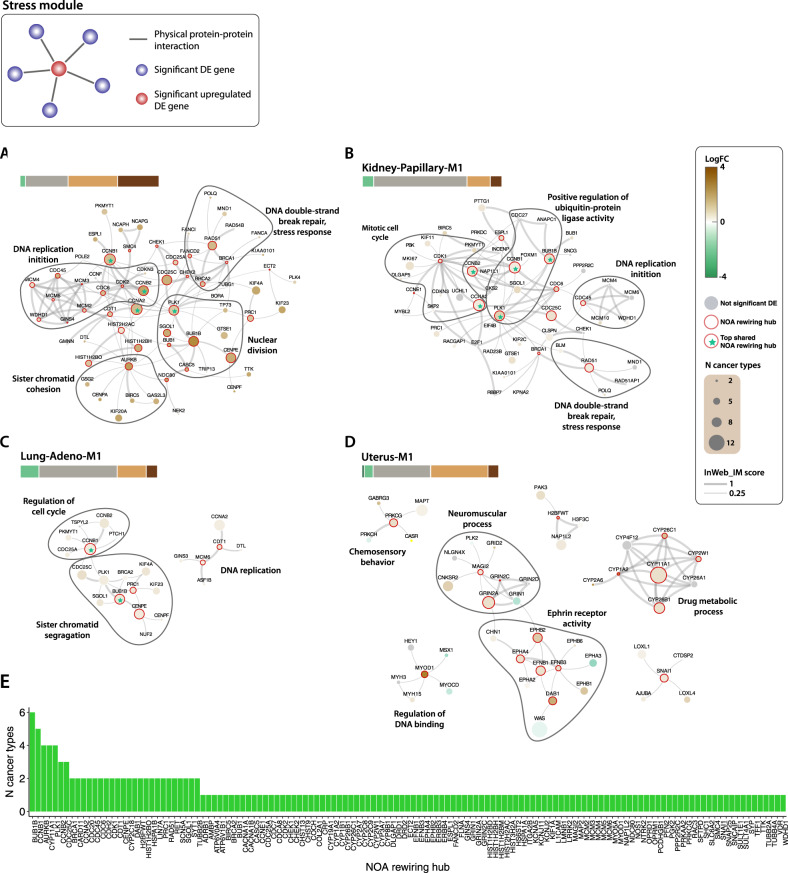
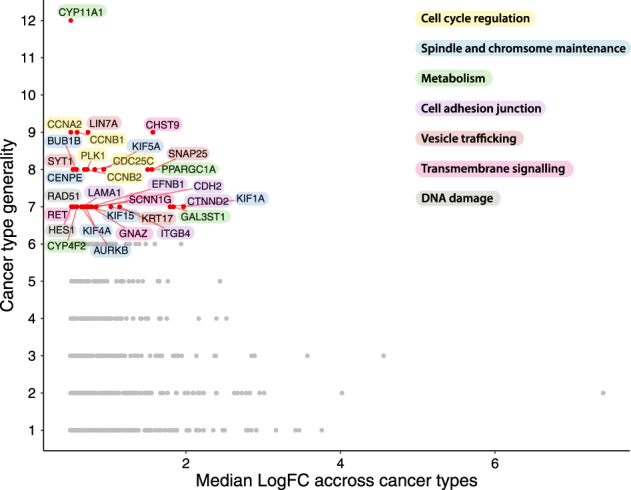
Non-oncogene addiction (NOA) genes are essential for supporting the stress-burdened phenotype of tumours and thus vital for their survival. Although NOA genes are acknowledged to be potential drug targets, there has been no large-scale attempt to identify and characterise them as a group across cancer types. Here we provide the first method for the identification of conditional NOA genes and their rewired neighbours using a systems approach. Using copy number data and expression profiles from The Cancer Genome Atlas (TCGA) we performed comparative analyses between high and low genomic stress tumours for 15 cancer types. We identified 101 condition-specific differential coexpression modules, mapped to a high-confidence human interactome, comprising 133 candidate NOA rewiring hub genes. We observe that most modules lose coexpression in the high-stress state and that activated stress modules and hubs take part in homoeostasis maintenance processes such as chromosome segregation, oxireductase activity, mitotic checkpoint (PLK1 signalling), DNA replication initiation and synaptic signalling. We furthermore show that candidate NOA rewiring hubs are unique for each cancer type, but that their respective rewired neighbour genes largely are shared across cancer types.

Keywords: Cancer; Computational biology and bioinformatics.


Conflict of interest statement

Competing interestsThe authors declare no competing interests.

Figures

Fig. 1
Fig. 1
Defining stress phenotypes. a Genome-wide % CNA burden distribution quartiles for defining stress groups. The CNA burden distribution for all TCGA cancer types (n = 33) with CNA profiles (n = 11,034) was used to define the stress phenotype groups indicated by the dashed lines at 7.0% (low stress) and 19.2% (high stress). The pie charts represent the distribution of cancer types within the selected samples that are used for analysis (n = 5367) covering the 15 cancer types. Some of the cancer types are altered to match the RNA-Seq data set such as KIPAN (to Kidney-Clear and Kidney-Papillary) and STES (to Stomach). The grey cancer names are those used in this paper (for full names see Supplementary Table S1). b CNA burden distributions for tumour samples applied in the analyses. Of the 33 cancer types, 24 cancer types have both RNA-Seq and CNA samples, which is needed for our analyses. Furthermore, cancer types with at least 20 samples in both high and low-stress groups were included in the comparative analyses. This resulted in including 15 cancer types (black) and excluding 9 (grey). The cancer types left have in concert 3356 stress and 1601 non-stress phenotype samples. Onwards, we will refer to ‘Brain’ as LGG, since only this brain cancer type is used for further analyses
Fig. 2
Fig. 2
High stress differential coexpression modules across 14 cancer types. Differential coexpression modules were obtained for high stress vs. low-stress samples using differential coexpression analysis, for 15 cancer types. No modules were found for prostate. The differential coexpression modules were mapped to a physical human protein interactome. In addition, differential gene expression was performed on the same stress groups. The brown and turquoise fractions illustrate significant differentially up or down expressed genes, respectively. Darker areas are genes that participate in a physical protein–protein interaction. Grey areas are genes that are not differentially expressed. Numbers within each bar are the number of genes per module. DE: differential expression; PPI: protein–protein interaction
Fig. 3
Fig. 3
Four stress-activated modules. We selected the four modules with the highest fraction of upregulated genes with physical interactions. Here, we show the NOA rewiring hubs with their first-level interactors. The modules are enriched for cell stress maintenance functions such as DNA double-stranded break repair, stress response, chromatid segregation and DNA replication regulation. The sizes of the nodes are the number of differential modules that the gene is part of across cancer types. Grey nodes indicate that these genes were not significantly differentially expressed. a Brain module 1. b Kidney-Papillary module 1. c Lung-Adeno module 1. d Uterus module 1. e LogFC: Log2 fold change
Fig. 4
Fig. 4
Upregulated stress module genes across cancer types. The generality of upregulated stress module genes is shown across cancer types. Genes with Log2FC ≥ 0.5 participating in more than six cancer types (differential modules) are labelled (see Supplementary Table S5 for rest). The functions of the genes have been grouped into seven main categories illustrated by the colours of the gene labels
Fig. 5
Fig. 5
Rewiring characteristics across cancer types. a Rewiring gene similarity. The overlaps between NOA rewiring hub genes were calculated using the Jaccard index. Numbers in the diagonal represent the number of NOA rewiring hub genes per cancer type. b Neighbour similarity. The overlaps between neighbour genes of NOA rewiring hub genes were calculated using the Jaccard index. Numbers in the diagonal represent the number of neighbour genes of the NOA rewiring hub genes per cancer type

References

    1. Solimini NL, Luo J, Elledge SJ. Non-oncogene addiction and the stress phenotype of cancer cells. Cell. 2007;130:986–988. doi: 10.1016/j.cell.2007.09.007. - DOI - PubMed
    1. Nagel R, et al. Drugging the addict: non-oncogene addiction as a target for cancer therapy. EMBO Rep. 2016;17:1516–1531. doi: 10.15252/embr.201643030. - DOI - PMC - PubMed
    1. Califano A, Alvarez MJ. The recurrent architecture of tumour initiation, progression and drug sensitivity. Nat. Rev. Cancer. 2016;17:116–130. doi: 10.1038/nrc.2016.124. - DOI - PMC - PubMed
    1. Luo J, Solimini NL, Elledge SJ. Principles of cancer therapy: oncogene and non-oncogene addiction. Cell. 2009;136:823–837. doi: 10.1016/j.cell.2009.02.024. - DOI - PMC - PubMed
    1. Costanzo M, et al. A global genetic interaction network maps a wiring diagram of cellular function. Science. 2016;353:aaf1420–aaf1420. doi: 10.1126/science.aaf1420. - DOI - PMC - PubMed

Publication types