. 2019:1:e190008.
doi: 10.20900/immunometab20190008. Epub 2019 Jul 19.

Single-Cell RNA Sequencing of Visceral Adipose Tissue Leukocytes Reveals that Caloric Restriction Following Obesity Promotes the Accumulation of a Distinct Macrophage Population with Features of Phagocytic Cells

Affiliations

Single-Cell RNA Sequencing of Visceral Adipose Tissue Leukocytes Reveals that Caloric Restriction Following Obesity Promotes the Accumulation of a Distinct Macrophage Population with Features of Phagocytic Cells

Ada Weinstock et al. Immunometabolism. 2019.

Abstract

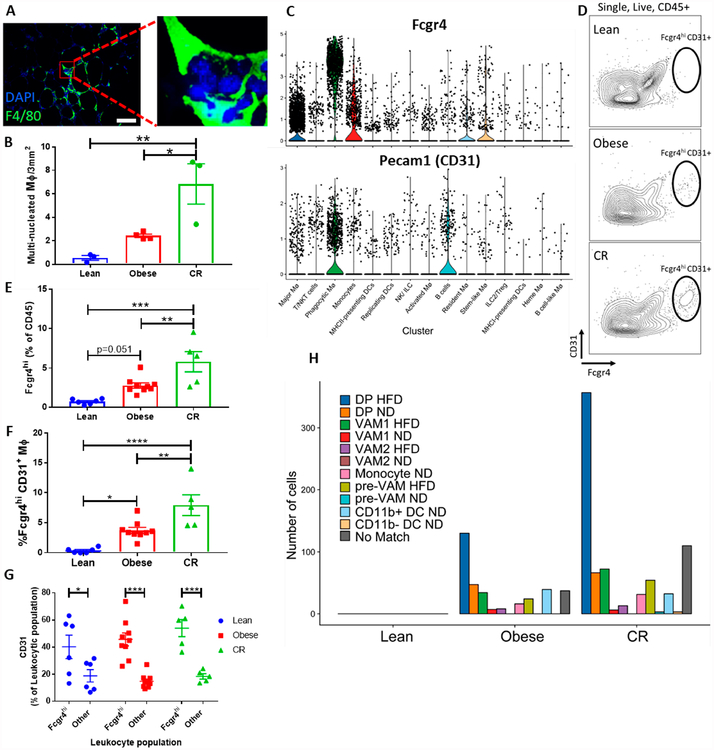
Obesity can lead to type 2 diabetes and is an epidemic. A major contributor to its adverse effects is inflammation of the visceral adipose tissue (VAT). Life-long caloric restriction (CR), in contrast, results in extended lifespan, enhanced glucose tolerance/insulin sensitivity, and other favorable phenotypes. The effects of CR following obesity are incompletely established, but studies show multiple benefits. Many leukocyte types, macrophages predominantly, reside in VAT in homeostatic and pathological states. CR following obesity transiently increases VAT macrophage content prior to resolution of inflammation and obesity, suggesting that macrophage content and phenotype play critical roles. Here, we examined the heterogeneity of VAT leukocytes and the effects of obesity and CR. In general, our single-cell RNA-sequencing data demonstrate that macrophages are the most abundant and diverse subpopulation of leukocytes in VAT. Obesity induced significant transcriptional changes in all 15 leukocyte subpopulations, with many genes showing coordinated changes in expression across the leukocyte subpopulations. Additionally, obese VAT displayed expansion of one major macrophage subpopulation, which, in silico, was enriched in lipid binding and metabolic processes. This subpopulation returned from dominance in obesity to lean proportions after only 2 weeks of CR, although the pattern of gene expression overall remained similar. Surprisingly, CR VAT is dominated by a different macrophage subpopulation, which is absent in lean conditions. This subpopulation is enriched in genes related to phagocytosis and we postulate that its function includes clearance of dead cells, as well as excess lipids, contributing to limiting VAT inflammation and restoration of the homeostatic state.

Keywords: adipose tissue; caloric-restriction; heterogeneity; leukocytes; macrophages; obesity; phagocytosis; single-cell RNA-seq; weight loss.


Conflict of interest statement

CONFLICT OF INTEREST The authors declare that there are no conflicts of interest.

Figures

Figure 1.
Figure 1.. Single cell transcriptome analysis of mouse visceral adipose tissue leukocytes identifies 15 distinct subpopulations.
(A) Diagram of experimental design. (B) t-Stochastic neighbor embedding (t-SNE) plot of 9958 VAT leukocytes from lean (reference [22]), obese and CR conditions, separated into 15 distinct clusters. (C) Overall proportion of leukocyte clusters in the VAT. (D) Representation of the t-SNE plot showing treatment of origin.
Figure 2.
Figure 2.. VAT leukocytes show functional and inter-cluster heterogeneity.
(A) t-SNE representation and (B) proportion of the main VAT leukocyte cell types, assigned by SingleR, using average gene expression per cluster. (C) KEGG pathways of differentially expressed genes of different clusters. (D) Cell type distribution in each cluster, assigned by SingleR, using the expression profiles of individual cells. (E) Heatmap of the 5 most differentially expressed genes per cluster. (F) Proportion of monocytes/MØ in the VAT.
Figure 3.
Figure 3.. Obesity drastically alters both proportions and gene expression of VAT MØs.
(A) Proportion of VAT leukocyte subtypes in lean (right) and obese (left) conditions. (B) Volcano plot of differentially expressed genes in MØs from obese versus lean VAT (p-adjusted < 0.05). (C) Heatmap of genes that are significantly differentially expressed per cluster between obese and lean conditions, including GO terms for gene groups that show the largest differential expression. The Phagocytic MØ subpopulation is absent in lean conditions and thus not included in this analysis.
Figure 4.
Figure 4.. Short caloric restriction reverts some leukocyte subpopulations back to lean proportions, while gene expression remains similar to the obese state.
(A) Distribution of VAT leukocyte subtypes in lean (red), obese (green), and CR (blue) conditions. (B) Stratification of genes whose expression was recovered (red) or not recovered (green) to the lean expression pattern following CR, or showed an expression pattern that is >10% different from either lean or obese (blue). The Phagocytic MØ subpopulation is absent in lean conditions and thus not included in this analysis. Schematic of the stratification strategy (top). (C) Distribution of the number of clusters that share the expression pattern of differentially expressed genes in each of the recovery gene groups. (D) KEGG pathways significantly enriched in each of the gene recovery states.
Figure 5.
Figure 5.. Pseudotime analysis shows distinct trajectories of the Major and Phagocytic MØs in obesity and caloric restriction.
(A) Pseudotime analysis was performed using Monocle of the lean, obese and CR merged dataset for all monocytes/MØs. Monocytes were defined as the root population. Pie charts indicate the proportion of cells from each cluster that are assigned to each branch of the pseudotime trajectory. Percentages indicate the proportion of all monocytes/MØs that are assigned to each branch. (B) Top 100 genes that distinguish cells in branch point B of the pseudotime, with their related KEGG and GO terms.
Figure 6.
Figure 6.. Validation of the presence of a specialized phagocytic MØ cluster.
(A) Representative images of VAT stained with the MØ marker F4/80 (green) and a nuclear stain (DAPI, blue). Scale bar: 50 μm. (B) Quantification of multi-nucleated MØ (n = 3–4). (C) Violin plots showing increased expression of Fcgr4 and Pecam1 (CD31) in the Phagocytic MØ cluster. (D) Representative flow-cytometry counterplots of CD31 and Fcgr4hi cells gated from single, live, CD45+ cells. (E,F) Quantification of the proportion of Fcgrhi from (E) CD45+ or (F) CD11b + F4/80+ MØs in lean, obese and CR VAT (n = 6–9). (G) Proportion of CD31+ from either Fcgrhi or all other leukocytes in the VAT. (H) Distribution of cells from the Phagocytic MØ cluster that significantly (p < 0.1) matched with populations from Silva HM et al. *p < 0.05, **p < 0.01, ***p < 0.001, ****p < 0.0001, using 1-way ANOVA with Tukey multiple comparisons testing (B,E,F) or 2-way ANOVA with Sidak multiple comparisons testing (G).

References

    1. Ferrante AW Jr. The immune cells in adipose tissue. Diabetes Obes Metab. 2013;15(Suppl 3):34–8. - PMC - PubMed
    1. Weisberg SP, McCann D, Desai M, Rosenbaum M, Leibel RL, Ferrante AW Jr. Obesity is associated with macrophage accumulation in adipose tissue. J Clin Invest. 2003;112(12):1796–808. - PMC - PubMed
    1. Wu H, Ghosh S, Perrard XD, Feng L, Garcia GE, Perrard JL, et al. T-cell accumulation and regulated on activation, normal T cell expressed and secreted upregulation in adipose tissue in obesity. Circulation. 2007;115(8):1029–38. - PubMed
    1. Boutens L, Hooiveld GJ, Dhingra S, Cramer RA, Netea MG, Stienstra R. Unique metabolic activation of adipose tissue macrophages in obesity promotes inflammatory responses. Diabetologia. 2018;61(4):942–53. - PMC - PubMed
    1. Olefsky JM, Glass CK. Macrophages, inflammation, and insulin resistance. Annu Rev Physiol. 2010;72:219–46. - PubMed