. 2019 Aug 2:5:21.
doi: 10.1038/s41523-019-0116-8. eCollection 2019.

Heterocellular gene signatures reveal luminal-A breast cancer heterogeneity and differential therapeutic responses

Affiliations

Heterocellular gene signatures reveal luminal-A breast cancer heterogeneity and differential therapeutic responses

Pawan Poudel et al. NPJ Breast Cancer. .

Abstract

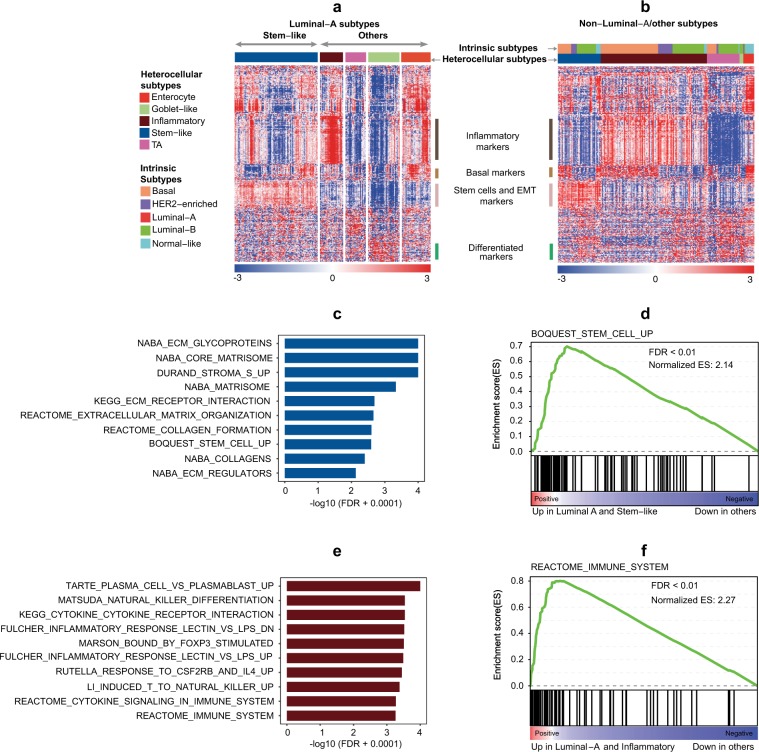
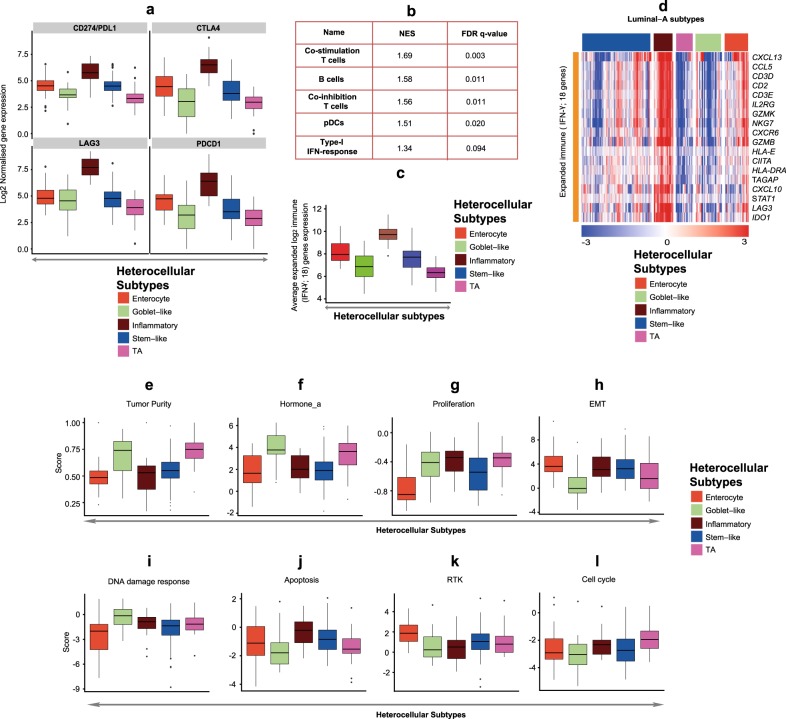
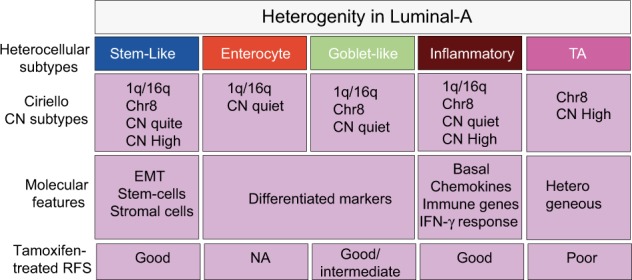
Breast cancer is a highly heterogeneous disease. Although differences between intrinsic breast cancer subtypes have been well studied, heterogeneity within each subtype, especially luminal-A cancers, requires further interrogation to personalize disease management. Here, we applied well-characterized and cancer-associated heterocellular signatures representing stem, mesenchymal, stromal, immune, and epithelial cell types to breast cancer. This analysis stratified the luminal-A breast cancer samples into five subtypes with a majority of them enriched for a subtype (stem-like) that has increased stem and stromal cell gene signatures, representing potential luminal progenitor origin. The enrichment of immune checkpoint genes and other immune cell types in two (including stem-like) of the five heterocellular subtypes of luminal-A tumors suggest their potential response to immunotherapy. These immune-enriched subtypes of luminal-A tumors (containing only estrogen receptor positive samples) showed good or intermediate prognosis along with the two other differentiated subtypes as assessed using recurrence-free and distant metastasis-free patient survival outcomes. On the other hand, a partially differentiated subtype of luminal-A breast cancer with transit-amplifying colon-crypt characteristics showed poor prognosis. Furthermore, published luminal-A subtypes associated with specific somatic copy number alterations and mutations shared similar cellular and mutational characteristics to colorectal cancer subtypes where the heterocellular signatures were derived. These heterocellular subtypes reveal transcriptome and cell-type based heterogeneity of luminal-A and other breast cancer subtypes that may be useful for additional understanding of the cancer type and potential patient stratification and personalized medicine.

Keywords: Cancer genomics; Tumour heterogeneity.


Conflict of interest statement

Competing interestsA.S. has ownership interest as a patent inventor for a patent entitled “Colorectal cancer classification with differential prognosis and personalized therapeutic responses” (patent number PCT/IB2013/060416). A.S. has research funding from Bristol-Myers Squibb and Merck KgaA. M.C.U.C. has a patent: US Patent No. 9,631,239 with royalties paid. The rest of the authors declare that there are no competing interests.

Figures

Fig. 1
Fig. 1
Association of breast cancer with heterocellular subtypes. a Heatmap showing the expression of the top highly variable genes (standard deviation; SD > 2), specifically immune genes, and their association with breast cancer subtype samples (n = 817) from TCGA. Highlighted genes represent selected immune specific genes that show high expression in multiple subtypes. b Proportion of CMS subtypes in multiple breast cancer data sets–TCGA (n = 671) and GSE42568 (n = 69). c Proportion of heterocellular subtypes in multiple breast cancer data sets–TCGA (n = 407) and GSE42568 (n = 63). Although heterocellular signatures were derived from entirely different cancer type (CRC), we observed that about half of the breast cancer samples were classified into all of the five heterocellular subtypes (stringent cutoff was used for mixed/low-confidence sample selection as discussed; Supplementary Table 1c). d Heatmap showing sample enrichment analysis using hypergeometric test-based FDR values comparing heterocellular subtypes (y axis) with intrinsic gene expression subtypes (x axis) in the TCGA breast cancer data set (n = 407; Supplementary Table 1e–g). e Pie chart showing proportions of different heterocellular subtypes in luminal-A breast cancer samples (total n = 202; enterocyte (n = 31), goblet-like (n = 34), inflammatory (n = 25), stem-like (n = 90), TA (n = 22); TCGA breast cancer). Only those samples classified into subtypes with high confidence by the CMS and heterocellular classifiers were shown in be). Summary of low and high confidence samples for both subtype classifications are shown in Supplementary Tables 1a–d and 2a–d and described in Methods section
Fig. 2
Fig. 2
Heterocellular subtype-based heterogeneity in luminal-A breast cancers. a, b Heatmap showing the expression of the top highly variable and selected marker genes (371 genes from SD > 1.5 gene list shown in Supplementary Table 2e) between stem-like (n = 90) and other subtypes (n = 112) within the a luminal-A breast cancer subtype (n = 202; Supplementary Figure 1m) and b subtypes other than luminal-A (non-luminal-A) from TCGA breast cancer data (n = 205). cf GSEA analysis showing gene sets enriched in c, d stem-like and e, f inflammatory heterocellular subtype samples compared with the other subtypes (n = 202; stem-like (n = 90), inflammatory (n = 25), other subtypes (n = 87)) from TCGA breast cancer. Relevant gene sets that were enriched were shown in cf (See Supplementary Table 1k, l for the top gene sets that were ordered by significance of FDR values). KEGG—Kyoto Encyclopedia of Genes and Genomes; EMT—epithelial-to-mesenchymal transition
Fig. 3
Fig. 3
Enrichment of immune checkpoint genes, immune cells, expanded immune (18-gene) signature and other phenotypes in luminal-A heterocellular subtypes. a Box plots showing differences in the expression of immune checkpoint genes CD274 (PDL1), CTLA4, LAG3, and PDCD1 between heterocellular subtypes (n = 202; enterocyte (n = 31), goblet-like (n = 34), inflammatory (n = 25), stem-like (n = 90), TA (n = 22); TCGA breast cancer). Kruskal–Wallis test was performed to calculate p and their corresponding FDR values. Those associations with FDR < 0.05 was considered significant. b Gene set enrichment analysis (GSEA) showing immune cell types enriched in inflammatory heterocellular subtype samples compared to the other subtypes using the Rooney et al. gene sets (n = 202; inflammatory (n = 25) and other subtypes (n = 177); TCGA breast cancer). Those associations with FDR < 0.1 was considered significant. c Boxplot showing differences in sample-wise average gene expression of 18 published expanded immune (18-gene) signature in heterocellular subtypes. Kruskal–Wallis test was performed to calculate p values. p < 0.05 was considered significant (n = 202; enterocyte (n = 31), goblet-like (n = 34), inflammatory (n = 25), stem-like (n = 90), TA (n = 22); TCGA breast cancer). d Heatmap showing the expression of eighteen published expanded immune (18-gene) signature genes between heterocellular subtypes from luminal-A breast cancers (n = 202; enterocyte (n = 31), goblet-like (n = 34), inflammatory (n = 25), stem-like (n = 90), TA (n = 22); TCGA breast cancer). el Boxplots showing differences in e tumor purity, f hormone_a, g proliferation, h EMT, i DNA damage response, j apoptosis, k RTK, and l cell cycle scores from TCGA between heterocellular subtypes. The data from fl were from RPPA data-based scores published by TCGA. Kruskal–Wallis test was performed to calculate p and their corresponding FDR values. Those associations with FDR < 0.05 was considered significant. pDCs—plasmocytoid dentric cells; NES—normalized enrichment score; FDR—false discovery rate; EMT—epithelial–mesenchymal transition; RTK—receptor tyrosine kinase
Fig. 4
Fig. 4
Association of heterocellular subtypes with published other luminal-A breast cancer subtype classifications. a, b Bar plots showing the percentage of a heterocellular subtypes in Ciriello subgroups of luminal-A subtype (1q/16q (n = 28), Chr8-associated (n = 18), CN quiet (n = 8), CN high (n = 6)) and b vice versa (enterocyte (n = 5), goblet-like (n = 9), inflammatory (n = 8), stem-like (n = 32), TA (n = 6), p < 0.02, Chi-square test; Supplementary Table 1n–p). We did not compare our heterocellular subtype to “mixed” subtype of Cirello, as it is reported to lack any decipherable patterns of chromosomal changes. Data for a-b) are from TCGA breast cancer. c Heatmap showing sample enrichment analysis using hypergeometric test-based FDR values comparing heterocellular subtype classification (y axis) with two Netanely et al. luminal-A breast cancer subtypes (x axis). d Bar plot showing percentage of different heterocellular subtypes in two Netanely et al., luminal-A breast cancer subtypes (LumA-R1 (n = 95), LumA-R2 (n = 102); p < 0.02, Chi-square test; Supplementary Table 1q–s). Only those samples classified into subtypes with high confidence from heterocellular subtype classification are shown in ad
Fig. 5
Fig. 5
Survival differences in heterocellular subtypes from ER-positive tamoxifen-treated samples. ac Kaplan–Meier survival curve showing tamoxifen-treated RFS (GSE6532; Supplementary Table 1w–y) between the a heterocellular subtypes, b groups from Risk of Recurrence (ROR,) and c risk groups from OncotypeDX from ER-positive breast cancer samples from microarray data. d A plot showing concordance index and associated confidence intervals for RFS between heterocellular subtypes and ROR/OncotypeDX groups. Log-rank test was performed for the p values. RFS–recurrence free survival; CI–confidence interval
Fig. 6
Fig. 6
Summary of the luminal-A heterocellular subtypes and their characteristics. EMT—epithelial-to-mesenchymal transition; RFS—recurrence free survival; CN—copy number; chr-8—chromosome 8 associated; TA—transit amplifying; NA—not enough data available to conclude

Similar articles

Cited by

References

    1. Perou CM, et al. Molecular portraits of human breast tumours. Nature. 2000;406:747–752. doi: 10.1038/35021093. - DOI - PubMed
    1. Curtis C, et al. The genomic and transcriptomic architecture of 2,000 breast tumours reveals novel subgroups. Nature. 2012;486:346–352. doi: 10.1038/nature10983. - DOI - PMC - PubMed
    1. Ciriello G, et al. The molecular diversity of Luminal A breast tumors. Breast cancer Res. Treat. 2013;141:409–420. doi: 10.1007/s10549-013-2699-3. - DOI - PMC - PubMed
    1. Higgins MJ, Stearns V. Understanding resistance to tamoxifen in hormone receptor-positive breast cancer. Clin. Chem. 2009;55:1453–1455. doi: 10.1373/clinchem.2009.125377. - DOI - PubMed
    1. Ring A, Dowsett M. Mechanisms of tamoxifen resistance. Endocr. Relat. Cancer. 2004;11:643–658. doi: 10.1677/erc.1.00776. - DOI - PubMed