. 2020 Jan;57(1):539-550.
doi: 10.1007/s12035-019-01722-6. Epub 2019 Aug 8.

Knock-in of Mutated hTAU Causes Insulin Resistance, Inflammation and Proteostasis Disturbance in a Mouse Model of Frontotemporal Dementia

Affiliations

Knock-in of Mutated hTAU Causes Insulin Resistance, Inflammation and Proteostasis Disturbance in a Mouse Model of Frontotemporal Dementia

Claire Hull et al. Mol Neurobiol. 2020 Jan.

Abstract

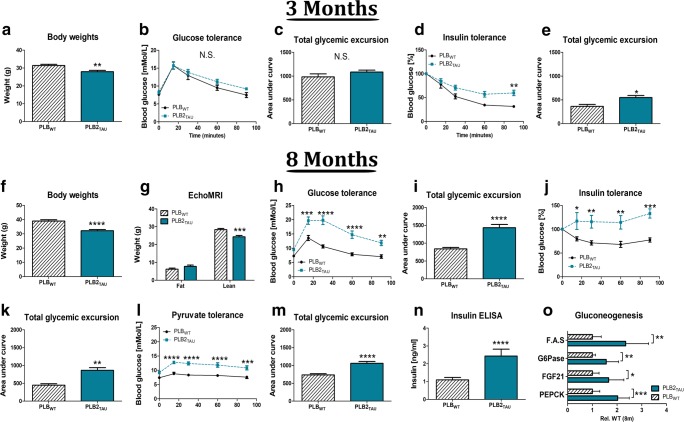
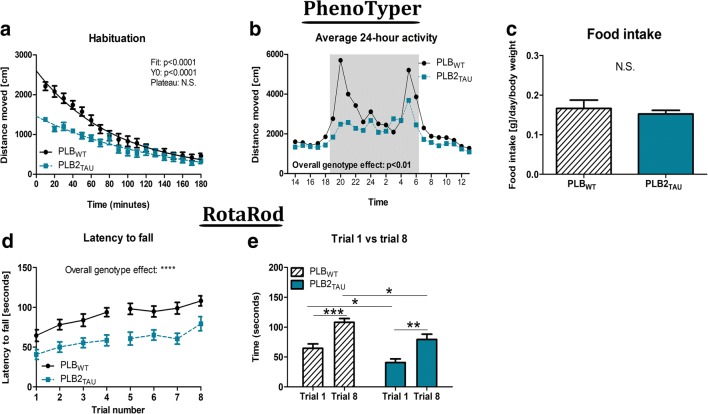
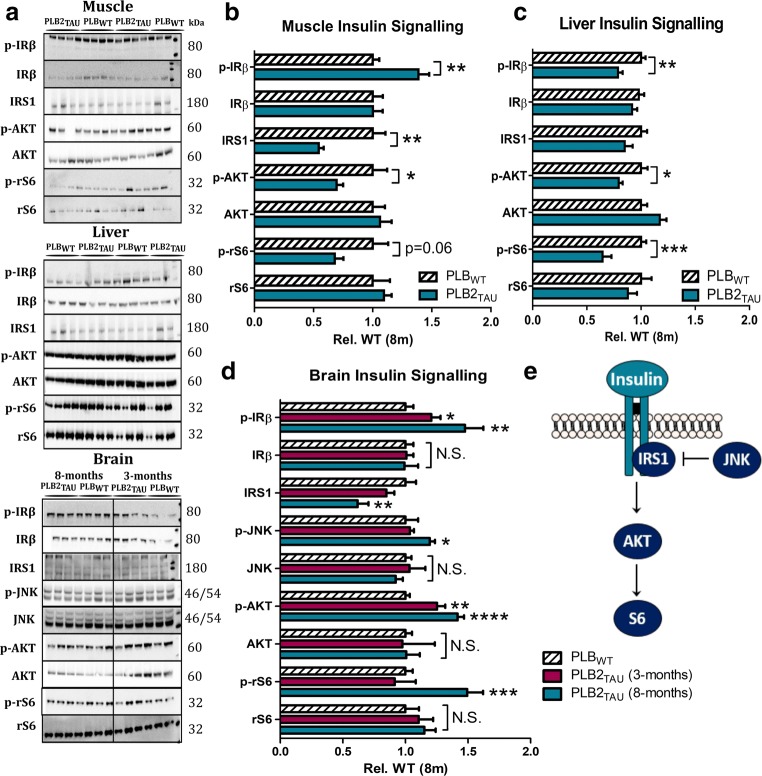
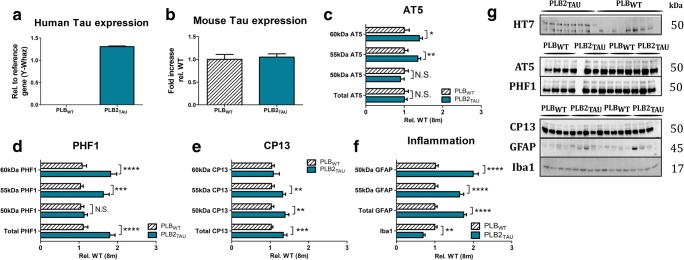
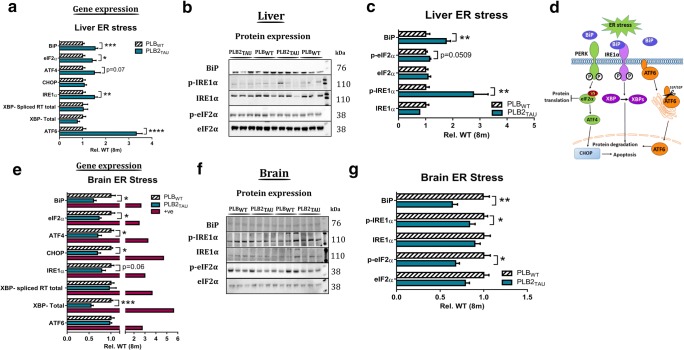
Diabetes and obesity have been implicated as risk factors for dementia. However, metabolic mechanisms and associated signalling pathways have not been investigated in detail in frontotemporal dementia. We therefore here characterised physiological, behavioural and molecular phenotypes of 3- and 8-month-old male tau knock-in (PLB2TAU) vs wild-type (PLBWT) mice. Homecage analysis suggested intact habituation but a dramatic reduction in exploratory activity in PLB2TAU mice. Deficits in motor strength were also observed. At 3 months, PLB2TAU mice displayed normal glucose handling but developed hyperglycaemia at 8 months, suggesting a progressive diabetic phenotype. Brain, liver and muscle tissue analyses confirmed tissue-specific deregulation of metabolic and homeostatic pathways. In brain, increased levels of phosphorylated tau and inflammation were detected alongside reduced ER regulatory markers, overall suggesting a downregulation in essential cellular defence pathways. We suggest that subtle neuronal expression of mutated human tau is sufficient to disturb systems metabolism and protein handling. Whether respective dysfunctions in tauopathy patients are also a consequence of tau pathology remains to be confirmed, but could offer new avenues for therapeutic interventions.

Keywords: Diabetes; ER stress; Glucose; Insulin; Knock-in; Proteinopathy; Transgenic; UPR.


Figures

Fig. 1
Fig. 1
Metabolic phenotype of 3- and 8-month-old male PLBWT (n = 17) and PLB2TAU (n = 10) mice. Three-month-old (PLBWT (n = 7) and PLB2TAU (n = 14)): (a) Body weights. (b, c) Glucose tolerance test (GTT) and quantification of area under the curve (AUC) for total glycaemic excursions. d, e) Insulin tolerance tests (ITTs) and quantification of AUC. 8-month-old: (f) Body weights. (g) EchoMRI. h, i GTT and quantification of AUC for total glycaemic excursions. j, k ITTs and quantification of AUC. l, m Pyruvate tolerance tests (PTTs) and quantification of AUC. n Quantification of insulin levels in serum. o Quantification of qPCR gluconeogenesis markers in liver tissue. N.S., not significant. ****p < 0.0001, ***p < 0.001, **p < 0.01, *p < 0.05
Fig. 2
Fig. 2
Behavioural data in 8-month-old PLBWT (n = 17) and PLB2TAU (n = 10) mice during PhenoTyper home cage analysis and RotaRod task. a Nonlinear regression analysis (one-phase decay) of activity (distanced moved, cm/10 min) during the 3-h habituation period in the PhenoTyper home cage. b Average hourly activity over 24 h. c Average food intake per day relative to body weight. d Latency to fall from RotaRod was overall reduced in PLB2TAU mice vs PLBWT with both groups displaying motor learning (e, trial 1 vs. trial 8). ****p < 0.0001, ***p < 0.001, **p < 0.01, *p < 0.05
Fig. 3
Fig. 3
Insulin signalling in the brain vs periphery. (a) Representative Western blots for insulin signalling markers in the muscle, liver and brain. Quantification of markers in (b) muscle, (c) liver and (d) brain. PLBWT data for the 3-month group were omitted for clarity, but used for statistical analysis, i.e. each age group was assessed relative to their age-matched PLBWT controls. e Simplified schematic showing insulin signalling cascade. All phospho markers are expressed relative to total expression. ****p < 0.0001, ***p < 0.001, **p < 0.01, *p < 0.05
Fig. 4
Fig. 4
Expression of (phosphorylated) tau and inflammatory markers in 8-month-old PLBWT (n = 17) and PLB2TAU (n = 10) mice. a Quantification of human tau expression via qPCR. b Quantification of mouse Tau expression (qPCR). c Quantification of individual bands of total Tau (AT5). d Quantification of individual bands and total expression for phospho Tau (PHF1) expression relative to total Tau. e Quantification of individual bands and total expression for second phospho tau marker (CP13) relative to total Tau. f Quantification of 45 kDa, 50 kDa, and total glial fibrillary acid (GFAP, astrocyte marker) and microglia marker Iba1 levels. g Representative Western blots of phosphorylated tau and inflammation markers in both PLBWT and PLB2TAU male mice at 8 months of age. ****p < 0.0001, ***p < 0.001, **p < 0.01, *p<0.05
Fig. 5
Fig. 5
ER stress gene and protein expression in liver and brain tissue of 8-month-old PLBWT (n = 17) and PLB2TAU (n = 10) mice. a Gene expression changes in ER stress–related markers in liver tissue. b Western blots of phosphorylated IRE1α, total IRE1α, BiP, phosphorylated eIF2α and total eIF2α in liver tissue. c Quantification of ER stress markers in liver tissue. d Simplified ER stress signalling cascade. e Gene expression changes in brain tissue. Positive control (+ve): thapsigargin-treated primary hippocampal cultures. f Western blots of phosphorylated eIF2α, total eIF2α, BiP, phosphorylated IRE1α and total IRE1α in brain tissue. g Quantification of ER stress markers in brain tissue. All phospho markers are expressed relative to total expression. *p < 0.05, **p > 0.01, ***p < 0.001 and ****p < 0.0001
Fig. 6
Fig. 6
Protein synthesis rates in 8-month-old PLBWT (n = 12) and PLB2TAU (n = 9) brain tissue. Protein synthesis rates were measured using an adaption to the SUnSET assay. a Representative Western blot of puromycin (indicative of newly synthesised proteins), vehicle (10% DMSO in aCSF), negative control (-ve, puromycin and thapsigargin) and the left (L) hemisphere over a 2-h period in both PLBWT and PLB2TAU mice at 8 months of age. b Quantification of protein synthesis rates. PLB2TAU mice exhibited an increase in protein translation rates compared to PLBWT controls. ***p < 0.001

References

    1. Querfurth HW, LaFerla FM. Alzheimer’s disease. N Engl J Med. 2010;362:329–344. doi: 10.1056/NEJMra0909142. - DOI - PubMed
    1. Clavaguera F, Bolmont T, Crowther RA, Abramowski D, Frank S, Probst A, Fraser G, Stalder AK, Beibel M, Staufenbiel M, Jucker M, Goedert M, Tolnay M. Transmission and spreading of tauopathy in transgenic mouse brain. Nat Cell Biol. 2009;11:909–913. doi: 10.1038/ncb1901. - DOI - PMC - PubMed
    1. Lauretti E, Li JG, Di Meco A, Praticò D. Glucose deficit triggers tau pathology and synaptic dysfunction in a tauopathy mouse model. Transl Psychiatry. 2017;7:1–9. doi: 10.1038/tp.2016.296. - DOI - PMC - PubMed
    1. Yarchoan M, Toledo JB, Lee EB, Arvanitakis Z, Kazi H, Han LY, Louneva N, Lee VMY, Kim SF, Trojanowski JQ, Arnold SE. Abnormal serine phosphorylation of insulin receptor substrate 1 is associated with tau pathology in Alzheimer’s disease and tauopathies. Acta Neuropathol. 2014;128:679–689. doi: 10.1007/s00401-014-1328-5. - DOI - PMC - PubMed
    1. Marciniak E, Leboucher A, Caron E, Ahmed T, Tailleux A, Dumont J, Issad T, Gerhardt E, Pagesy P, Vileno M, Bournonville C, Hamdane M, Bantubungi K, Lancel S, Demeyer D, Eddarkaoui S, Vallez E, Vieau D, Humez S, Faivre E, Grenier-Boley B, Outeiro TF, Staels B, Amouyel P, Balschun D, Buee L, Blum D. Tau deletion promotes brain insulin resistance. J Exp Med. 2017;214:2257–2269. doi: 10.1084/jem.20161731. - DOI - PMC - PubMed

MeSH terms

LinkOut - more resources