

Single-Molecule Protein Detection in a Biofluid Using a Quantitative Nanopore Sensor
- PMID: 31397162
- PMCID: PMC6764869
- DOI: 10.1021/acssensors.9b00848
Single-Molecule Protein Detection in a Biofluid Using a Quantitative Nanopore Sensor
Abstract
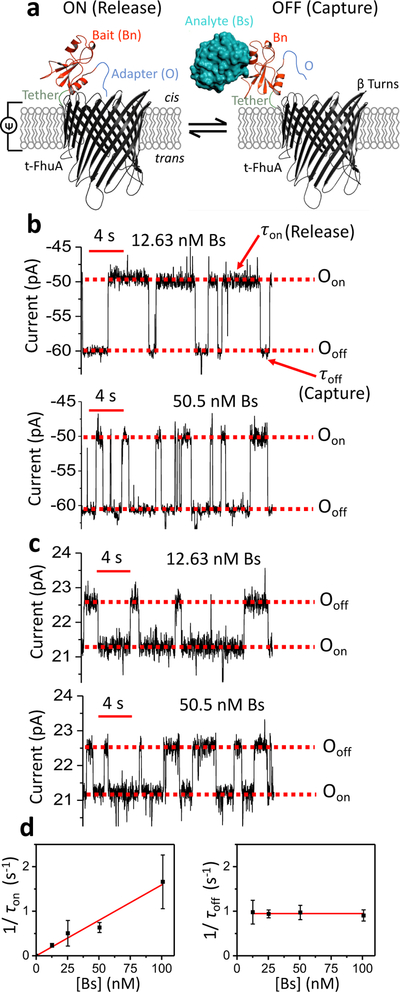
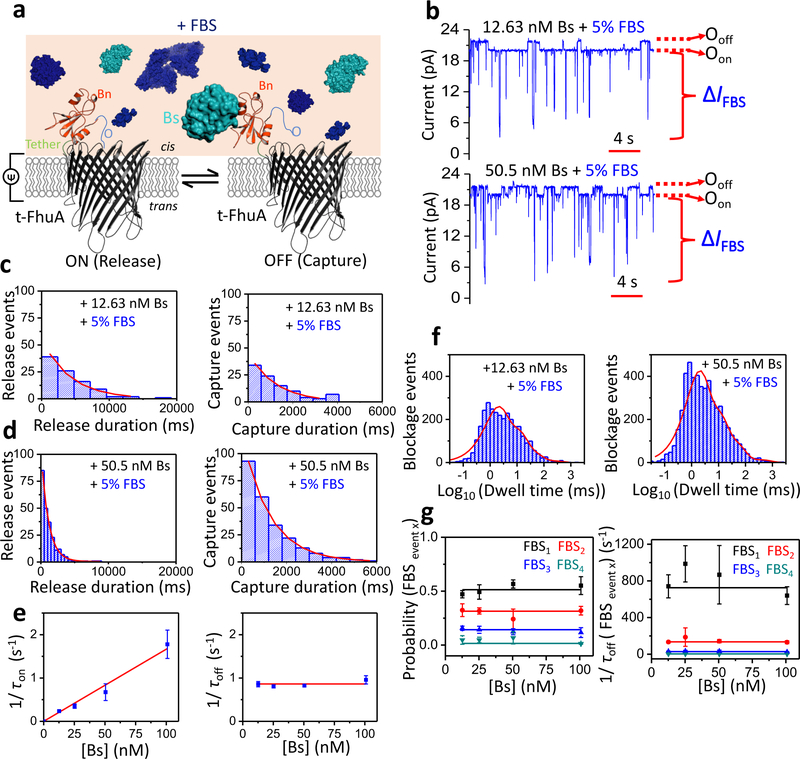
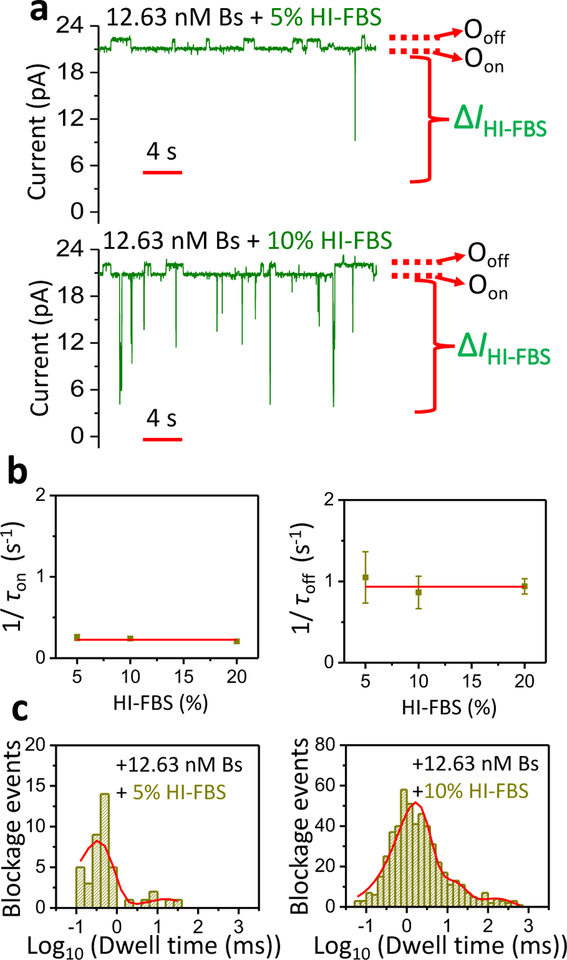
Protein detection in complex biological fluids has wide-ranging significance across proteomics and molecular medicine. Existing detectors cannot readily distinguish between specific and nonspecific interactions in a heterogeneous solution. Here, we show that this daunting shortcoming can be overcome by using a protein bait-containing biological nanopore in mammalian serum. The capture and release events of a protein analyte by the tethered protein bait occur outside the nanopore and are accompanied by uniform current openings. Conversely, nonspecific pore penetrations by nontarget components of serum, which take place inside the nanopore, are featured by irregular current blockades. As a result of this unique peculiarity of the readout between specific protein captures and nonspecific pore penetration events, our selective sensor can quantitatively sample proteins at single-molecule precision in a manner distinctive from those employed by prevailing methods. Because our sensor can be integrated into nanofluidic devices and coupled with high-throughput technologies, our approach will have a transformative impact in protein identification and quantification in clinical isolates for disease prognostics and diagnostics.
Keywords: FhuA; electrophysiology; ion channel; membrane protein engineering; protein dynamics; protein−protein interface; stochastic sensing.
Conflict of interest statement
COMPETING INTERESTS.
A.K.T. and L.M. are named inventors on one non-provisional patent application, US 16/177,554, filed by Syracuse University on this work.
Figures
Similar articles
-
Biological Nanopores: Confined Spaces for Electrochemical Single-Molecule Analysis.Acc Chem Res. 2018 Feb 20;51(2):331-341. doi: 10.1021/acs.accounts.7b00143. Epub 2018 Jan 24. Acc Chem Res. 2018. PMID: 29364650
-
Proximal Capture Dynamics for a Single Biological Nanopore Sensor.J Phys Chem B. 2015 Aug 20;119(33):10448-55. doi: 10.1021/acs.jpcb.5b04955. Epub 2015 Aug 6. J Phys Chem B. 2015. PMID: 26203555
-
Resolved single-molecule detection of individual species within a mixture of anti-biotin antibodies using an engineered monomeric nanopore.ACS Nano. 2015 Feb 24;9(2):1089-98. doi: 10.1021/nn506606e. Epub 2015 Jan 22. ACS Nano. 2015. PMID: 25575121 Free PMC article.
-
Stochastic nanopore sensors for the detection of terrorist agents: current status and challenges.Anal Chim Acta. 2010 Aug 24;675(2):106-15. doi: 10.1016/j.aca.2010.07.001. Epub 2010 Aug 6. Anal Chim Acta. 2010. PMID: 20800721 Review.
-
Single molecule sensing by nanopores and nanopore devices.Analyst. 2010 Mar;135(3):441-51. doi: 10.1039/b907735a. Epub 2009 Dec 22. Analyst. 2010. PMID: 20174694 Free PMC article. Review.
Cited by
-
Multiplexed imaging for probing RAS-RAF interactions in living cells.Biochim Biophys Acta Biomembr. 2023 Aug;1865(6):184173. doi: 10.1016/j.bbamem.2023.184173. Epub 2023 May 19. Biochim Biophys Acta Biomembr. 2023. PMID: 37211322 Free PMC article.
-
Focus on using nanopore technology for societal health, environmental, and energy challenges.Nano Res. 2022;15(11):9906-9920. doi: 10.1007/s12274-022-4379-2. Epub 2022 May 20. Nano Res. 2022. PMID: 35610982 Free PMC article. Review.
-
Current noise of a protein-selective biological nanopore.Proteomics. 2022 Mar;22(5-6):e2100077. doi: 10.1002/pmic.202100077. Epub 2021 Jul 31. Proteomics. 2022. PMID: 34275190 Free PMC article.
-
Tracking flaviviral protease conformational dynamics by tuning single-molecule nanopore tweezers.Biophys J. 2025 Jan 7;124(1):145-157. doi: 10.1016/j.bpj.2024.11.017. Epub 2024 Nov 22. Biophys J. 2025. PMID: 39578408
-
A generalizable nanopore sensor for highly specific protein detection at single-molecule precision.Nat Commun. 2023 Mar 20;14(1):1374. doi: 10.1038/s41467-023-36944-9. Nat Commun. 2023. PMID: 36941245 Free PMC article.
References
-
- Restrepo-Perez L; Joo C; Dekker C, Paving the way to single-molecule protein sequencing. Nat. Nanotechnol 2018, 13, 786–796. - PubMed
-
- Heikenfeld J; Jajack A; Feldman B; Granger SW; Gaitonde S; Begtrup G; Katchman BA, Accessing analytes in biofluids for peripheral biochemical monitoring. Nat. Biotechnol 2019, 37, 407–419. - PubMed
-
- Wienken CJ; Baaske P; Rothbauer U; Braun D; Duhr S, Protein-binding assays in biological liquids using microscale thermophoresis. Nat. Commun 2010, 1, 100. - PubMed
Publication types
MeSH terms
Substances
Grants and funding
LinkOut - more resources
Full Text Sources
Research Materials
