. 2020 Mar 15;41(7):715-730.
doi: 10.1002/jcc.26036. Epub 2019 Aug 9.

Alchemical Grid Dock (AlGDock): Binding Free Energy Calculations between Flexible Ligands and Rigid Receptors

Affiliations

Alchemical Grid Dock (AlGDock): Binding Free Energy Calculations between Flexible Ligands and Rigid Receptors

David D L Minh. J Comput Chem. .

Abstract

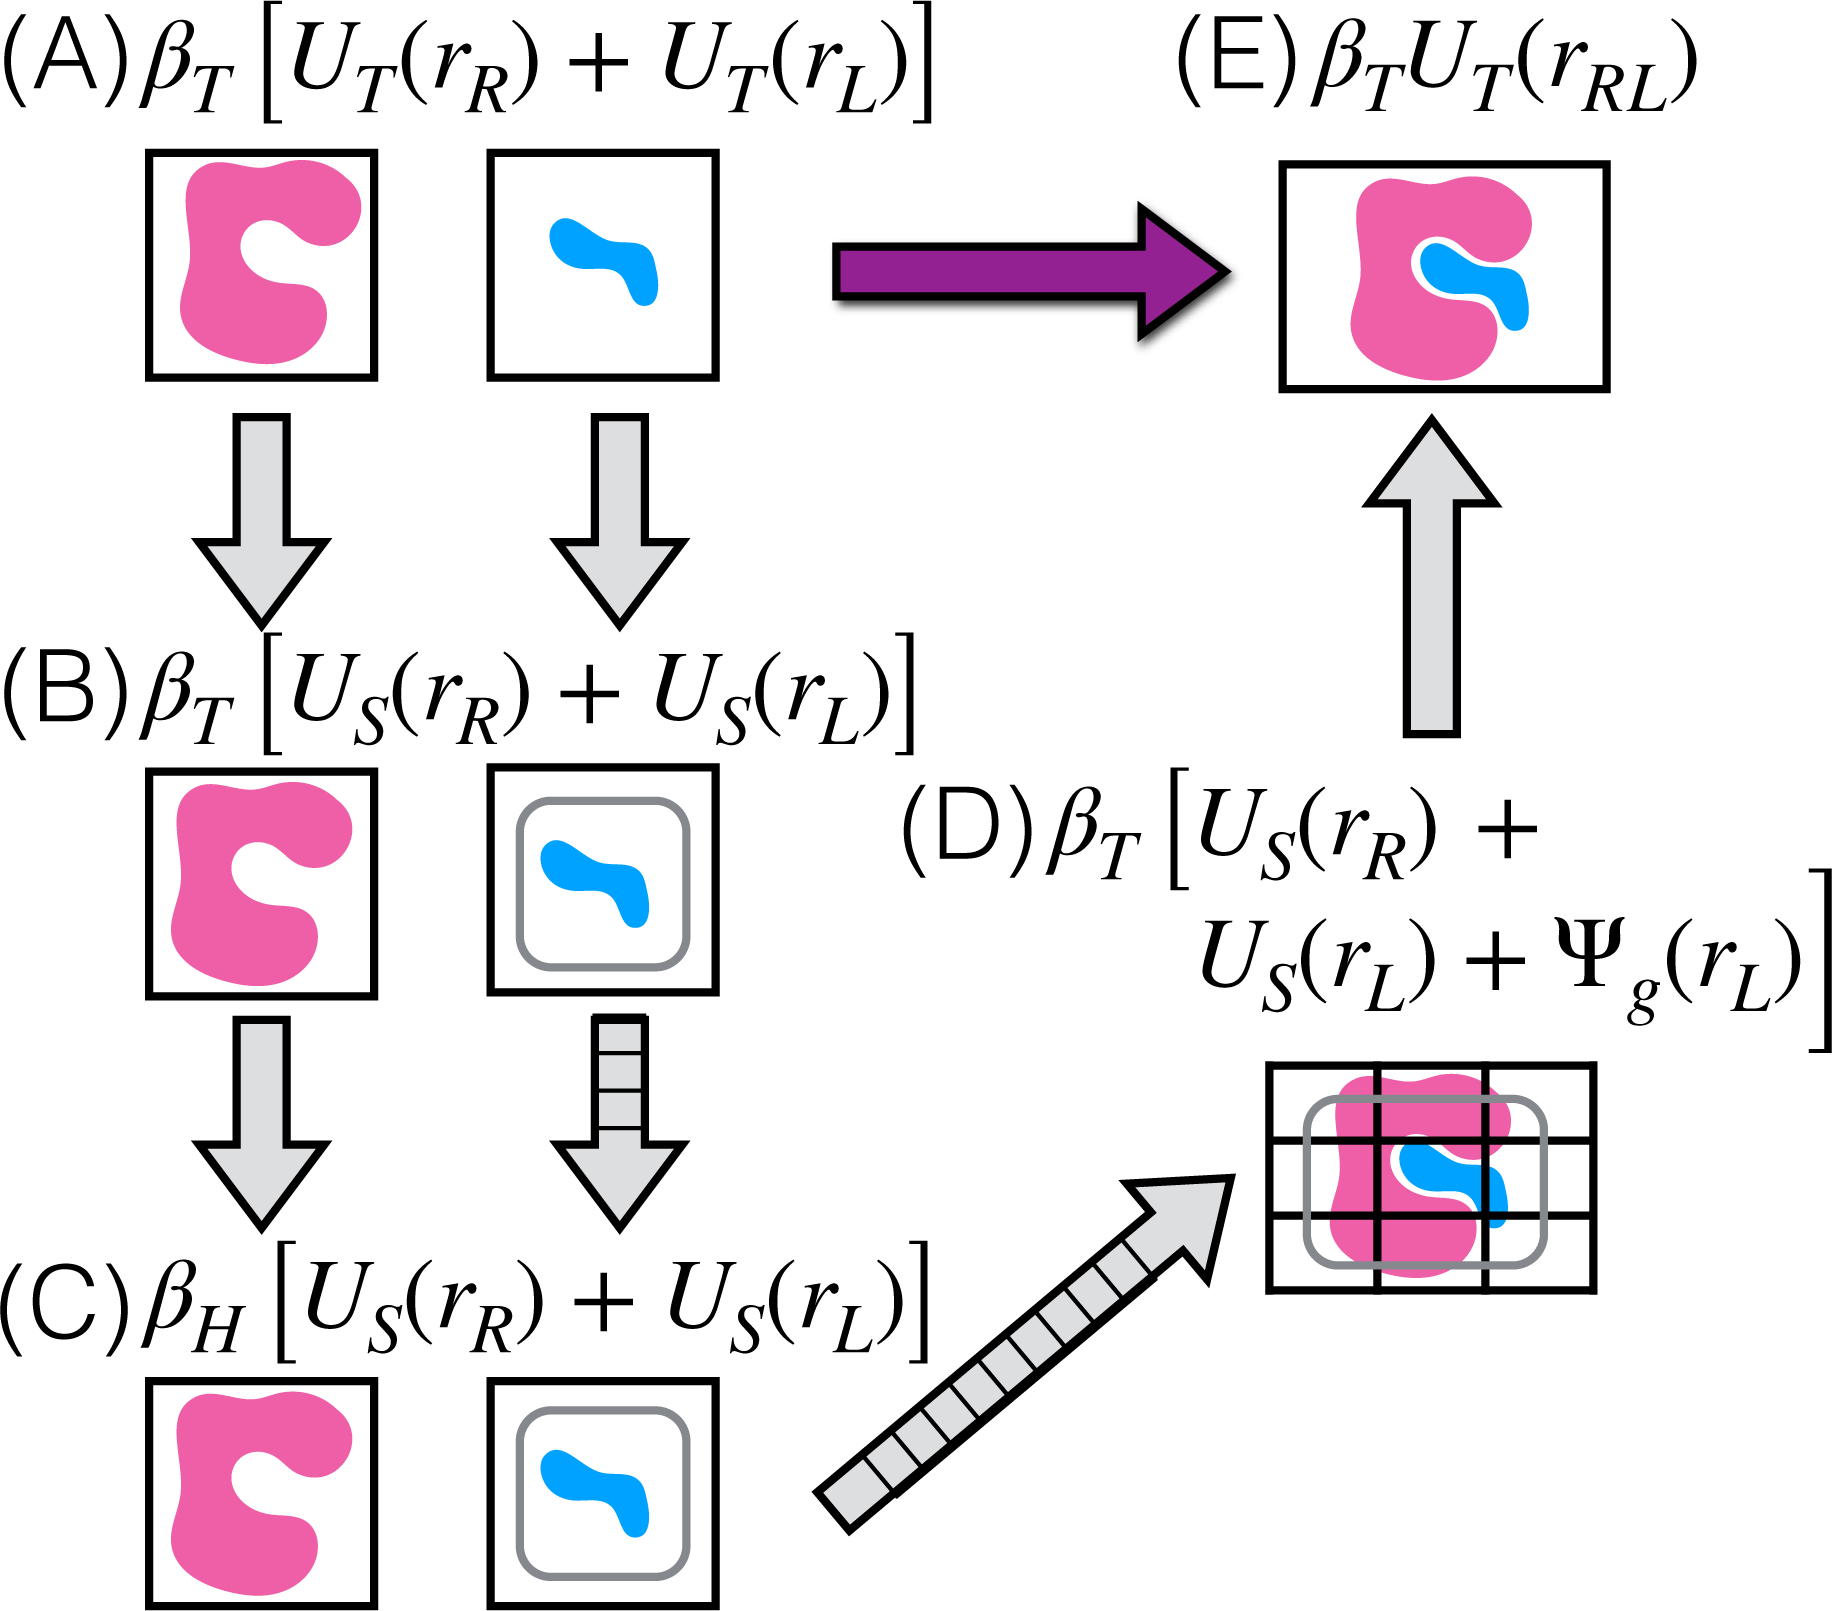
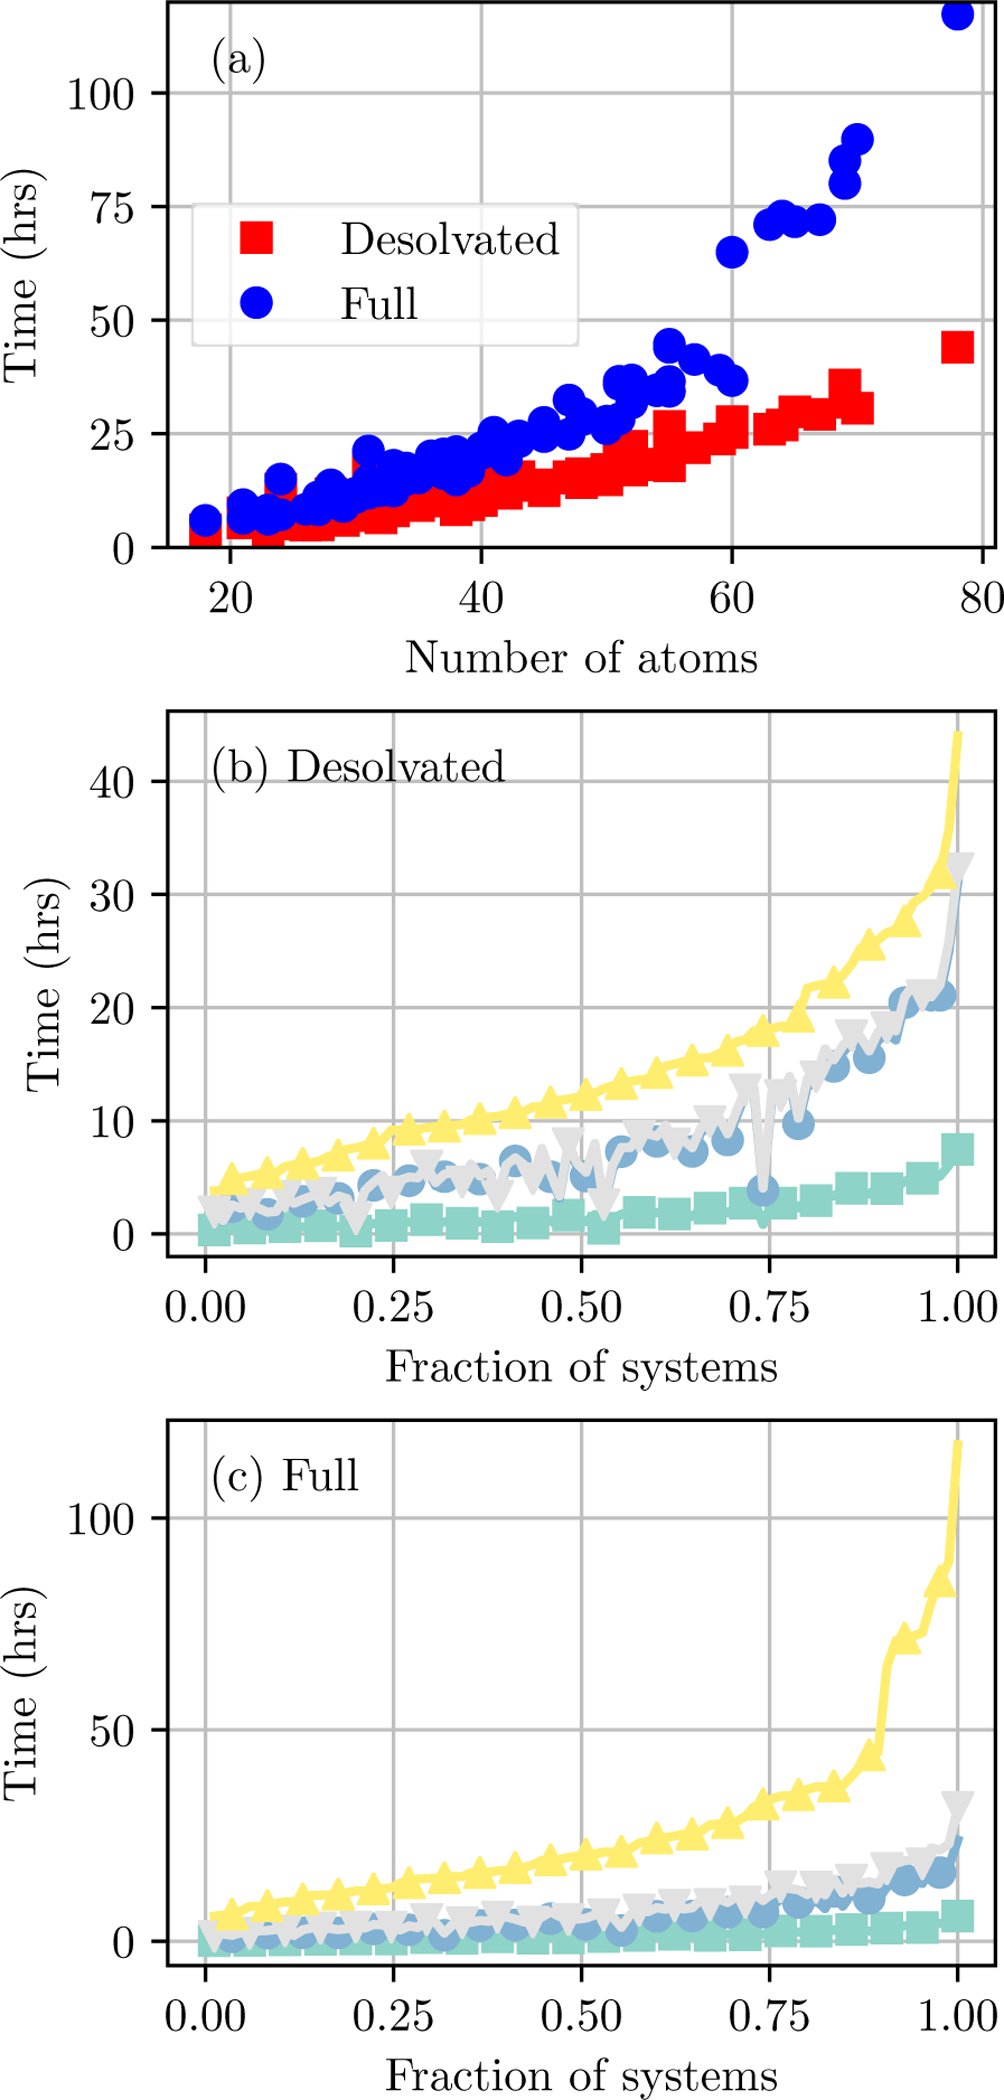
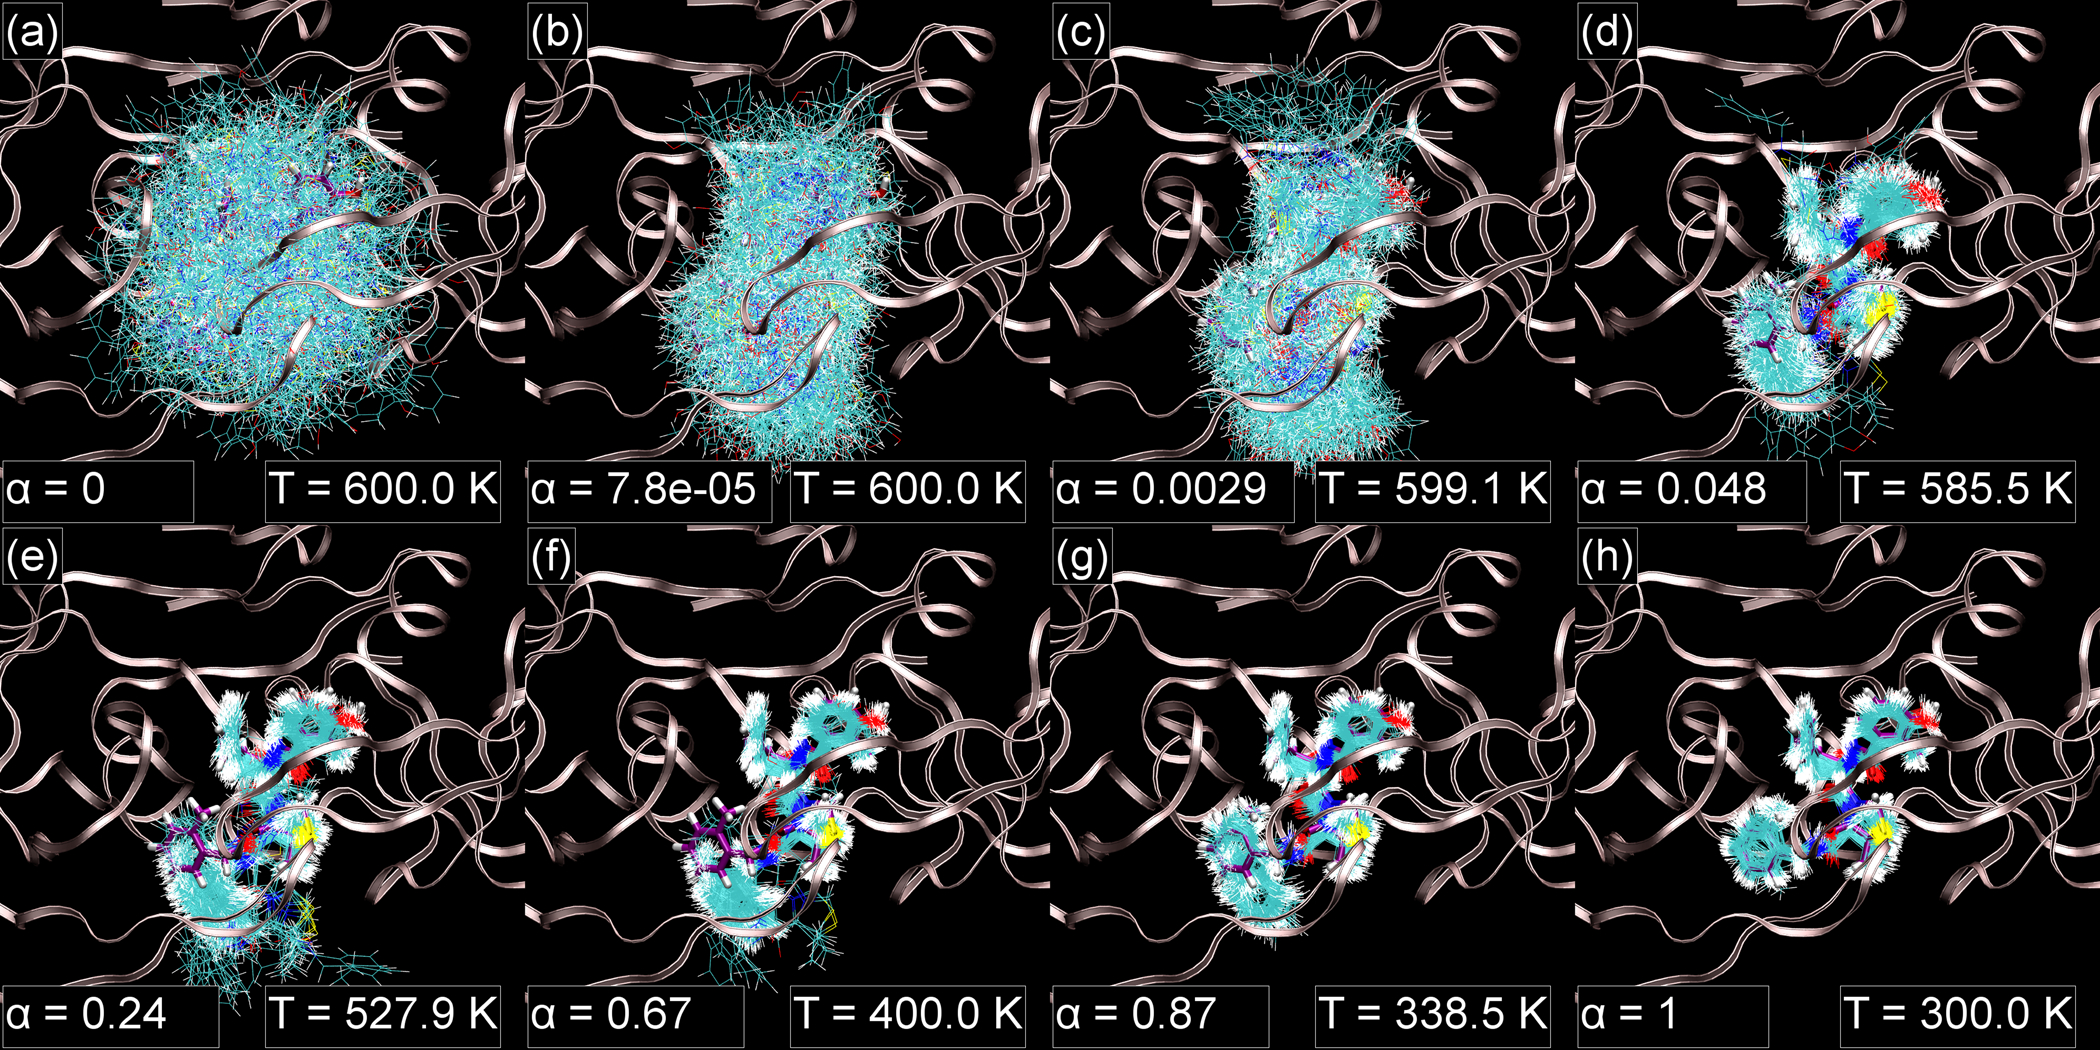
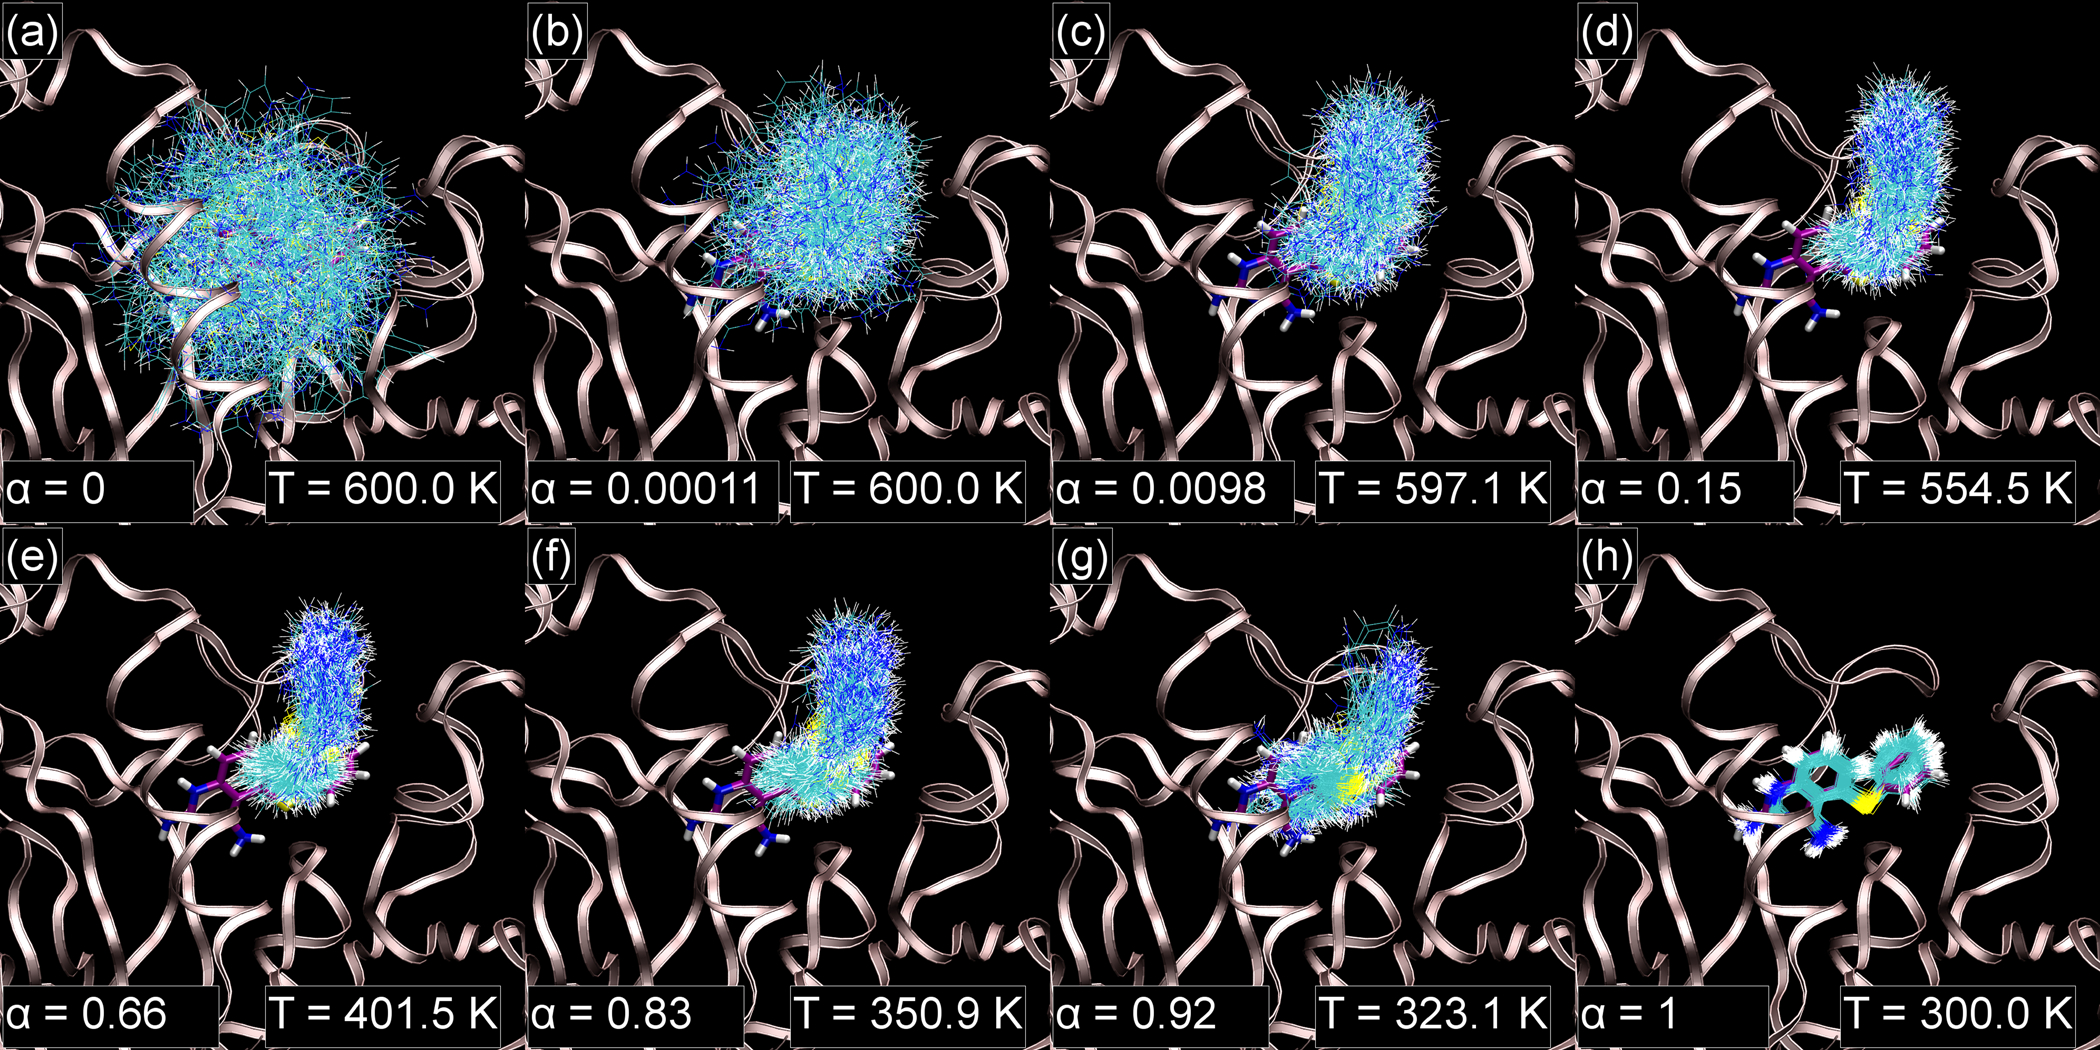
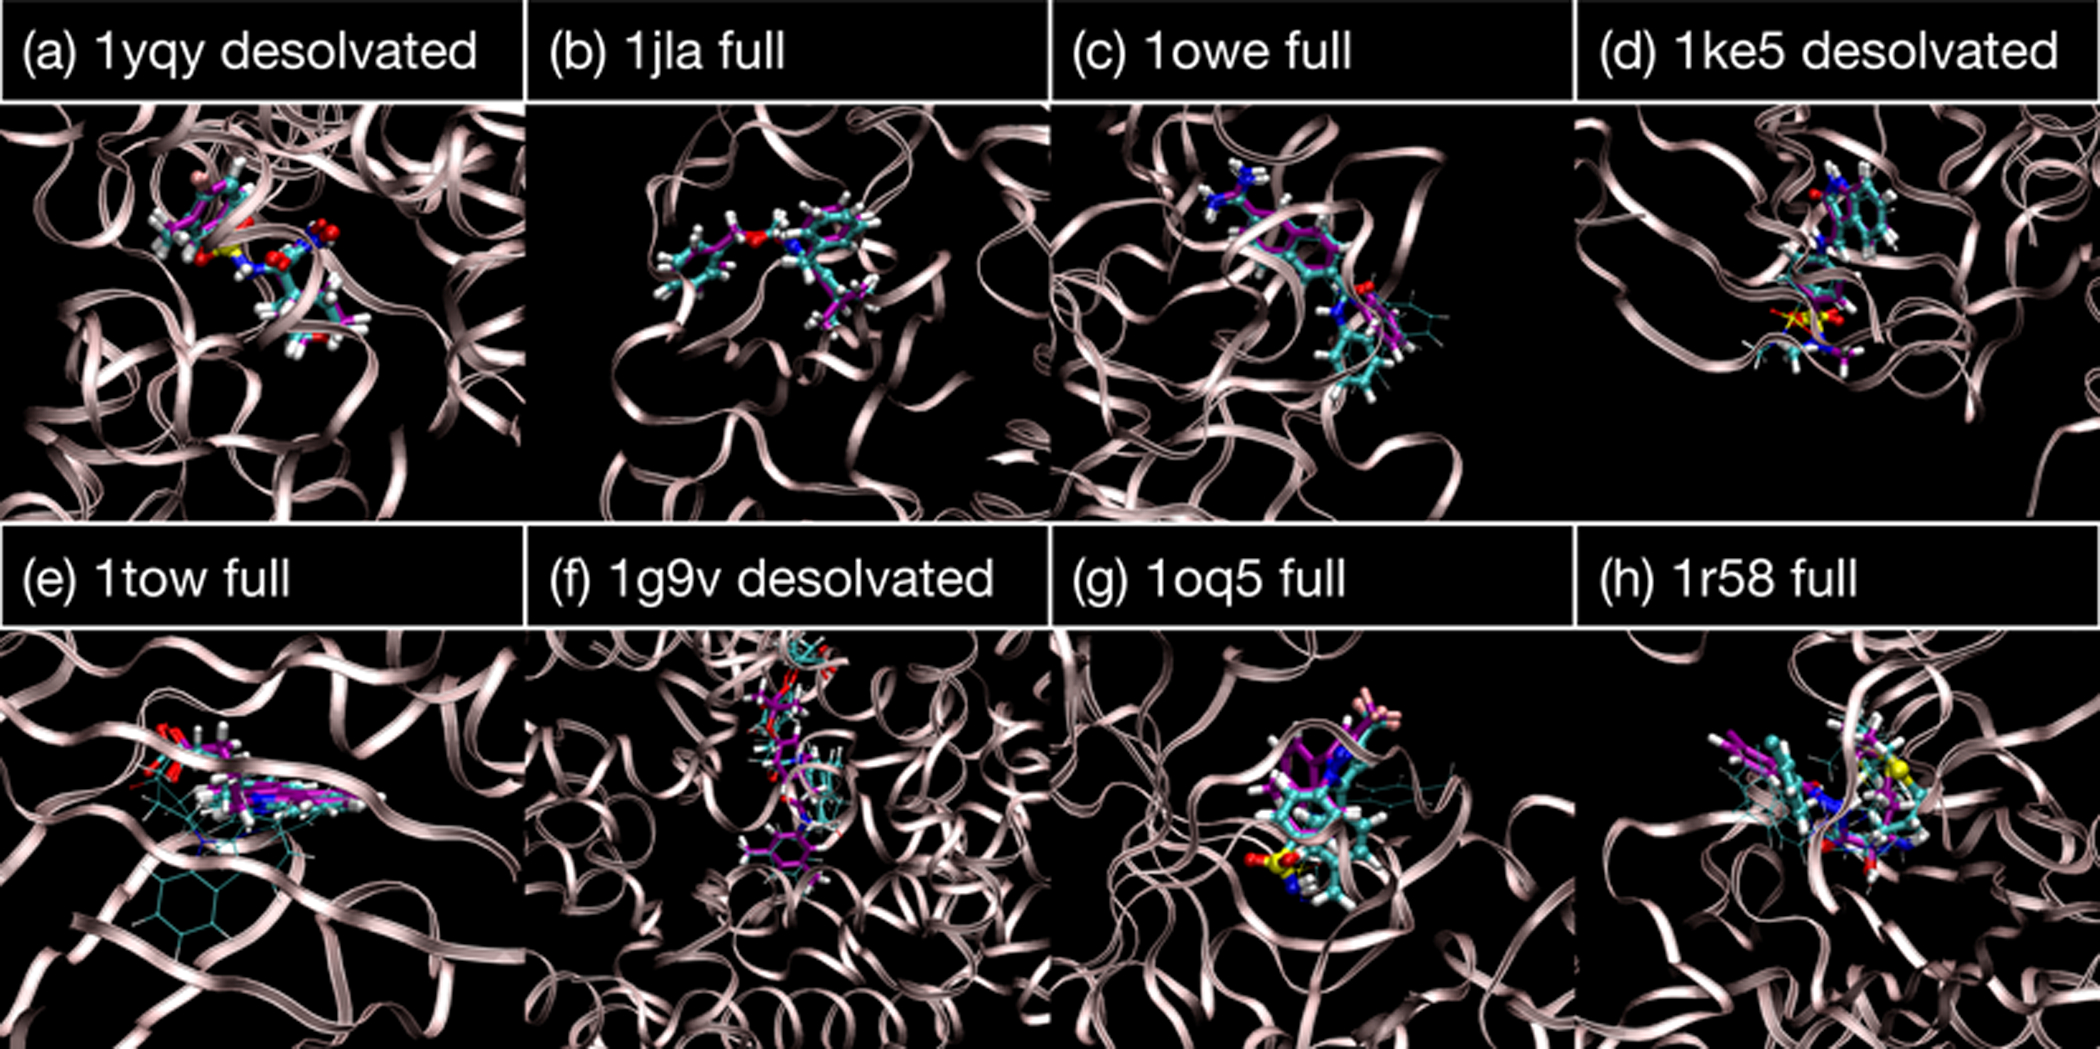
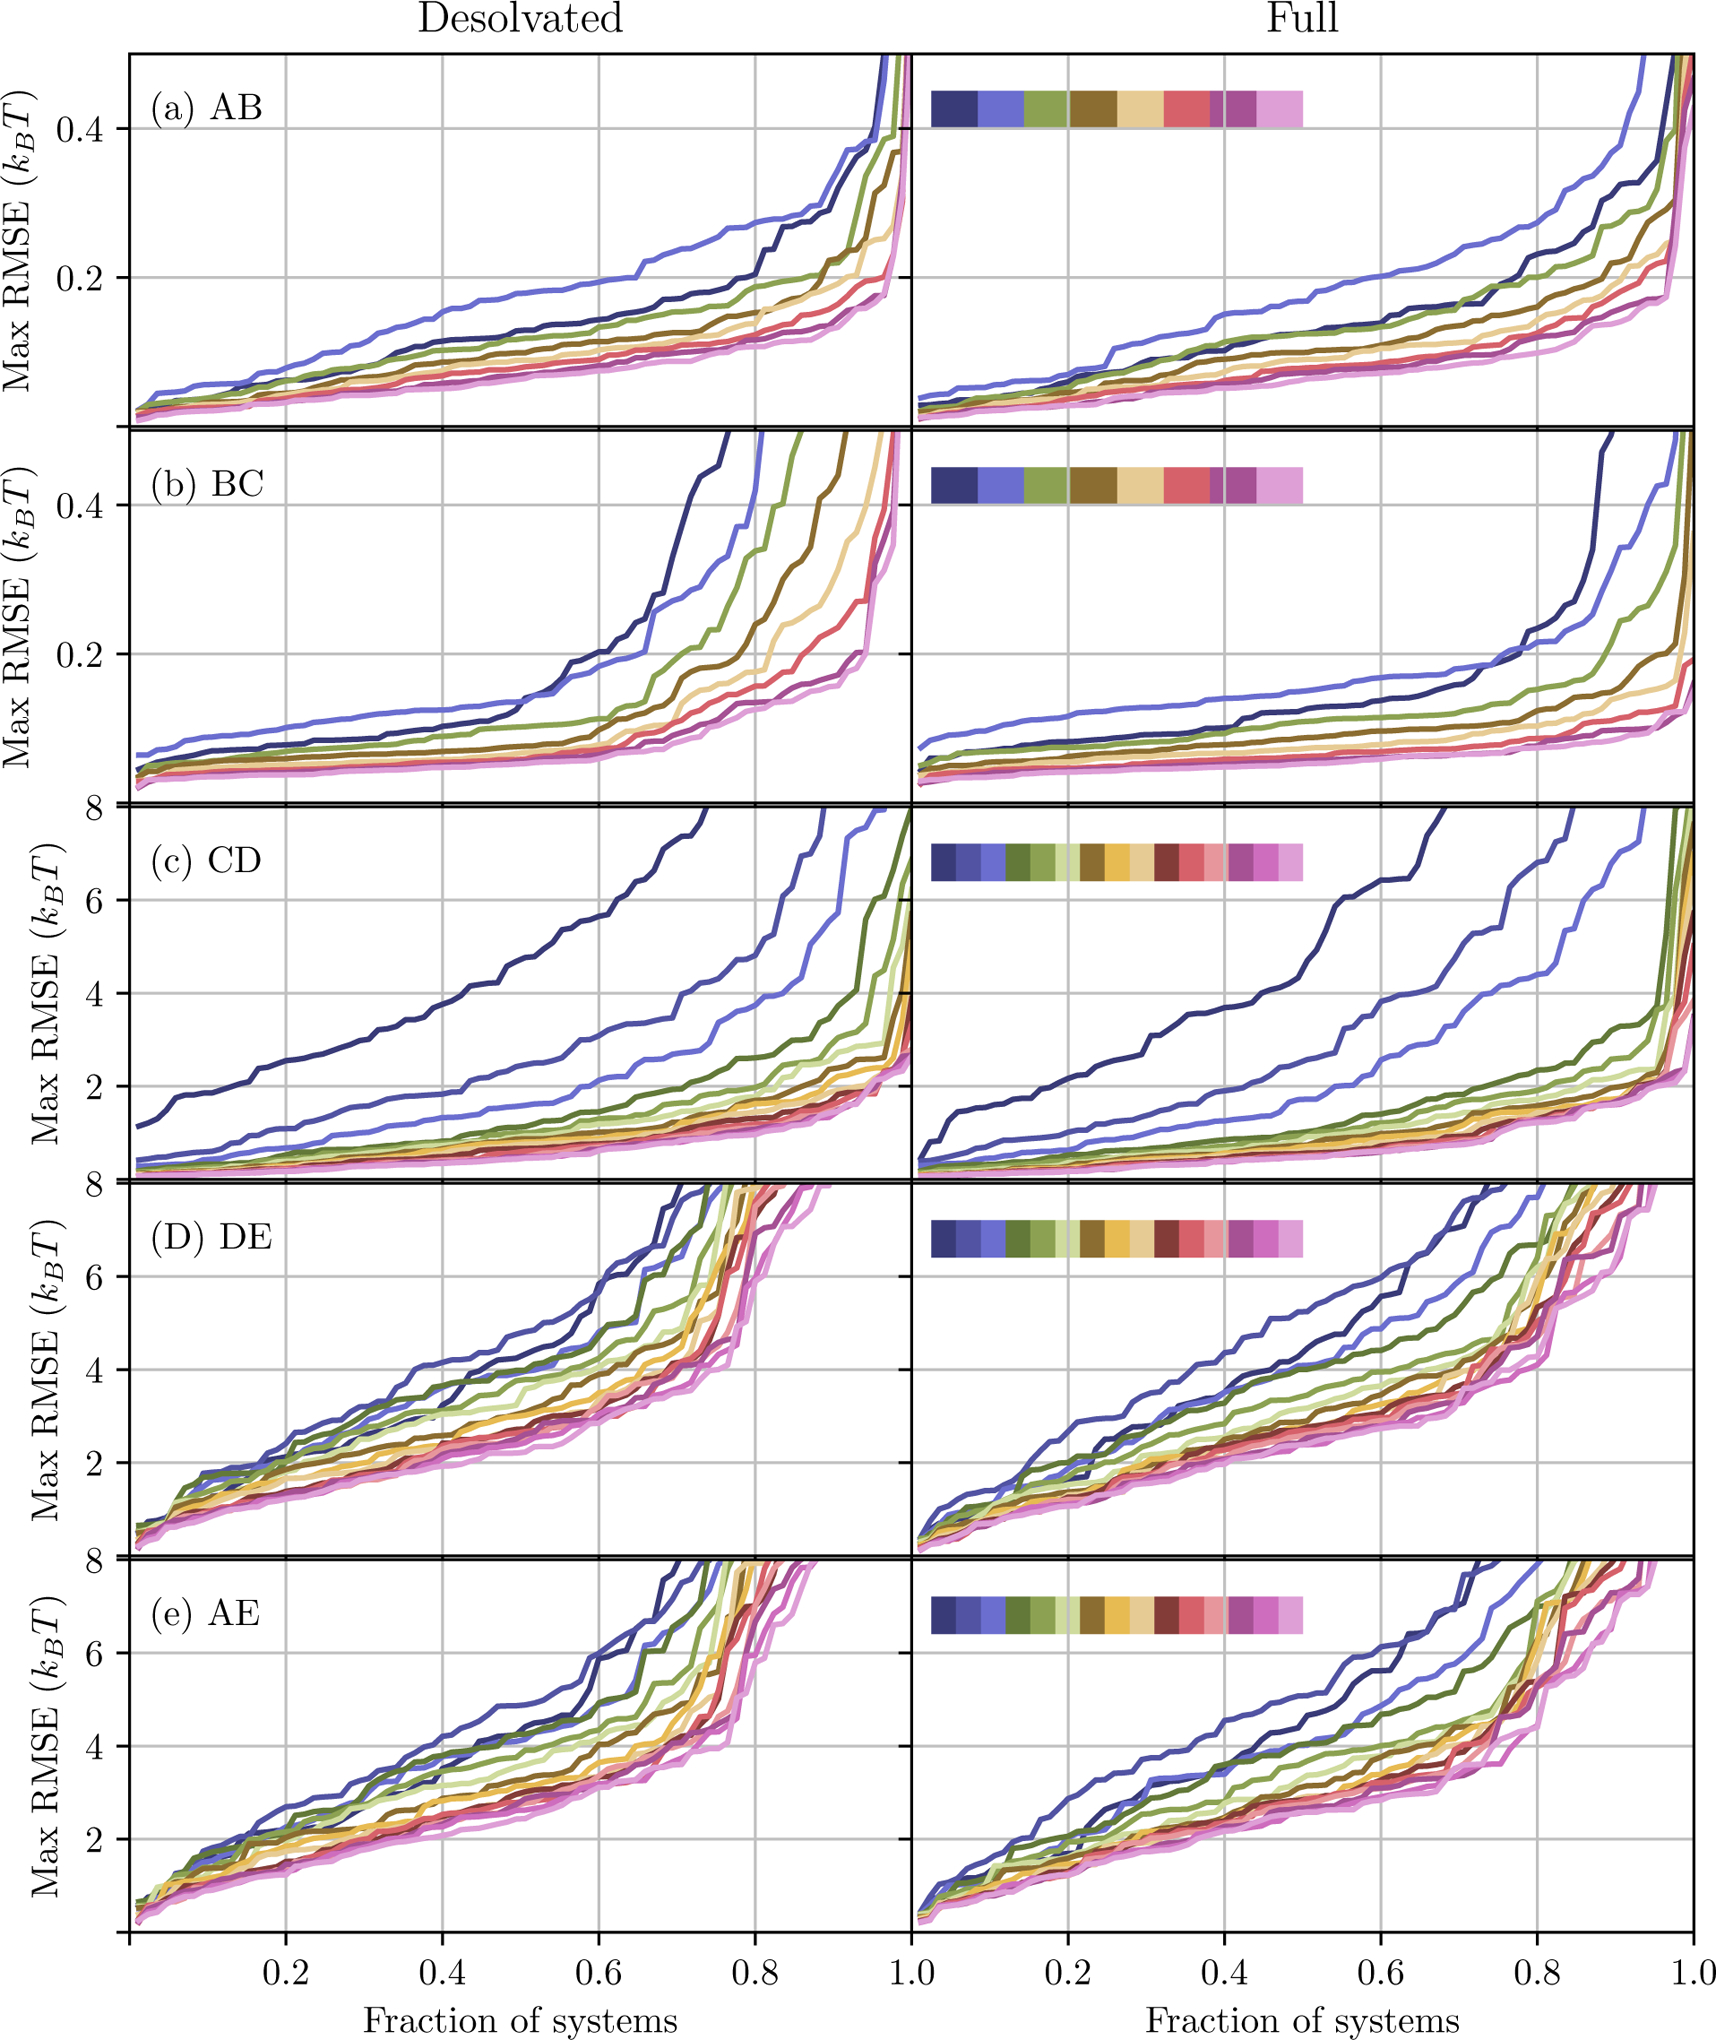
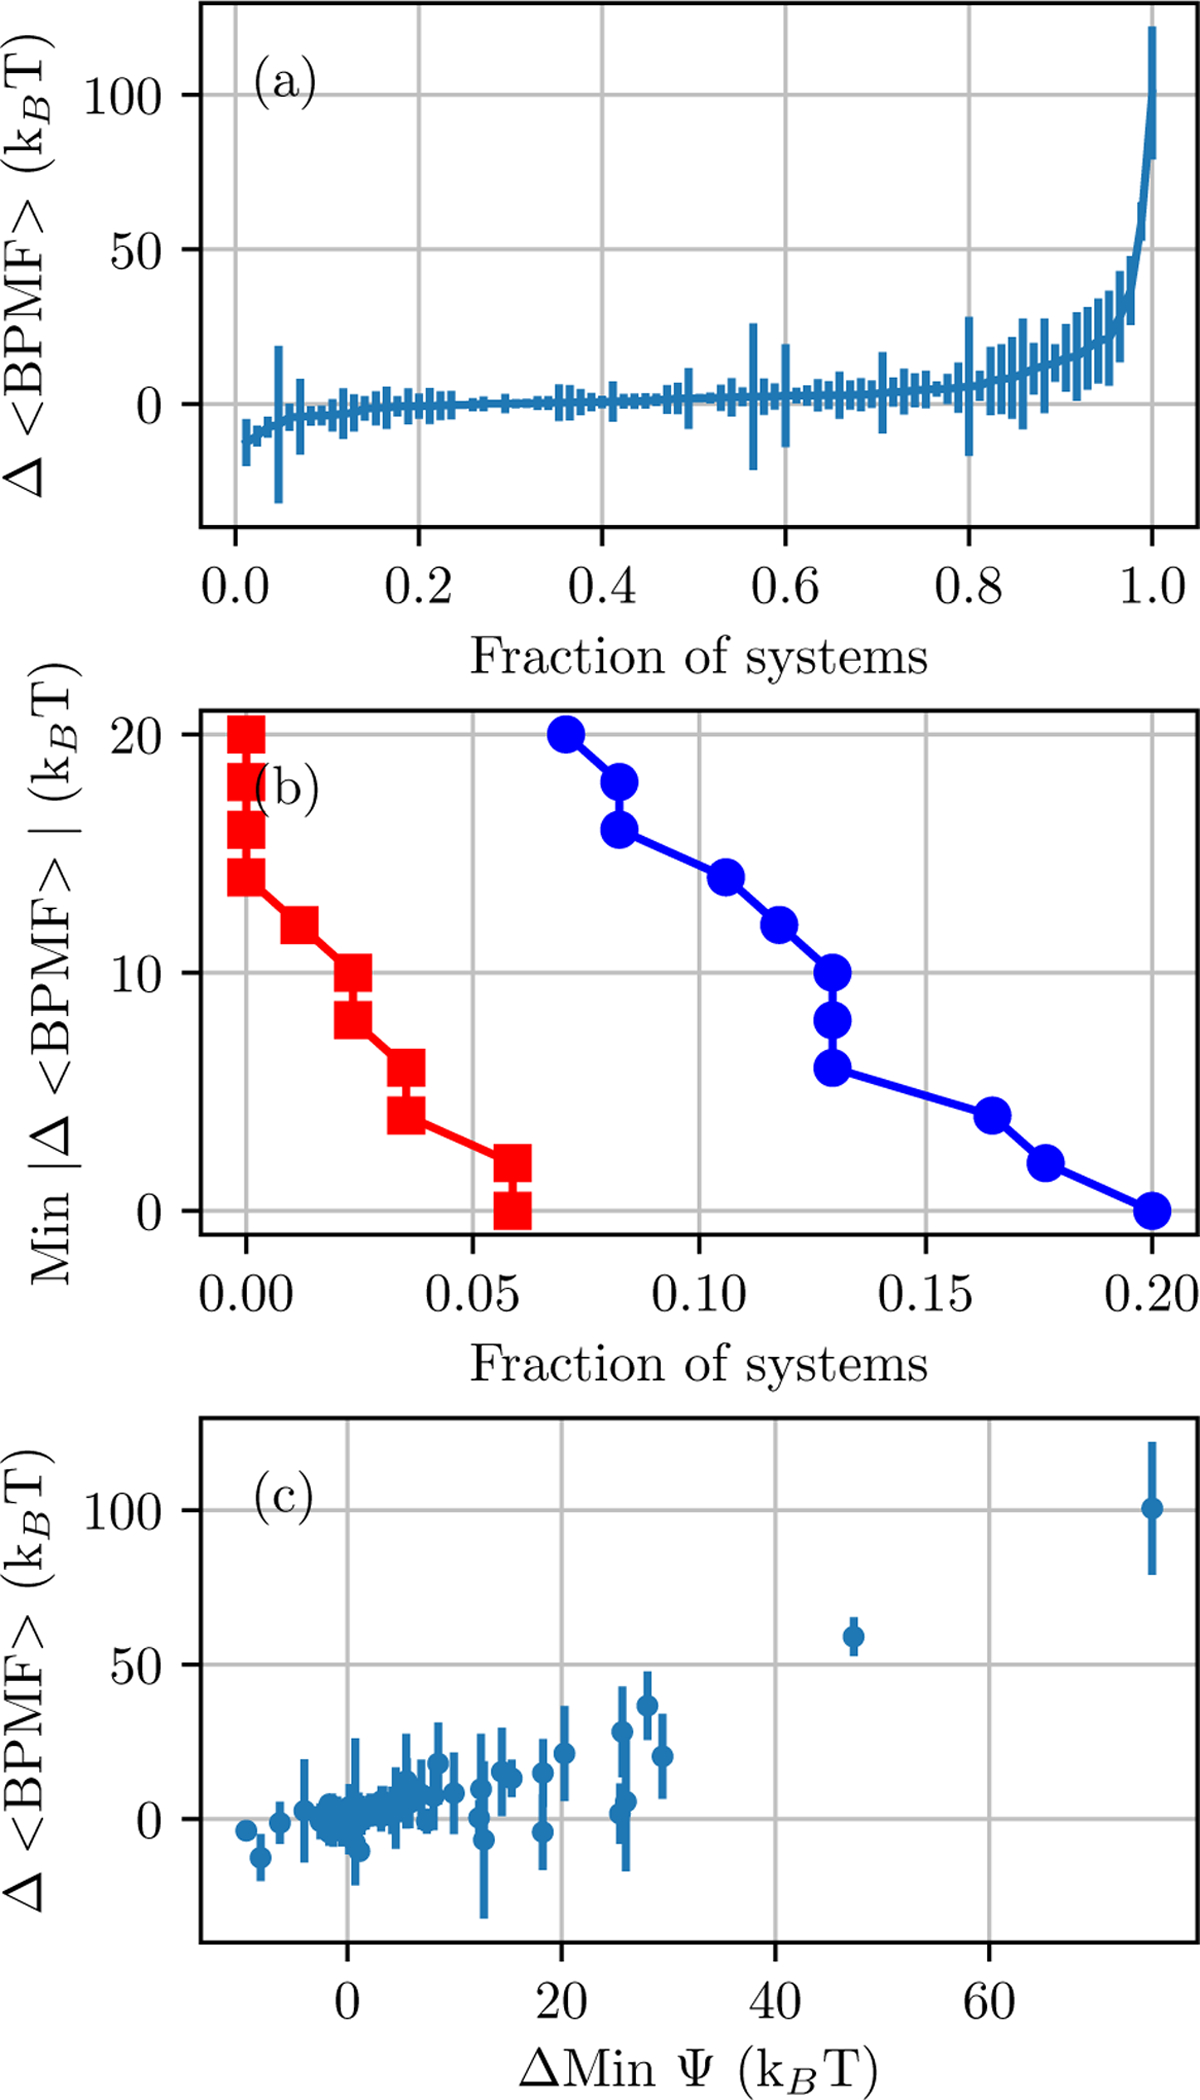
Alchemical Grid Dock (AlGDock) is open-source software designed to compute the binding potential of mean force-the binding free energy between a flexible ligand and a rigid receptor-for a small organic ligand and a biological macromolecule. Multiple BPMFs can be used to rigorously compute binding affinities between flexible partners. AlGDock uses replica exchange between thermodynamic states at different temperatures and receptor-ligand interaction strengths. Receptor-ligand interaction energies are represented by interpolating precomputed grids. Thermodynamic states are adaptively initialized and adjusted on-the-fly to maintain adequate replica exchange rates. In demonstrative calculations, when the bound ligand is treated as fully solvated, AlGDock estimates BPMFs with a precision within 4 kT in 65% and within 8 kT for 91% of systems. It correctly identifies the native binding pose in 83% of simulations. Performance is sometimes limited by subtle differences in the important configuration space of sampled and targeted thermodynamic states. © 2019 Wiley Periodicals, Inc.

Keywords: implicit ligand theory; noncovalent binding free energy; protein-ligand; replica exchange; thermodynamic length.


Figures

Figure 1:
Figure 1:. Thermodynamic cycle for BPMFs.
Milestone thermodynamic states are labeled with letters in parentheses and expressions for the reduced potential energy. βT1=kB(300 K) and βH1=kB(600 K) are inverse temperature factors for the target and high temperatures, respectively. UT (·) and US(·) denote potential energies for the target and sampling force fields, respectively. These potential energies include molecular mechanics terms and the implicit solvent model. Ψg(·) is the potential energy due to receptor-ligand interaction grids. Arrows with orthogonal lines indicate multiple intermediate thermodynamic states. For BPMF calculations, configurations are sampled from thermodynamic states with the rounded boxes and from their intermediates.
Figure 2:
Figure 2:. Grid scaling for states CD.
αsg (dashed line) and αg (solid line) as a function of the progress variable α.
Figure 3:
Figure 3:. Number of thermodynamic states
(a) for states BC, and (b) for states CD. The marker indicates the mean value and error bars the standard deviation of 11 independent simulations based on the Desolvated (red squares) and Full (blue circles) solvation options. They are ordered by the mean number of states.
Figure 4:
Figure 4:. Mean acceptance probability statistics.
p¯acc for fifteen protocols with the lowest observed p¯acc (a) for states BC and (b) and states CD are shown with the a line connecting neighboring states. Histograms of p¯acc from all simulations are shown on the right panel. The largest bin count is 14492 for states BC and 31068 for states CD. For states CD, the simulations are from 1opk (4), 1r1h (4), 1t40 (3), 1v48 (2), 1oq5 (1), 1jje (1), where the number of simulations is in the parentheses.
Figure 5:
Figure 5:. Benchmark simulation times.
(a) Scatter plot of the total time for Desolvated (red squares) and Full (blue circles) solvation options as a function of the number of atoms in the system. Breakdown of times for (b) Desolvated and (c) Full solvation options. Benchmark simulations include initialization, equilibration and production, postprocessing, and free energy estimation. From bottom to top, lines depict the cumulative time through initialization (cyan squares) and estimation (violet circles) for states AC and then initialization (pink downward triangles) and estimation (yellow upward triangles) for states CE. Systems are ordered along the x axis by the total simulation time.
Figure 6:
Figure 6:
Samples from evenly spaced thermodynamic states for states CDx, taken from a representative simulation of 1kzk with the Desolvated solvation option. The protein structure structure is shown with ribbons and the crystallographic ligand pose is shown with a thick licorice representation and purple carbon atoms. The same illustration scheme is used in Figures 7 and 8. These figures were generated with VMD.
Figure 7:
Figure 7:
Samples from evenly spaced thermodynamic states for states CD, taken from a representative simulation of 1l7f with the Full solvation option.
Figure 8:
Figure 8:
Predicted poses taken from representative simulations. A licorice representation is used for both the crystallographic pose (purple carbon atoms) and predicted poses (cyan). For the pose predictions, the thickness of the representation is proportional to its Boltzmann weight (using energies from the OBC model). Poses are shown for which weights are greater than 0.001.
Figure 9:
Figure 9:
Fraction of systems with free energy differences calculated within a certain root mean square error of the final value. The rows are for free energy differences between different pairs of milestones. The columns are for the Desolvated (left) and Full (right) solvation options. Each line indicates a different number of cycles, with a total of 8 for the top two rows and 15 for the remainder. In the sequence of colors inset in the right column of each row, the color indicate an increasing number of cycles from left to right.
Figure 10:
Figure 10:
Representative cumulative free energies as a function of progress for states (a) AC and (b) DE for Desolvated (red squares) or Full (blue circles) options. Simulations are of PDB ID 1gpk. Panel (a) is based on the sum of fAB and the free energy difference between TT = 300 K and the temperature on the x axis. Panel (b) is based on the sum of fAC and the free energy difference between α = 0 and the progress variable on the x axis. The final point on the plot shows fAE for both pathways. For clarity, markers are shown only every four thermodynamic states.
Figure 11:
Figure 11:. Differences between the mean BPMF of Desolvated and Full solvation options.
(a) Data points are ordered by the difference in mean BPMFs and the error bars are the sum of the standard deviations of the two estimates. (b) The fraction of systems in which the difference in mean BPMFs is larger than the sum of standard deviations of the two estimates. Either the Desolvated (red squares) or Full (blue circles) BPMF is lower by at least a certain value. (c) The difference in the minimum interaction energy, according to the force field in milestone E, versus the difference in mean BPMFs.
Figure 12:
Figure 12:. Venn diagram of geometric decoys.
Incorrect binding pose predictions, or geometric decoys, arise when a nonnative pose has a lower score than any native pose. The Venn diagrams show the overlap between sets of (a) BPMF calculations or (b) systems in which there are geometric decoys according to the interaction energy in milestone E (Minimum Ψ), the pose-specific BPMF (fEEp in panel (a) and fAEp in panel (b)), or because no native poses were observed (Drifted). Panel (a) is labeled by the number of BPMF calculations and is based on poses observed in each calculation. Panel (b) is labeled by PDB identifiers for the particular systems and is based on poses observed in all BPMF calculations for a system.

Similar articles

Cited by

References

    1. Minh DDL, J. Chem. Phys 137, 104106 (2012). - PMC - PubMed
    1. Nguyen TH and Minh DDL, J. Chem. Phys 148, 104114 (2018). - PMC - PubMed
    1. Mobley DL, Graves AP, Chodera JD, McReynolds AC, Shoichet BK, and Dill KA, J. Mol. Biol 371, 1118 (2007). - PMC - PubMed
    1. Ucisik MN, Zheng Z, Faver JC, and Merz KM, J. Chem. Theory Comput 10, 1314 (2014). - PMC - PubMed
    1. Xie B, Nguyen TH, and Minh DDL, J. Chem. Theory Comput 13, 2930 (2017). - PMC - PubMed

Publication types

LinkOut - more resources