

Switching to Degludec From Other Basal Insulins Is Associated With Reduced Hypoglycemia Rates: A Prospective Study
- PMID: 31397845
- PMCID: PMC6812737
- DOI: 10.1210/jc.2019-01021
Switching to Degludec From Other Basal Insulins Is Associated With Reduced Hypoglycemia Rates: A Prospective Study
Abstract
Context: Observational studies of insulin degludec (degludec) with hypoglycemia events prospectively recorded are lacking.
Objective: To evaluate the safety and effectiveness of degludec in patients with type 1 diabetes (T1D) or type 2 diabetes (T2D) switching from other basal insulins in routine care.
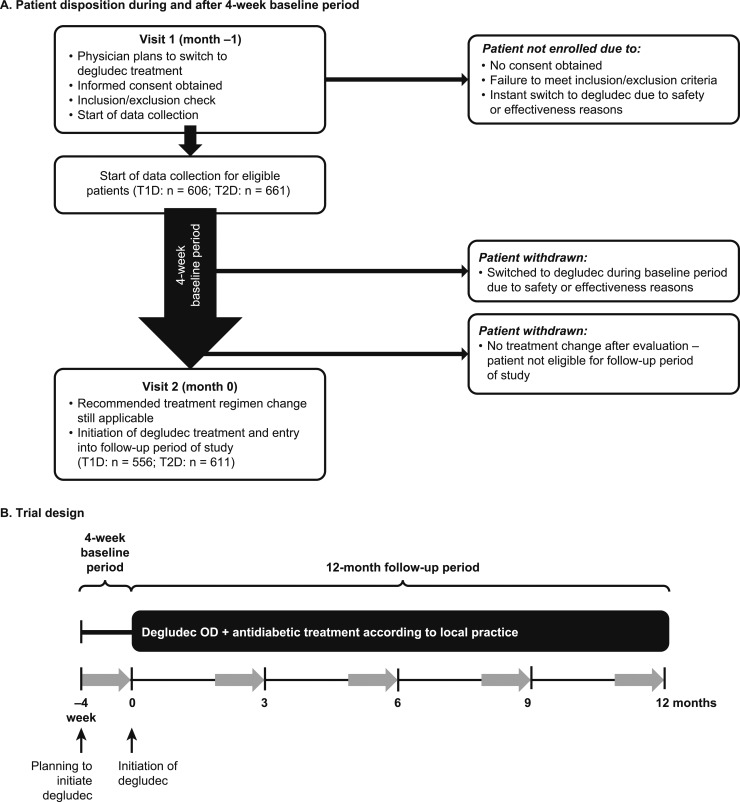
Design: Results From Real-World Clinical Treatment With Tresiba® was a multinational, multicenter, prospective, observational, single-arm study comprising a 4-week baseline period (preswitch basal insulin) and 12-month follow-up (degludec).
Setting: Routine clinical practice.
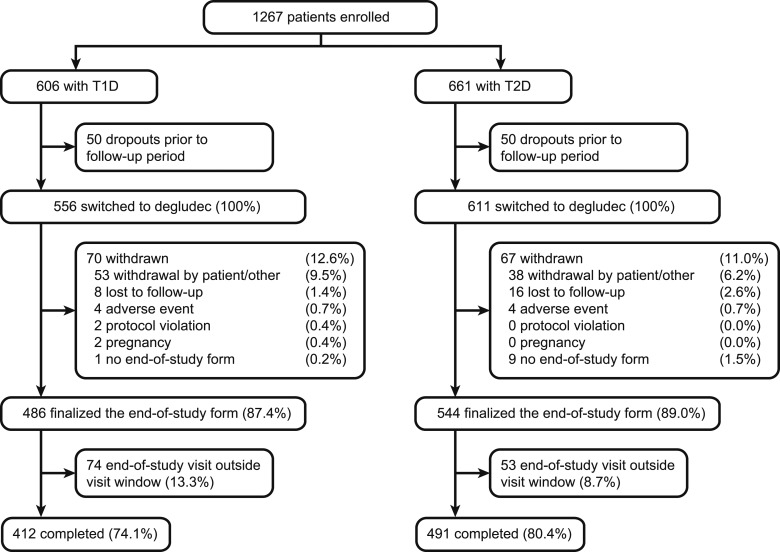
Patients or other participants: Insulin-treated patients (≥18 years) with T1D (n = 556) or T2D (n = 611) with treatment plans to initiate degludec.
Interventions: Switching to degludec from other basal insulins.
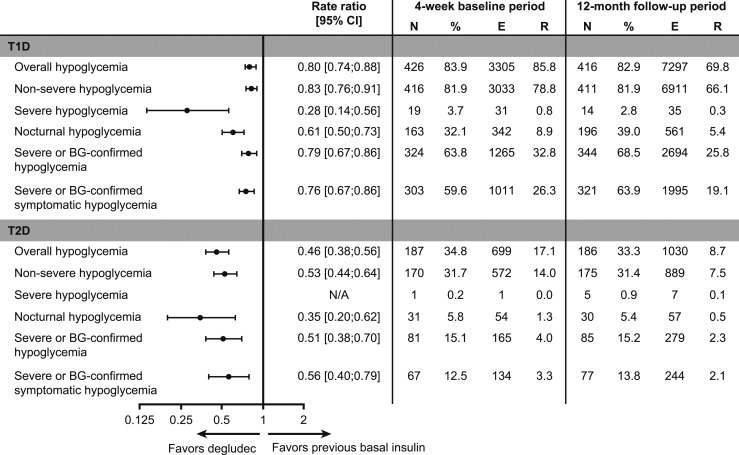
Main outcome measure: Change from baseline in number of overall hypoglycemic events recorded in patient diaries.
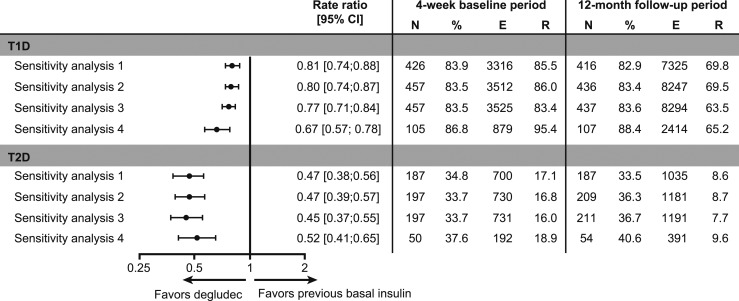
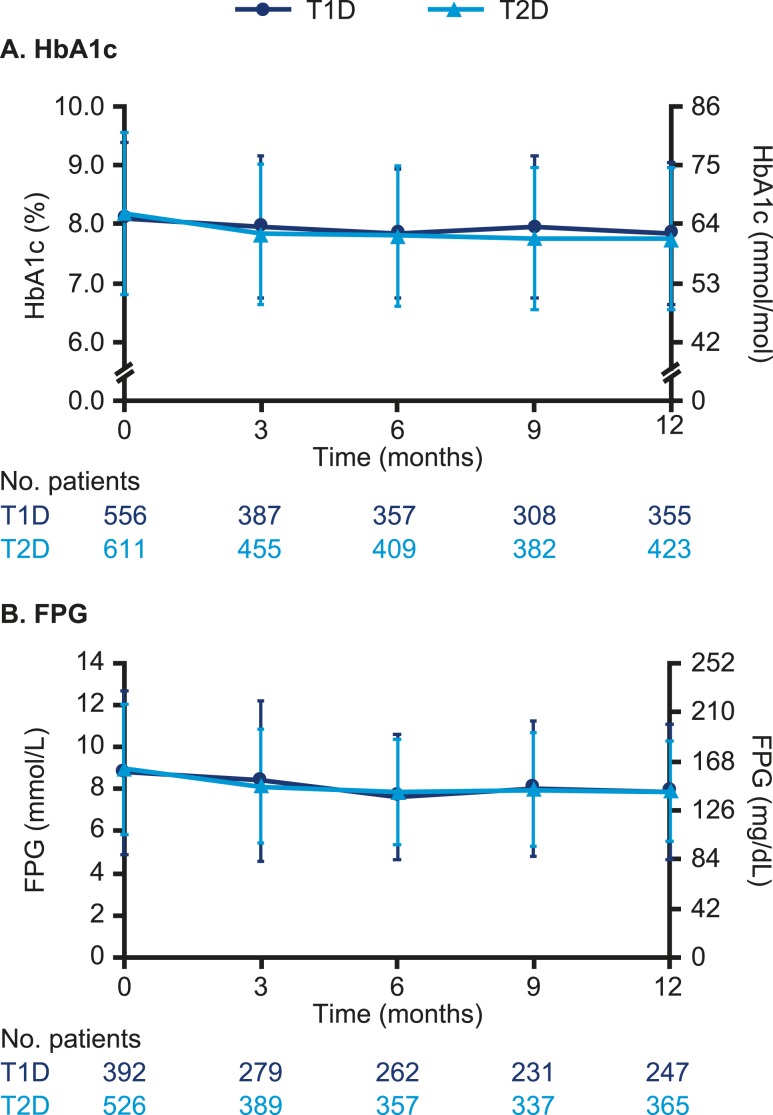
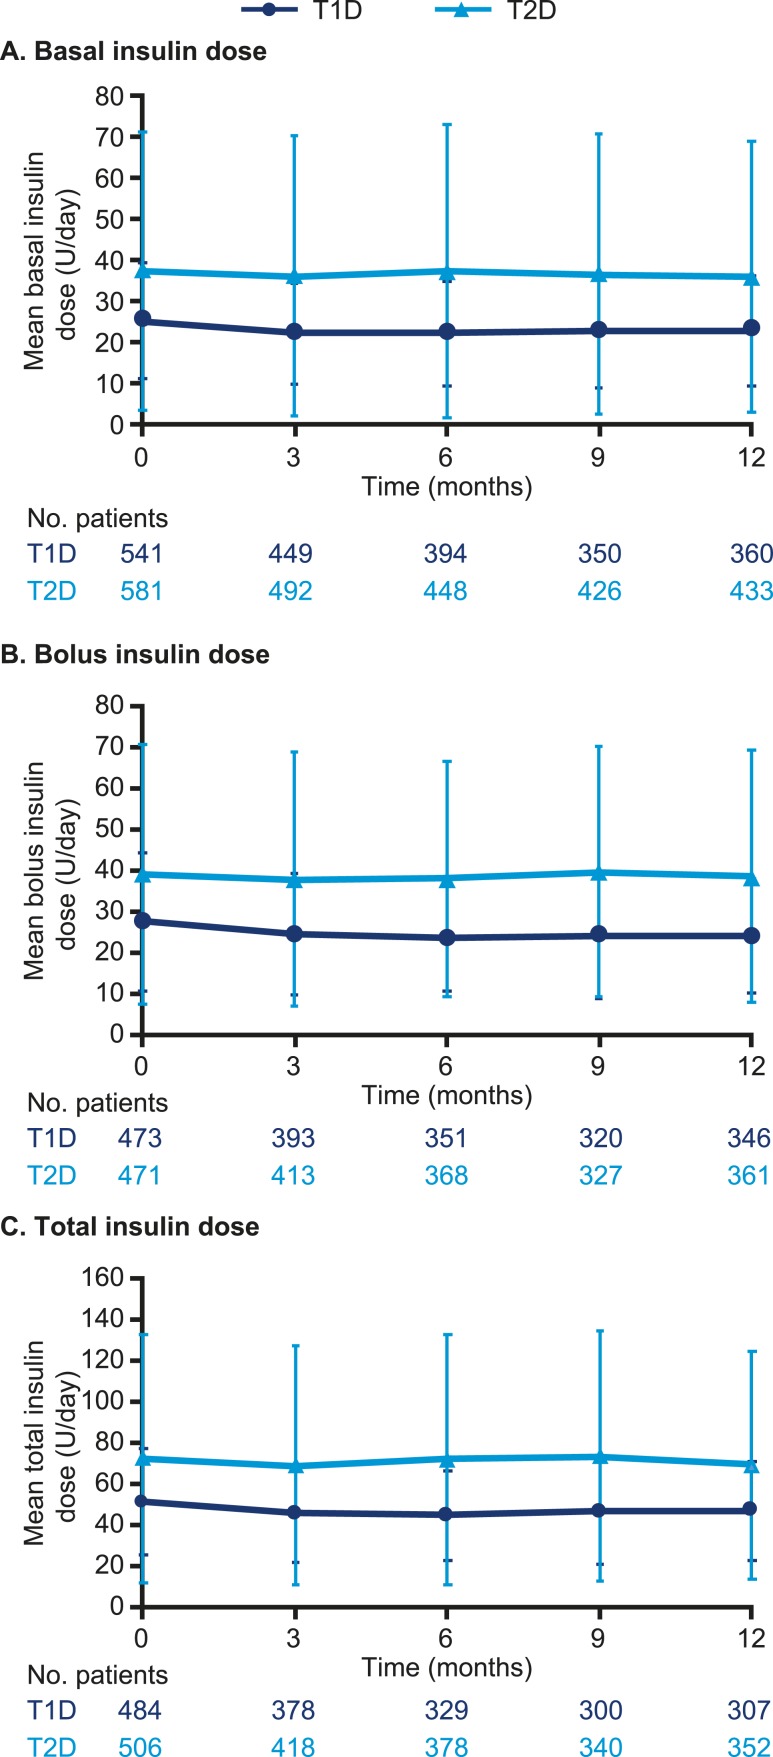
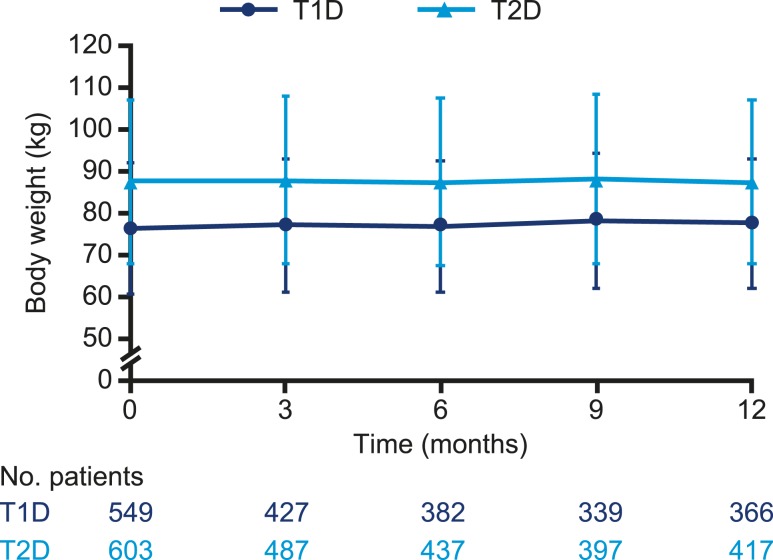
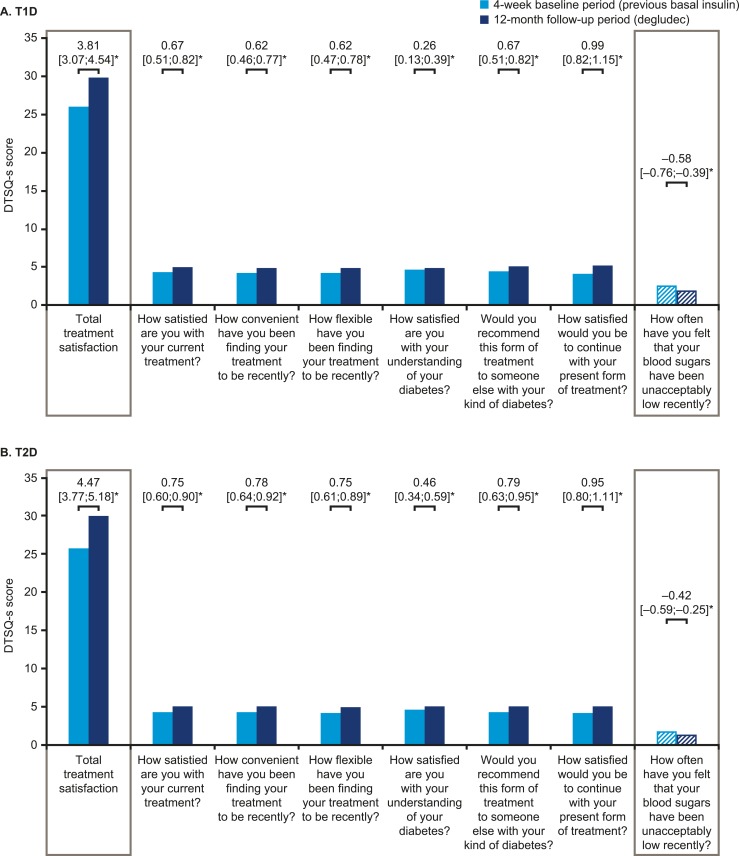
Results: In T1D, the 12-month follow-up/baseline rate ratios (95% CI) of overall [0.80 (0.74 to 0.88)], nonsevere [0.83 (0.76 to 0.91)], severe [0.28 (0.14 to 0.56)], and nocturnal [0.61 (0.50 to 0.73)] hypoglycemia suggested significantly lower hypoglycemia rates with degludec (all Ps < 0.001). At 12 months, HbA1c, fasting plasma glucose (FPG), and basal insulin dosage decreased significantly. Body weight increased, and treatment satisfaction improved significantly. In T2D, the hypoglycemia rate ratios were overall [0.46 (0.38 to 0.56)], nonsevere [0.53 (0.44 to 0.64)], and nocturnal [0.35 (0.20 to 0.62)] (all Ps < 0.001; too few events for analysis of severe hypoglycemia). At 12 months, HbA1c and FPG decreased significantly. Body weight and insulin dosages remained unchanged, and treatment satisfaction was significantly improved.
Conclusions: In a routine clinical care setting, switching to degludec from other basal insulins was associated with significantly lower rates of hypoglycemia, improved glycemic control, and treatment satisfaction in patients with T1D or T2D.
Trial registration: ClinicalTrials.gov NCT02392117.
Copyright © 2019 Endocrine Society.
Figures
References
-
- Zekarias KL, Seaquist E. Hypoglycemia in diabetes: epidemiology, impact, prevention and treatment. Available at: https://smjournals.com/ebooks/hypoglycemia-causes-occurrences/chapters/H.... Accessed 1 May 2019.
-
- UK Hypoglycaemia Study Group. Risk of hypoglycaemia in types 1 and 2 diabetes: effects of treatment modalities and their duration. Diabetologia. 2007;50(6):1140–1147. - PubMed
-
- Fidler C, Elmelund Christensen T, Gillard S. Hypoglycemia: an overview of fear of hypoglycemia, quality-of-life, and impact on costs. J Med Econ. 2011;14(5):646–655. - PubMed
-
- Khunti K, Alsifri S, Aronson R, Cigrovski Berković M, Enters-Weijnen C, Forsén T, Galstyan G, Geelhoed-Duijvestijn P, Goldfracht M, Gydesen H, Kapur R, Lalic N, Ludvik B, Moberg E, Pedersen-Bjergaard U, Ramachandran A; HAT Investigator Group. Impact of hypoglycaemia on patient-reported outcomes from a global, 24-country study of 27,585 people with type 1 and insulin-treated type 2 diabetes. Diabetes Res Clin Pract. 2017;130:121–129. - PubMed
-
- Brod M, Rana A, Barnett AH. Impact of self-treated hypoglycaemia in type 2 diabetes: a multinational survey in patients and physicians. Curr Med Res Opin. 2012;28(12):1947–1958. - PubMed
