

The effect of stimulation type, head modeling, and combined EEG and MEG on the source reconstruction of the somatosensory P20/N20 component
- PMID: 31397966
- PMCID: PMC6865415
- DOI: 10.1002/hbm.24754
The effect of stimulation type, head modeling, and combined EEG and MEG on the source reconstruction of the somatosensory P20/N20 component
Abstract
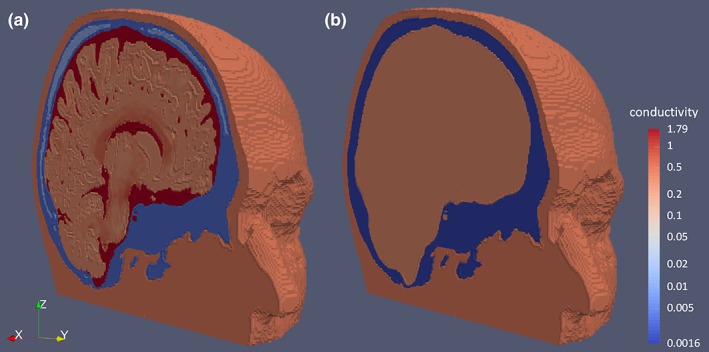
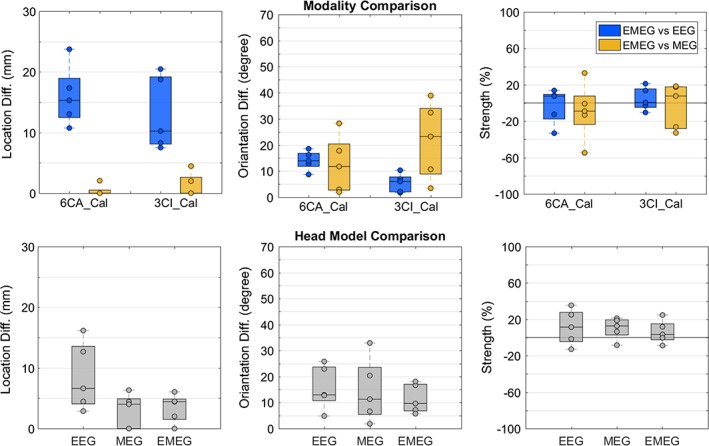
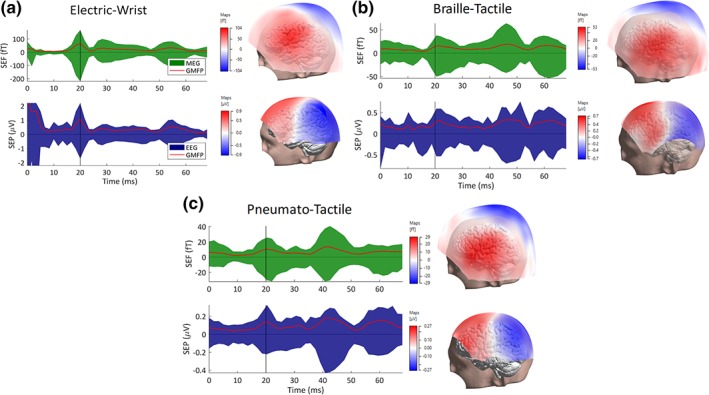
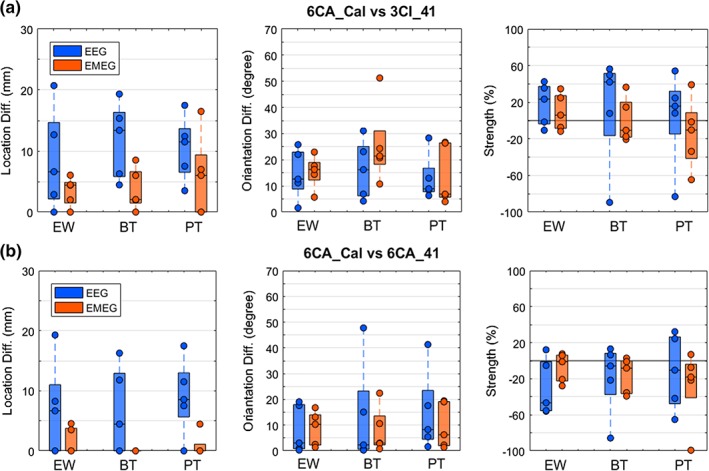
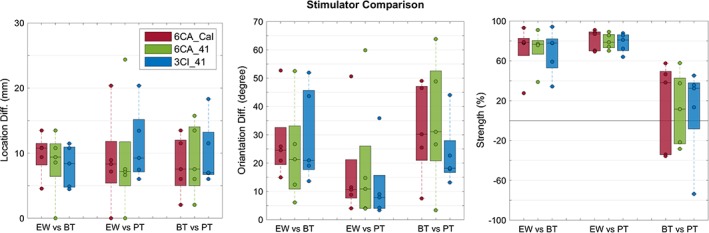
Modeling and experimental parameters influence the Electro- (EEG) and Magnetoencephalography (MEG) source analysis of the somatosensory P20/N20 component. In a sensitivity group study, we compare P20/N20 source analysis due to different stimulation type (Electric-Wrist [EW], Braille-Tactile [BT], or Pneumato-Tactile [PT]), measurement modality (combined EEG/MEG - EMEG, EEG, or MEG) and head model (standard or individually skull-conductivity calibrated including brain anisotropic conductivity). Considerable differences between pairs of stimulation types occurred (EW-BT: 8.7 ± 3.3 mm/27.1° ± 16.4°, BT-PT: 9 ± 5 mm/29.9° ± 17.3°, and EW-PT: 9.8 ± 7.4 mm/15.9° ± 16.5° and 75% strength reduction of BT or PT when compared to EW) regardless of the head model used. EMEG has nearly no localization differences to MEG, but large ones to EEG (16.1 ± 4.9 mm), while source orientation differences are non-negligible to both EEG (14° ± 3.7°) and MEG (12.5° ± 10.9°). Our calibration results show a considerable inter-subject variability (3.1-14 mS/m) for skull conductivity. The comparison due to different head model show localization differences smaller for EMEG (EW: 3.4 ± 2.4 mm, BT: 3.7 ± 3.4 mm, and PT: 5.9 ± 6.8 mm) than for EEG (EW: 8.6 ± 8.3 mm, BT: 11.8 ± 6.2 mm, and PT: 10.5 ± 5.3 mm), while source orientation differences for EMEG (EW: 15.4° ± 6.3°, BT: 25.7° ± 15.2° and PT: 14° ± 11.5°) and EEG (EW: 14.6° ± 9.5°, BT: 16.3° ± 11.1° and PT: 12.9° ± 8.9°) are in the same range. Our results show that stimulation type, modality and head modeling all have a non-negligible influence on the source reconstruction of the P20/N20 component. The complementary information of both modalities in EMEG can be exploited on the basis of detailed and individualized head models.
Keywords: EEG; MEG; finite element method; multimodal imaging; somatosensory cortex; somatosensory evoked fields; somatosensory evoked potentials.
© 2019 The Authors. Human Brain Mapping published by Wiley Periodicals, Inc.
Conflict of interest statement
None declared.
Figures
Similar articles
-
Inter-Subject Variability of Skull Conductivity and Thickness in Calibrated Realistic Head Models.Neuroimage. 2020 Dec;223:117353. doi: 10.1016/j.neuroimage.2020.117353. Epub 2020 Sep 9. Neuroimage. 2020. PMID: 32919058
-
Individually optimized multi-channel tDCS for targeting somatosensory cortex.Clin Neurophysiol. 2022 Feb;134:9-26. doi: 10.1016/j.clinph.2021.10.016. Epub 2021 Dec 1. Clin Neurophysiol. 2022. PMID: 34923283
-
Combined EEG and MEG analysis of early somatosensory evoked activity in children and adolescents with focal epilepsies.Clin Neurophysiol. 2007 Aug;118(8):1721-35. doi: 10.1016/j.clinph.2007.03.037. Epub 2007 Jun 14. Clin Neurophysiol. 2007. PMID: 17572142
-
CutFEM-based MEG forward modeling improves source separability and sensitivity to quasi-radial sources: A somatosensory group study.Hum Brain Mapp. 2024 Aug 1;45(11):e26810. doi: 10.1002/hbm.26810. Hum Brain Mapp. 2024. PMID: 39140847 Free PMC article. Review.
-
[Somatosensory evoked potentials/fields--exploration of brain function].Rinsho Byori. 2004 Jan;52(1):77-80. Rinsho Byori. 2004. PMID: 14968564 Review. Japanese.
Cited by
-
Post-processing of a distributed source method for the localization of somatosensory cortex in a cohort of epilepsy patients.Neuroimage Rep. 2024 May 9;4(2):100204. doi: 10.1016/j.ynirp.2024.100204. eCollection 2024 Jun. Neuroimage Rep. 2024. PMID: 40568389 Free PMC article.
-
Directionality of the injected current targeting the P20/N20 source determines the efficacy of 140 Hz transcranial alternating current stimulation (tACS)-induced aftereffects in the somatosensory cortex.PLoS One. 2022 Mar 24;17(3):e0266107. doi: 10.1371/journal.pone.0266107. eCollection 2022. PLoS One. 2022. PMID: 35324989 Free PMC article.
-
Brainstorm-DUNEuro: An integrated and user-friendly Finite Element Method for modeling electromagnetic brain activity.Neuroimage. 2023 Feb 15;267:119851. doi: 10.1016/j.neuroimage.2022.119851. Epub 2023 Jan 1. Neuroimage. 2023. PMID: 36599389 Free PMC article.
-
First activity and interactions in thalamus and cortex using raw single-trial EEG and MEG elicited by somatosensory stimulation.Front Syst Neurosci. 2024 Jan 5;17:1305022. doi: 10.3389/fnsys.2023.1305022. eCollection 2023. Front Syst Neurosci. 2024. PMID: 38250330 Free PMC article.
-
Optimized high-definition tDCS in patients with skull defects and skull plates.Front Hum Neurosci. 2023 Oct 20;17:1239105. doi: 10.3389/fnhum.2023.1239105. eCollection 2023. Front Hum Neurosci. 2023. PMID: 37929226 Free PMC article.
References
-
- Akhtari, M. , Bryant, H.C. , Mamelak, A.N. , (2002). Flynn ER, Heller L, et al. Conductivities of three‐layer human skull. Brain Topography, 14: 151–167. - PubMed
-
- Allison, T. , McCarthy, G. , Wood, C. C. , & Jones, S. J. (1991). Potentials evoked in human and monkey cerebral cortex by stimulation of the median nerve. Brain, 114, 2465–2503. - PubMed
-
- Antonakakis, M. , Khan, A. , Wollbrink, A. , Zervakis, M. , Paulus, W. , Nitsche. M. , Lencer, R. , Suntrup‐Krueger, S. , Schneider, T. , Herrmann, C. , Haueisen, J. , Wolters, C. H. (2019). Individual targeting and optimization of multi‐channel transcranial electric stimulation of the human primary somatosensory cortex. In: 41st International Engineering in Medicine and Biology Conference, Berlin, July 23–27, 2019.
Publication types
MeSH terms
Grants and funding
LinkOut - more resources
Full Text Sources
