. 2019 Aug 9;13(8):e0007115.
doi: 10.1371/journal.pntd.0007115. eCollection 2019 Aug.

Progress towards lymphatic filariasis elimination in Ghana from 2000-2016: Analysis of microfilaria prevalence data from 430 communities

Affiliations

Progress towards lymphatic filariasis elimination in Ghana from 2000-2016: Analysis of microfilaria prevalence data from 430 communities

Nana Kwadwo Biritwum et al. PLoS Negl Trop Dis. .

Abstract

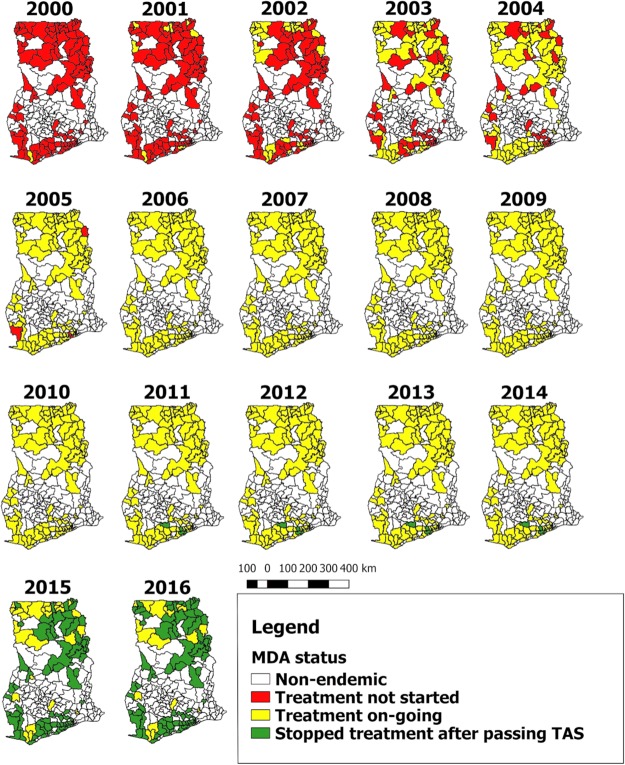
Background: Ghana started its national programme to eliminate lymphatic filariasis (LF) in 2000, with mass drug administration (MDA) with ivermectin and albendazole as main strategy. We review the progress towards elimination that was made by 2016 for all endemic districts of Ghana and analyze microfilaria (mf) prevalence from sentinel and spot-check sites in endemic districts.

Methods: We reviewed district level data on the history of MDA and outcomes of transmission assessment surveys (TAS). We further collated and analyzed mf prevalence data from sentinel and spot-check sites.

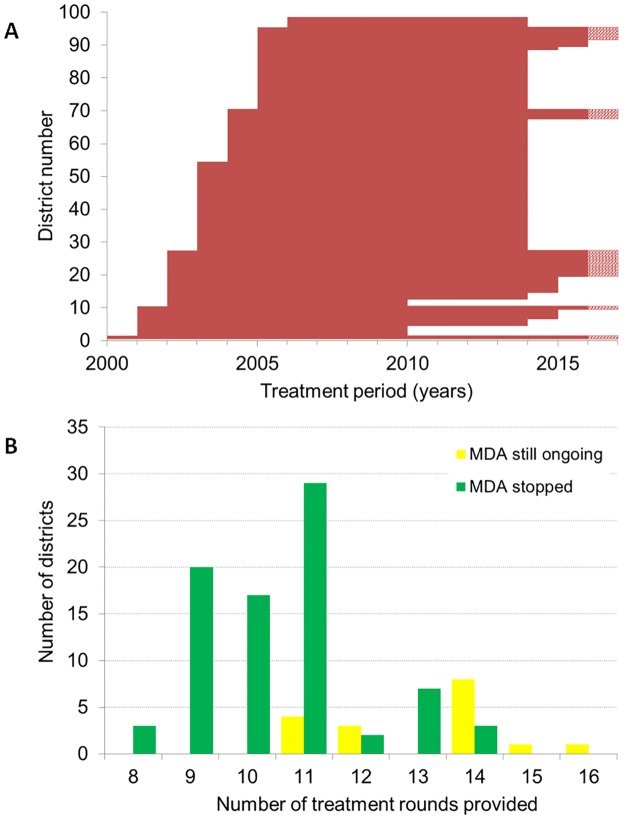
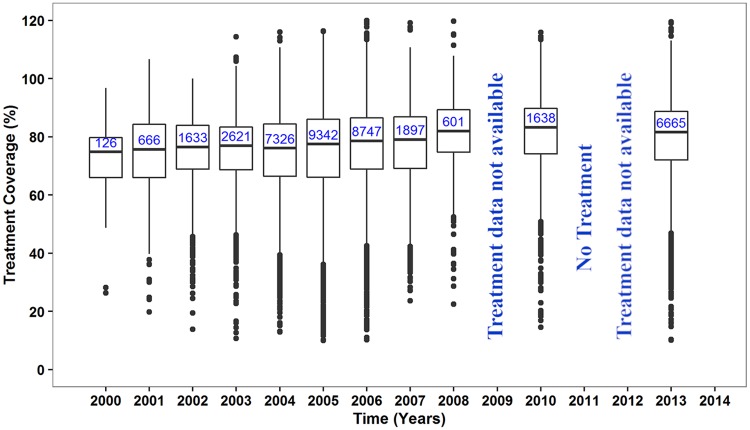
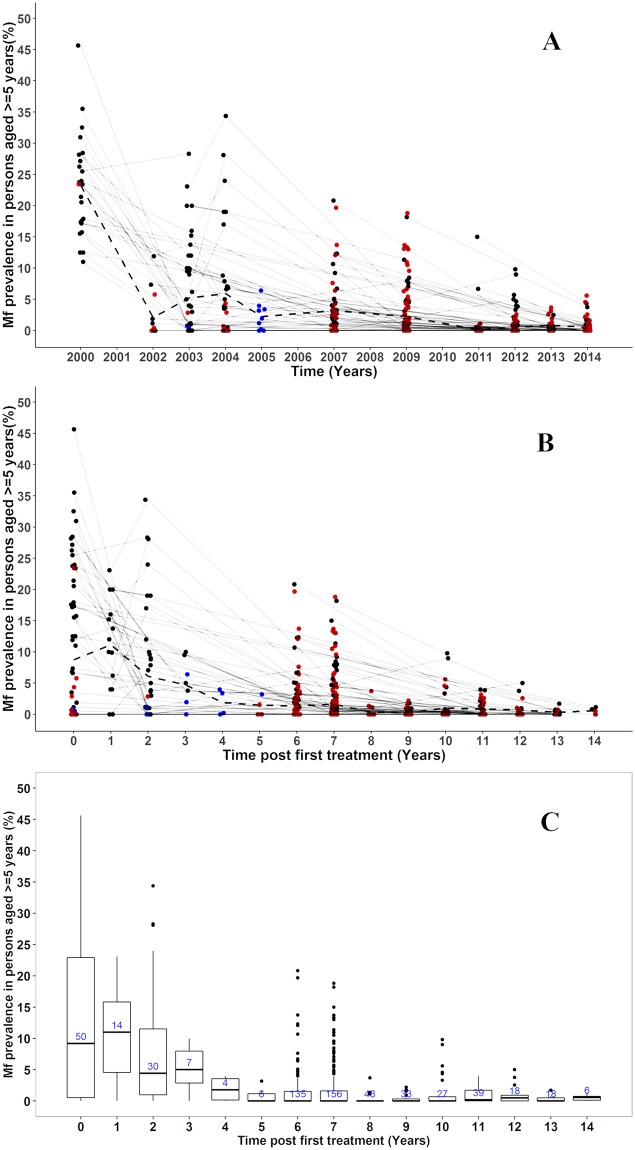
Results: MDA was initiated in 2001-2006 in all 98 endemic districts; by the end of 2016, 81 had stopped MDA after passing TAS and after an average of 11 rounds of treatment (range 8-14 rounds). The median reported coverage for the communities was 77-80%. Mf prevalence survey data were available for 430 communities from 78/98 endemic districts. Baseline mf prevalence data were available for 53 communities, with an average mf prevalence of 8.7% (0-45.7%). Repeated measurements were available for 78 communities, showing a steep decrease in mean mf prevalence in the first few years of MDA, followed by a gradual further decline. In the 2013 and 2014 surveys, 7 and 10 communities respectively were identified with mf prevalence still above 1% (maximum 5.6%). Fifteen of the communities above threshold are all within districts where MDA was still ongoing by 2016.

Conclusions: The MDA programme of the Ghana Health Services has reduced mf prevalence in sentinel sites below the 1% threshold in 81/98 endemic districts in Ghana, yet 15 communities within 13 districts (MDA ongoing by 2016) had higher prevalence than this threshold during the surveys in 2013 and 2014. These districts may need to intensify interventions to achieve the WHO 2020 target.


Conflict of interest statement

Authors have declared they have no competing interests exists.

Figures

Fig 1
Fig 1. Progress of MDA implementation in Ghana by district.
NB: In the year 2011, there was no treatment due to some logistical challenges. The maps give an overview of the treatment progression to cover all the endemic districts in Ghana.
Fig 2
Fig 2. Duration of MDA by district in Ghana.
A) Period of MDA by each district in order of start year. Each horizontal line represents a district. Bars with a dashed section on the right-hand side represent districts where MDA is still ongoing after 2016 with unknown end year. See supplementary S2 Table for more details. B) Frequency distribution of the number of years of treatments provided by district through 2016, presented separately for districts that had stopped MDA by 2016 and those with still ongoing MDA.
Fig 3
Fig 3. Reported treatment coverage in treated communities in Ghana.
The box at each time point represents the interquartile range of coverage and the thick horizontal lines across each box represent the median coverage. The bullets outside each box (above or below) represent the outliers and are calculated as 1.5 times the interquartile range above or below the ends of the box (25th and 75th percentile). The vertical lines (whiskers) extend to the first value (coverage) before the outlier cut-off and where there are no outliers, they represent the minimum and maximum coverage at each time point. The numbers in the boxes are the total number of communities treated at each time point. There was no treatment offered in 2011 due to some challenges; 2009 and 2012 treatment data not available.
Fig 4
Fig 4. Observed lymphatic filariasis mf prevalence in sentinel and spot-check sites in Ghana, measured in the population aged 5 and above, for the period 2000–2014.
A) Data presented by calendar year. Multiple observations from the same community are connected through thin grey lines. Observations from communities surveyed only once are highlighted in brown. Observations presenting aggregated prevalence over multiple communities are displayed in blue (in 2003 and 2005). Dashed lines represent the average prevalence from all surveyed communities at each time point. Bullets at the same time point have been jittered to avoid overlapping of points at the same position; these do not represent time in months. B) As panel A but with time since first treatment on the horizontal axis. C) As B, but with data summarized in boxplots. The box at each time post treatment represents the interquartile range of mf prevalence in ≥5 years and the thick horizontal lines across each box represent the median mf prevalence. The bullets outside each box (above or below) represent the outliers and are defined as 1.5 times the interquartile range above or below the ends of the box (25th and 75th percentile). The vertical lines (whiskers) extend to the first value (mf prevalence) before the outlier cut-off and where there are no outliers, they represent the minimum and maximum mf prevalence at each time post treatment. The numbers in the boxes are the total number of communities examined at each time post treatment.

References

    1. Michael E, Bundy DA, Grenfell BT (1996) Re-assessing the global prevalence and distribution of lymphatic filariasis. Parasitology 112 (Pt 4): 409–428. - PubMed
    1. WHO (2015) Global programme to eliminate lymphatic filariasis: progress report, 2014. Wkly Epidemiol Rec 90: 489–504. - PubMed
    1. Ottesen EA (2000) The global programme to eliminate lymphatic filariasis. Trop Med Int Health 5: 591–594. - PubMed
    1. WHO (2017) Summary of global update on preventive chemotherapy implementation in 2016: crossing the billion. Weekly epidemiological records 40: 589–608. - PubMed
    1. Rebollo MP, Mohammed KA, Thomas B, Ame S, Ali SM, et al. (2015) Cessation of mass drug administration for lymphatic filariasis in Zanzibar in 2006: was transmission interrupted? PLoS Negl Trop Dis 9: e0003669 10.1371/journal.pntd.0003669 - DOI - PMC - PubMed

Publication types

MeSH terms