. 2019 Aug 8;75(3):644-660.e5.
doi: 10.1016/j.molcel.2019.07.028.

Landscape of Intercellular Crosstalk in Healthy and NASH Liver Revealed by Single-Cell Secretome Gene Analysis

Affiliations

Landscape of Intercellular Crosstalk in Healthy and NASH Liver Revealed by Single-Cell Secretome Gene Analysis

Xuelian Xiong et al. Mol Cell. .

Abstract

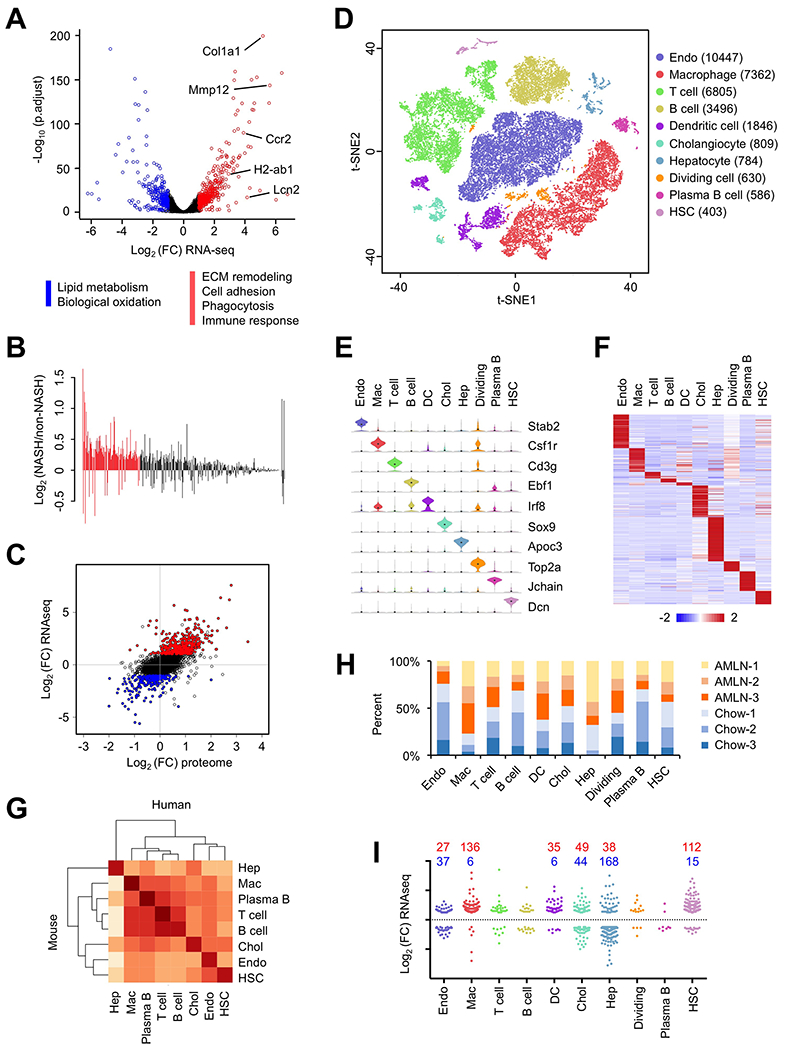
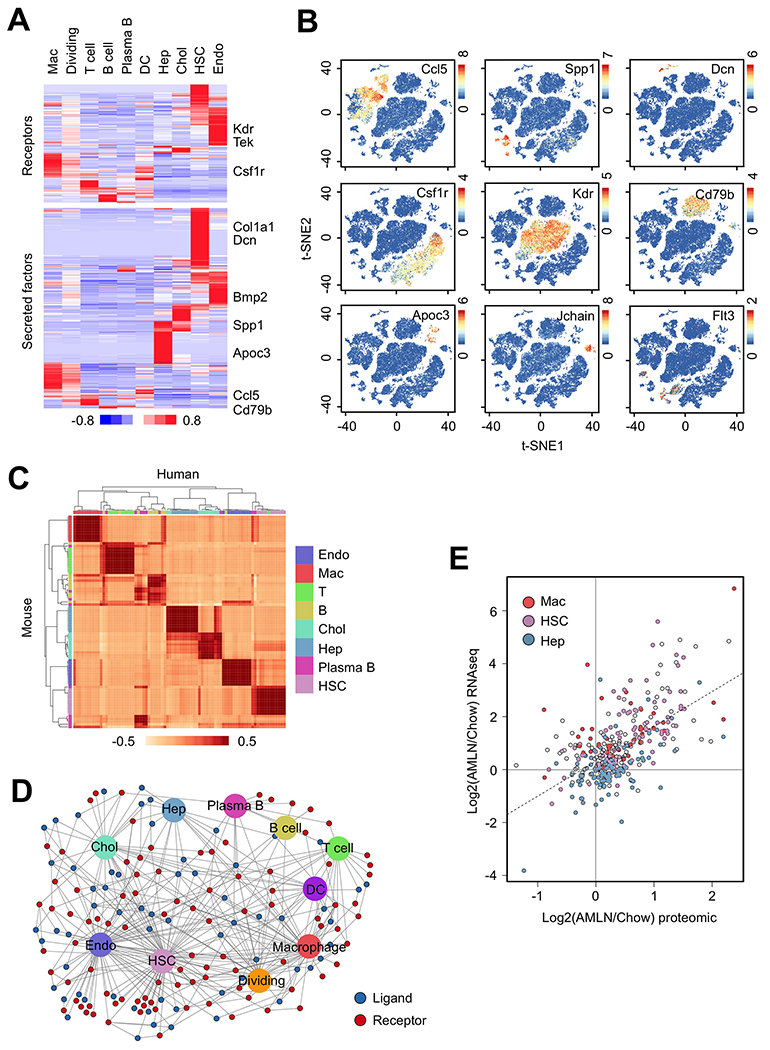
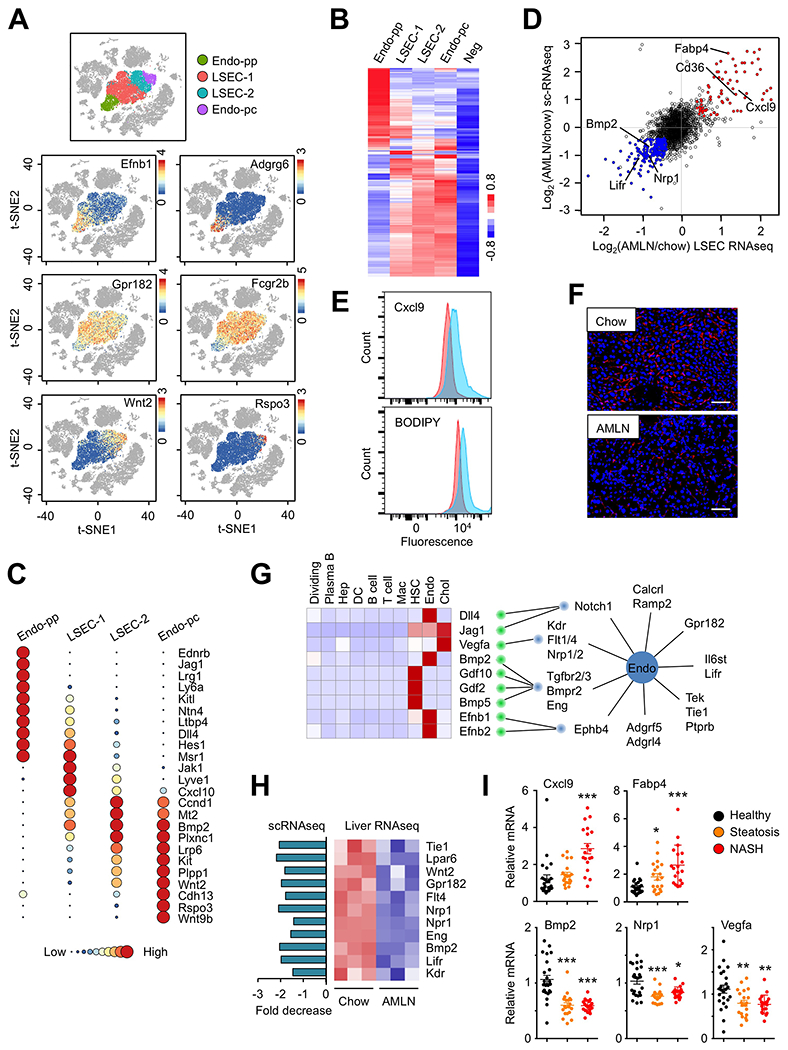
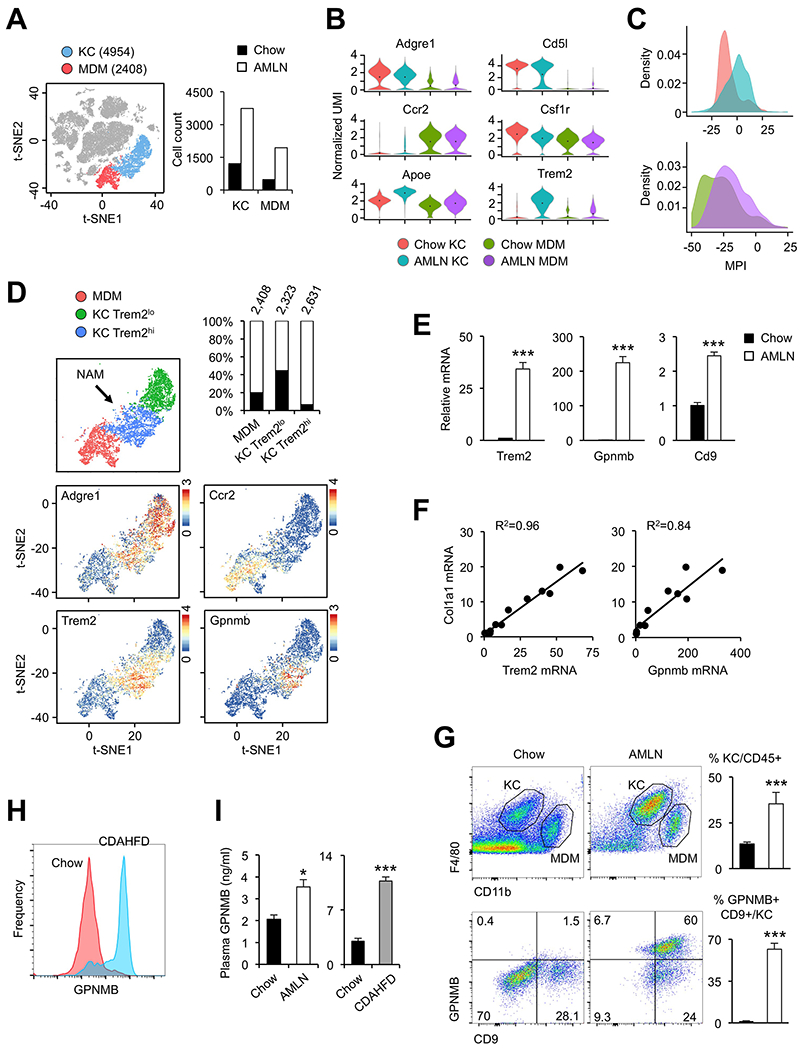
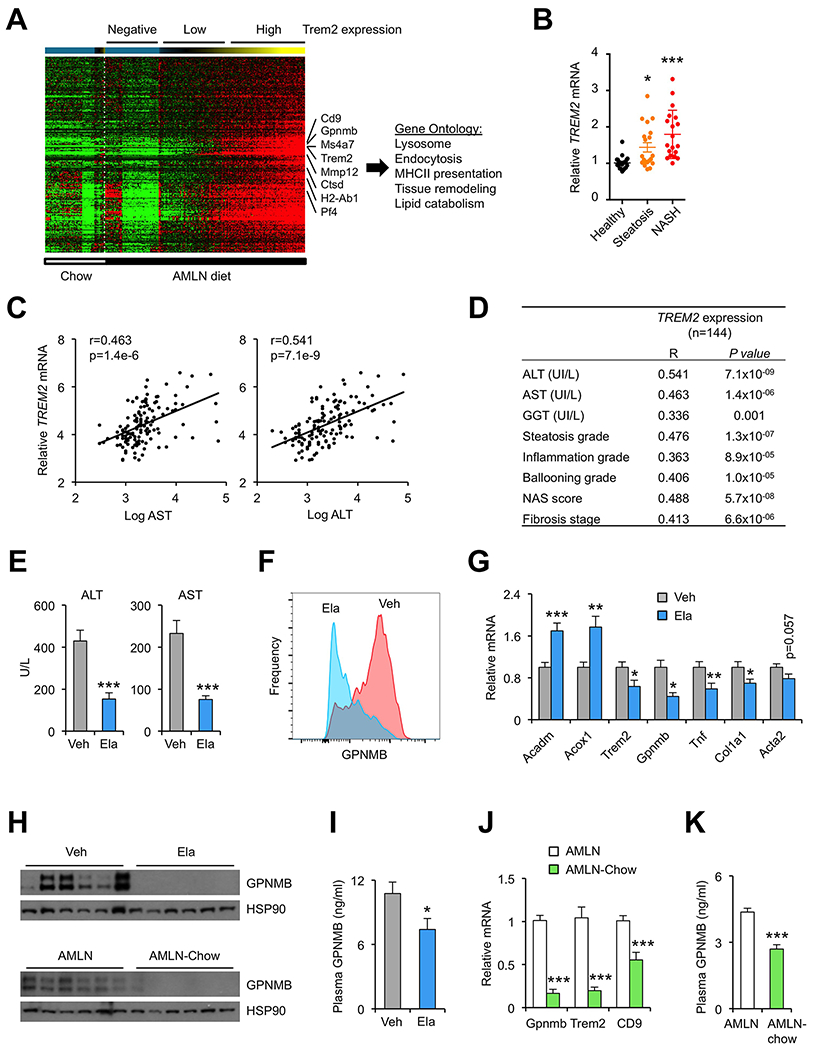
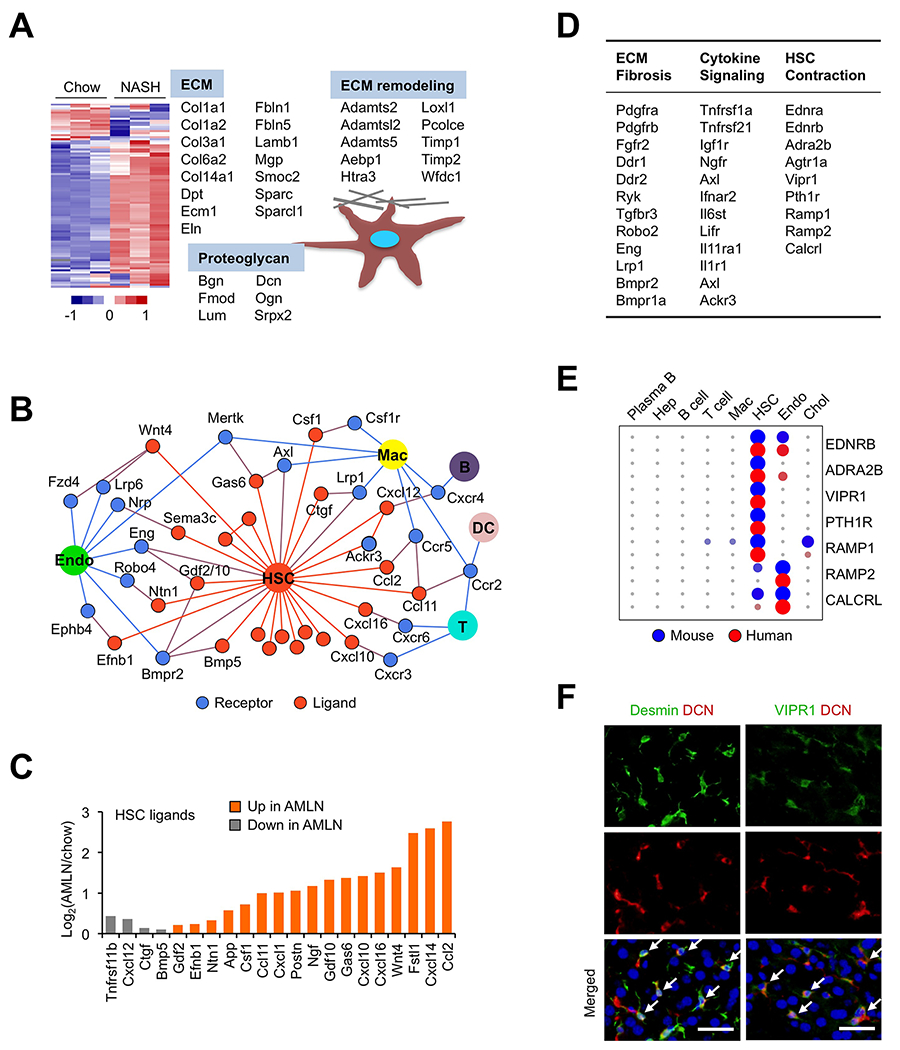
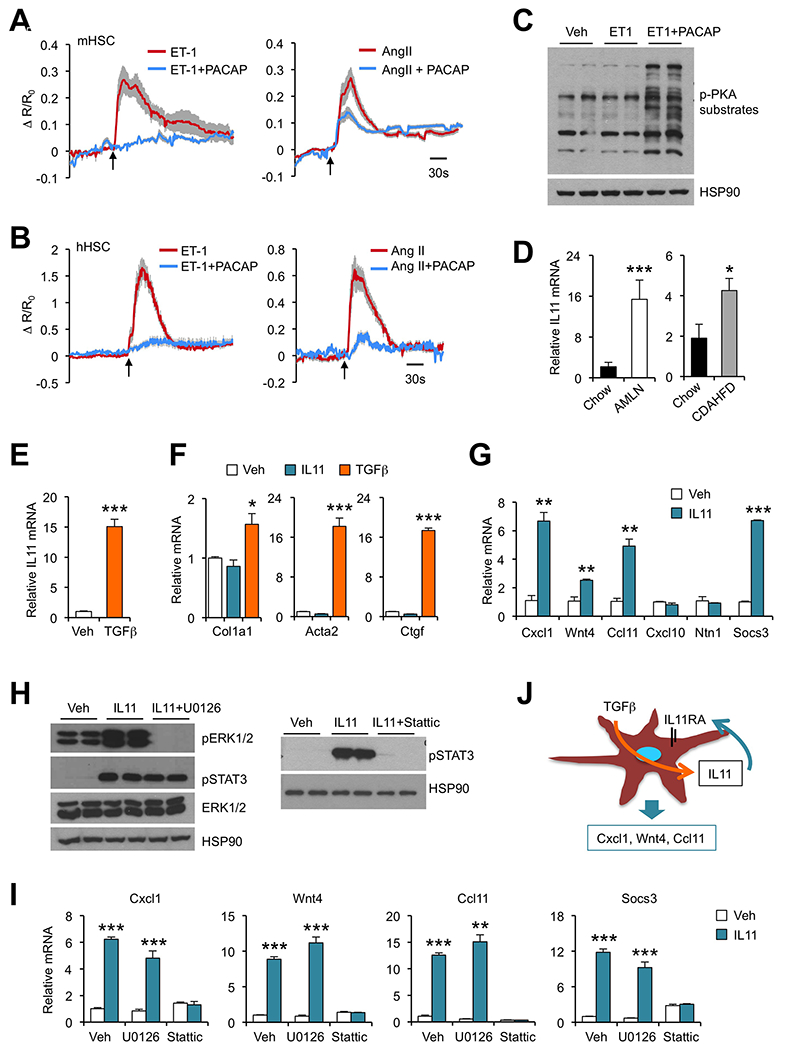
Cell-cell communication via ligand-receptor signaling is a fundamental feature of complex organs. Despite this, the global landscape of intercellular signaling in mammalian liver has not been elucidated. Here we perform single-cell RNA sequencing on non-parenchymal cells isolated from healthy and NASH mouse livers. Secretome gene analysis revealed a highly connected network of intrahepatic signaling and disruption of vascular signaling in NASH. We uncovered the emergence of NASH-associated macrophages (NAMs), which are marked by high expression of triggering receptors expressed on myeloid cells 2 (Trem2), as a feature of mouse and human NASH that is linked to disease severity and highly responsive to pharmacological and dietary interventions. Finally, hepatic stellate cells (HSCs) serve as a hub of intrahepatic signaling via HSC-derived stellakines and their responsiveness to vasoactive hormones. These results provide unprecedented insights into the landscape of intercellular crosstalk and reprogramming of liver cells in health and disease.

Keywords: HSC; Kupffer; NAFLD; NASH; NPC; Trem2; liver; macrophage; scRNA-seq; secretome; single-cell; stellakine.


Conflict of interest statement

Competing interests

The authors declare no competing interests.

Figures

Figure 1.
Figure 1.. Single-cell RNA-seq analysis of NPC isolated from healthy and NASH mouse livers.
(A) Volcano plot of hepatic gene expression in chow and AMLN diet-fed mice analyzed by RNA-seq of total liver mRNA. Genes upregulated or downregulated by more than 2-fold are shown in red and blue, respectively. (B) Bar graph of relative expression comparing NASH (NAS > 5.0) and non-NASH (NAS < 3.0) human livers for the list of genes upregulated in mouse NASH. Red bars denote genes differentially regulated in human NASH (FDR < 0.1). (C) Correlation between RNA-seq and quantitative proteomic analyses. Shown is scatter plot of log-transformed fold change (FC) of mRNA (y-axis) and protein (x-axis) expression values comparing AMLN and chow livers. Genes upregulated or downregulated by more than 2-fold in RNA-seq are indicated in red and blue, respectively. (D) t-SNE visualization of liver cell clusters based on 33,168 single cell transcriptomes. Cell counts for endothelial cells (Endo), macrophages, T cells, B cells, DC, cholangiocytes (Chol), hepatocytes (Hep), dividing cells, plasma B cells and HSC are indicated in parentheses. (E) Violin plots showing representative marker gene expression for each cluster. (F) Heat map of cluster marker genes. (G) Correlation matrix between mouse and human liver cells. Normalized average UMI values for each cell type were used in the calculation of correlation coefficient values. (H) Percent contribution of chow (blue) and AMLN (orange) mouse liver cells from in each cluster. (I) Cell type distribution for upregulated (red) and downregulated (blue) genes in NASH mouse (A). Each gene was assigned a cluster based on the cell type with highest expression for that gene.
Figure 2.
Figure 2.. Liver cell secretome gene analysis.
(A) Heat map representation of genes expression for membrane receptors (top) and secreted factors (bottom) among liver cell types. Genes with normalized UMI values > 1.0 in at least one cluster were included in the analyses. (B) Visualization of cell-type specific ligand and receptor gene expression. (C) Correlation of ligand and receptor gene expression between mouse and human liver cells. (D) Network visualization of ligand-receptor connectivity among different mouse liver cell types. (E) Scatter plot of ligand and receptor gene expression based on RNA-seq and quantitative proteomic data. The genes with highest expression in HSC, macrophages and hepatocytes are indicated.
Figure 3.
Figure 3.. Disruption of the hepatic vascular signaling network in NASH.
(A) t-SNE visualization and marker gene expression in four liver endothelial subtypes. (B) Clustering analysis and heat map of gene expression in four endothelial subtypes. Averaged expression values from non-endothelial clusters were used as negative background (Neg). (C) Circle plots illustrating subtype-specific gene expression. Normalized average UMI values for each subcluster were represented by dot size and color intensity. (D) Scatter plot of endothelial gene expression revealed by scRNA-seq of liver NPC (y-axis) and RNA-seq analysis of LSEC (x-axis) isolated from chow and AMLN mouse livers. (E) Flow cytometry analysis of Cxcl9 and lipid accumulation (BODIPY) in gated LSEC from chow (red) and AMLN (blue) mouse livers. (F) Anti-FCGR2B immunofluorescence staining of frozen liver sections from chow and AMLN mice (scale bar=100μm). (G) The liver vascular signaling network. Shown are heat map of ligands (left) and expression of membrane receptors in the endothelial cluster (right). Red lines indicate predicted ligand-receptor pairs. (H) Disruption of endothelial cell signaling network in NASH. Expression of angiocrine ligands and receptors in chow and AMLN mouse livers was analyzed by scRNA-seq (left) and liver RNA-seq (right). (I) Dot plot of microarray expression values in a cohort of healthy individuals and patients with steatosis or NASH. Data were analyzed using one-way ANOVA. *p<0.05, ** p<0.01, *** p<0.001 vs. healthy.
Figure 4.
Figure 4.. Emergence of NASH-associated macrophages in the liver.
(A) Illustration of tissue-resident Kupffer cells (KC, blue) and monocyte-derived macrophages (MDM, red). Total cell counts from chow and AMLN mouse livers for each subcluster are shown on the right (n=3). (B) Violin plot of normalized UMI showing distribution of marker gene expression. (C) Histogram of macrophage polarization index of liver macrophages. Cell types and diets are colored as in (B). (D) t-SNE plot illustrating subpopulations of KC marked by low (green) and high (blue) Trem2 mRNA expression. Percentage contributions of chow (filled) and AMLN (open) macrophages to each subpopulation and total cell counts are indicated. Feature plots of marker gene expression are shown at the bottom. (E) Whole liver qPCR analysis for NAM marker genes in mice fed chow or AMLN diet for 6 months (n=4). (F) Correlation of liver gene expression in a cohort of mice fed AMLN diet for three months. (G) Flow cytometry analysis of liver cells. Percentage of KC in CD45+ cells (top) and GPNMB+ CD9+ KC in mice fed chow or AMLN diet are shown (n=3). (H) Histogram of GPNMB flow cytometry analysis of KC subpopulation in mice fed chow (red) or CDAHFD (blue) for 4 weeks (n=3). (I) Plasma GPNMB levels measured by ELISA comparing chow with AMLN mice (n=10) or chow with CDAHFD mice (n=5). Data in (E), (G), and (I) represent mean ± SEM. *p<0.05, **p<0.01, ***p<0.001 vs. chow; two-tailed unpaired Student’s t-test.
Figure 5.
Figure 5.. Dynamic regulation of NAM in human NASH and during NASH resolution.
(A) Heat map representation of macrophage gene expression. Cells were ordered by increasing Trem2 expression and binned per 25 cells for analysis. A cluster of genes positively correlated with Trem2 is shown. (B) Dot plot of microarray expression values for Trem2 in a cohort of healthy individuals and patients with steatosis or NASH. Data represent mean ± SE and were analyzed using one-way ANOVA. *p<0.05, ** p<0.01, *** p<0.001. (C) Association between liver TREM2 mRNA expression and plasma AST and ALT levels in a cohort of 144 NASH patients. (D) Association between liver TREM2 mRNA expression and NASH parameters in the human patient cohort. (E) Plasma ALT and AST concentrations in CDAHFD-fed mice gavaged daily with vehicle (Veh) or Elafibranor (Ela) for 24 days (n=10). (F) Flow cytometry analysis of GPNMB expression in KC isolated from treated mice (n=3). (G) qPCR analysis of liver gene expression. (H) Immunoblots of whole liver extracts in mice from (E) (top) and extracts from mice fed AMLN diet for six months (AMLN) or four months followed by chow for two months (AMLN-chow) (bottom). (I) Plasma GPNMB levels. (J) qPCR analysis of liver gene expression in mice fed AMLN diet for six months (AMLN) or four months followed by chow for two months (NASH-chow). (K) Plasma GPNMB levels in mice from J. Data in (E), (G) and (I-K) represent mean ± SEM. *p<0.05, **p<0.01, ***p<0.001 vs. chow; two-tailed unpaired Student’s t-test.
Figure 6.
Figure 6.. Landscape of the HSC signaling network.
(A) Heat map representation of HSC-enriched secretome genes using liver RNA-seq data from chow and AMLN mice. Genes encoding structural proteins of ECM and those involved in ECM remodeling are indicated. (B) The HSC secretome. Ligands exhibiting > 3-fold enriched expression in the HSC cluster are shown in orange with their known receptors indicated in blue. The ligand-receptor pairs are shown when receptor expression was observed in at least one cluster (normalized UMI>1.0) based on the scRNA-seq dataset. (C) Regulation of stellakine gene expression in NASH. Average expression values from chow and AMLN liver RNA-seq dataset were used. (D) The HSC-enriched membrane receptors. (E) Circle plot of receptor gene expression in mouse and human liver cells. (F) Immunofluorescence staining of frozen liver sections using antibodies indicated at the top. Nuclei were stained using DAPI (blue). Arrows indicate co-localization of protein expression in HSC (scale bar=50μm).
Figure 7.
Figure 7.. Functional analysis of vasoactive hormone signaling and the autocrine IL11 loop in HSC.
(A) Averaged intracellular calcium traces of primary mouse HSC treated with 100 nM of ET-1 (n=14), ET-1 plus 100 nM of PACAP (n=30), 100 nM of Ang II (n=25) or Ang II plus PACAP (n=41). (B) Averaged intracellular calcium traces of primary human HSC treated with 100 nM ET-1 (n=23), ET-1 plus 100 nM of PACAP (n=16), 100 nM of Ang II (n=21) or Ang II plus PACAP (n=21). Arrows indicate initiation of treatments. Data represent mean ± SD. (C) Immunoblots of mouse HSC lysates treated with vehicle (Veh), ET-1 or ET-1 plus PACAP for 10 min. (D) qPCR analysis of liver Il11 expression in mice fed chow (n=4) or AMLN diet (n=4) for six months. A separate cohort of mice was fed chow (n=5) or CDAHFD (n=5) for four weeks. (E) qPCR analysis of Il11 expression in immortalized mouse HSC treated with Veh or TGFβ (5 ng/ml) for 24 hrs. (F) qPCR analysis of gene expression in immortalized mouse HSC treated with Veh, IL11 (100 ng/ml) or TGFβ (5 ng/ml) for 24 hrs. (G) qPCR analysis of gene expression in immortalized mouse HSC treated with Veh or IL11 (100 ng/ml) for 4 hrs. (H) Immunoblots of total lysates from immortalized mouse HSC treated for 10 min. (I) qPCR analysis of gene expression in immortalized mouse HSC treated with Veh or IL11 without or with U0126 (20 nM) or Stattic (20 μM). (J) Regulation of stellakine gene expression by autocrine IL11 signaling in HSC.

References

    1. Arendt BM, Comelli EM, Ma DW, Lou W, Teterina A, Kim T, Fung SK, Wong DK, McGilvray I, Fischer SE, et al. (2015). Altered hepatic gene expression in nonalcoholic fatty liver disease is associated with lower hepatic n-3 and n-6 polyunsaturated fatty acids. Hepatology 61, 1565–1578. - PubMed
    1. Butler A, Hoffman P, Smibert P, Papalexi E, and Satija R (2018). Integrating single-cell transcriptomic data across different conditions, technologies, and species. Nat Biotechnol 36, 411–420. - PMC - PubMed
    1. Chen Y, Zhang Y, Yin Y, Gao G, Li S, Jiang Y, Gu X, and Luo J (2005). SPD--a web-based secreted protein database. Nucleic Acids Res 33, D169–173. - PMC - PubMed
    1. Clapper JR, Hendricks MD, Gu G, Wittmer C, Dolman CS, Herich J, Athanacio J, Villescaz C, Ghosh SS, Heilig JS, et al. (2013). Diet-induced mouse model of fatty liver disease and nonalcoholic steatohepatitis reflecting clinical disease progression and methods of assessment. Am J Physiol Gastrointest Liver Physiol 305, G483–495. - PubMed
    1. Cohen JC, Horton JD, and Hobbs HH (2011). Human fatty liver disease: old questions and new insights. Science 332, 1519–1523. - PMC - PubMed

Publication types

MeSH terms