. 2019 Aug 8;178(4):795-806.e12.
doi: 10.1016/j.cell.2019.07.008.

Tumor Microbiome Diversity and Composition Influence Pancreatic Cancer Outcomes

Affiliations

Tumor Microbiome Diversity and Composition Influence Pancreatic Cancer Outcomes

Erick Riquelme et al. Cell. .

Abstract

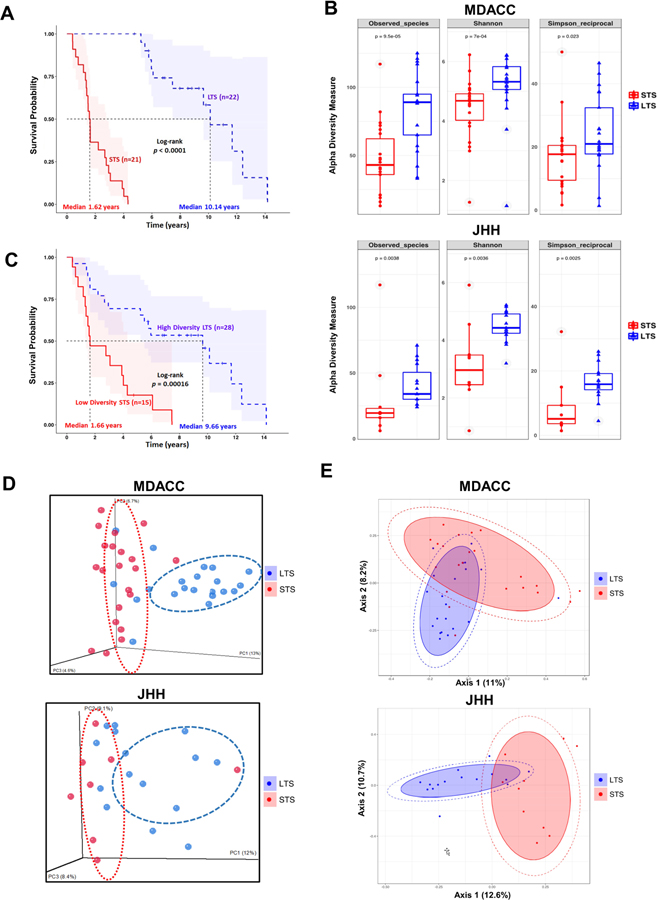
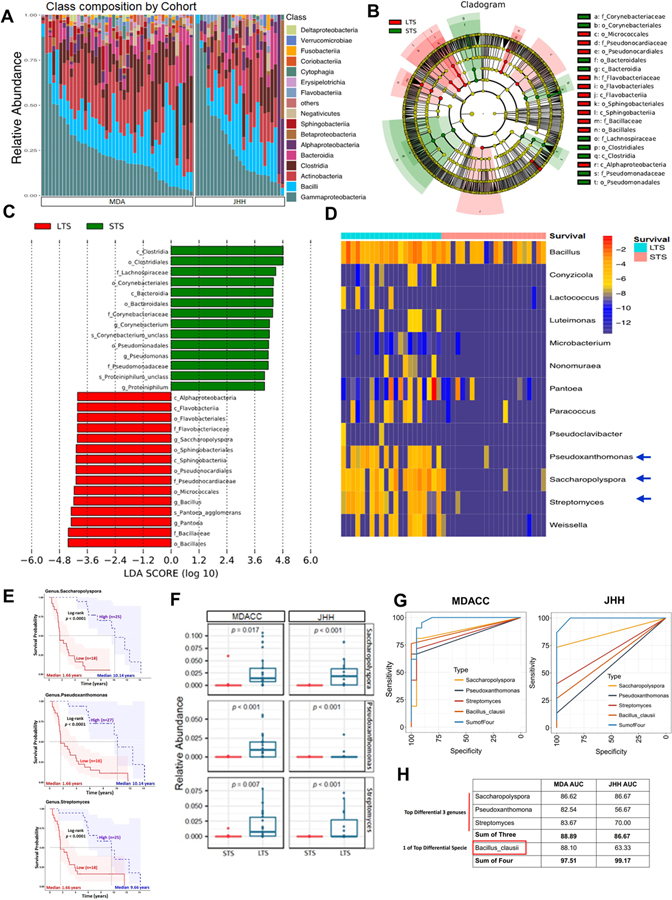
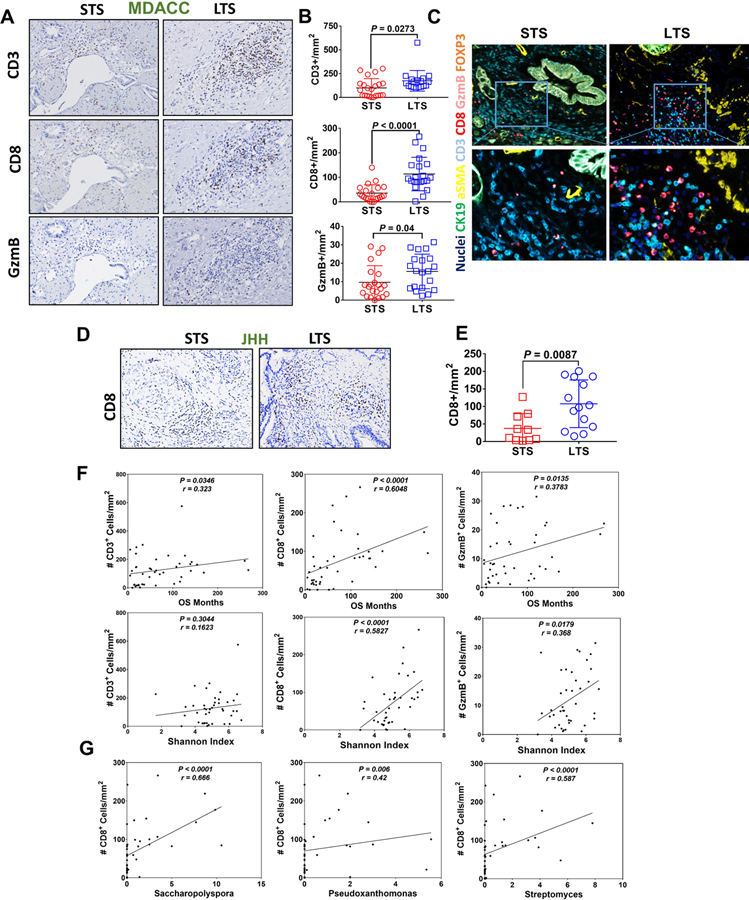
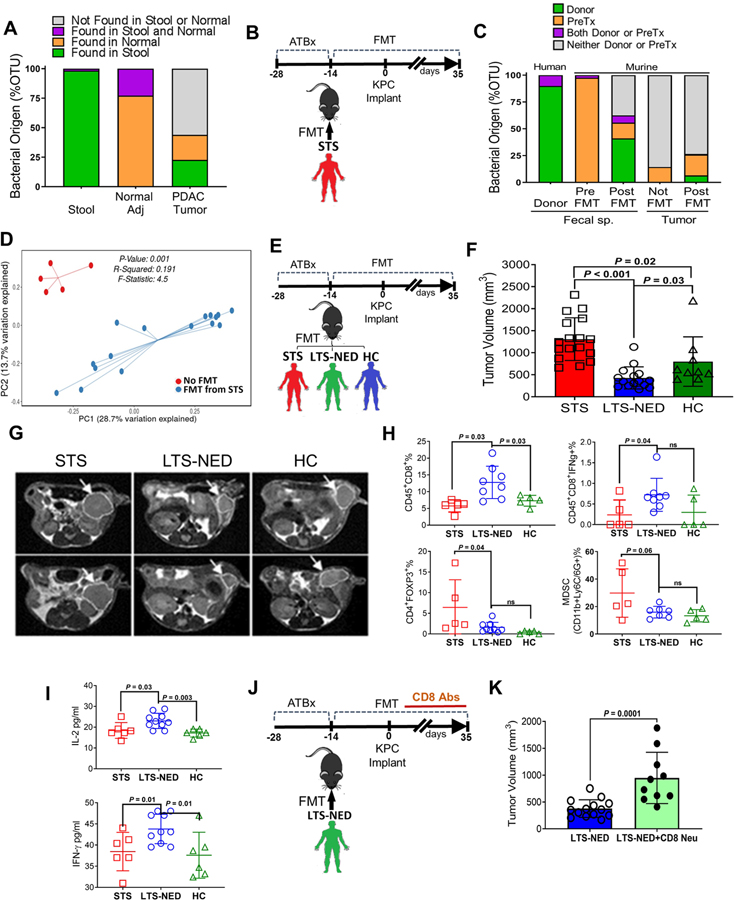
Most patients diagnosed with resected pancreatic adenocarcinoma (PDAC) survive less than 5 years, but a minor subset survives longer. Here, we dissect the role of the tumor microbiota and the immune system in influencing long-term survival. Using 16S rRNA gene sequencing, we analyzed the tumor microbiome composition in PDAC patients with short-term survival (STS) and long-term survival (LTS). We found higher alpha-diversity in the tumor microbiome of LTS patients and identified an intra-tumoral microbiome signature (Pseudoxanthomonas-Streptomyces-Saccharopolyspora-Bacillus clausii) highly predictive of long-term survivorship in both discovery and validation cohorts. Through human-into-mice fecal microbiota transplantation (FMT) experiments from STS, LTS, or control donors, we were able to differentially modulate the tumor microbiome and affect tumor growth as well as tumor immune infiltration. Our study demonstrates that PDAC microbiome composition, which cross-talks to the gut microbiome, influences the host immune response and natural history of the disease.

Keywords: CD8; PDAC; antibiotics; cancer survivors; fecal microbial transplants; immunoactivation; microbiota; pancreatic cancer; tumor microbiome.


Conflict of interest statement

Declaration of Interests: J. Wargo is an inventor on a US patent application (PCT/US17/53.717) submitted by the UT MDACC, and reports compensation for speaker’s bureau and honoraria from Imedex, Dava Oncology, Omniprex, Illumina, Gilead, MedImmune and Bristol-Myers Squibb (BMS). J. Wargo serves as a consultant/advisory board member for Roche/Genentech, Novartis, AstraZeneca, GlaxoSmithKline (GSK), BMS, Merck, Biothera Pharmaceuticals and Microbiome DX, and receives research support from GSK, Roche/Genentech, BMS, and Novartis. A.M. and S.M.H. receive royalties from Hangzhou Guangkeande (Cosmos) Biotechnology Company LTD for a license managed by the MD Anderson Conflict of Interest Committee. FM, ER and YZ are filing a patent with findings presented in this manuscript.

Figures

Figure 1.
Figure 1.
Tumor microbial diversity influences the outcome of PDAC patients. (A) Kaplan-Meier plot of MDACC cohort PDAC patients. (B) Alpha diversity box plot (Observed species, Shannon and Simpson reciprocal) in MDACC and JHH cohorts of PDAC patients. (C) Kaplan-Meier plot of MDACC cohort PDAC patients defined by alpha diversity. (D) Principal coordinate analysis (PCoA) using Unweighted-UniFrad of beta diversity. (E) Principal coordinate analysis (PCoA) using Bray-Curtis metric distances of beta diversity.
Figure 2.
Figure 2.
Tumor microbiome communities are significantly different between LTS and STS. (A) Bar plots of the class taxonomic levels in MDA and JHH cohorts of PDAC patients. Relative abundance is plotted for each tumor. (B) Taxonomic Cladogram from LEfSe, depicting taxonomic association from between microbiome communities from LTS and STS PDAC patients. Each node represents a specific taxonomic type. Yellow nodes denote the taxonomic features that are not significantly differentiated between LTS and STS. Red nodes denote the taxonomic types with more abundance in LTS than in STS, while the green nodes represent the taxonomic types more abundant in STS. (C) LDA score computed from features differentially abundant between LTS and STS. The criteria for feature selection is Log LDA Score > 4. (D) Heatmap of selected most differentially abundant features at the genus level. Highlighting three taxa enriched in LTS. The blue color represents less abundant, lighter yellow color represents intermediate abundance and red represents the most abundant. Highlighting three taxa enriched in LTS. (E) Kaplan-Meier estimates for survival probability based on the abundance levels of microbes enriched at Genus level in LTS. Right plot, Saccharopolyspora, middle plot, Pseudoxanthomonas and left plot, Streptomyces (p < 0.0001). (F) Plots of differentially abundant genus significantly enriched in both MDA and JHH LTS patients. FDR adjusted p-values from negative binomial test p-value. (G) ROC analysis of Taxa relative abundance as predictive of LTS status. The top 3 differential bacteria (Genus) identified and Baccilus Clausii (One of top species) were tested individually and in aggregate in the MDA Discovery Cohort (Left panel) were then validated in the JHH Validation Cohort (Right panel). (H) Table depicting AUC of bacteria tested in Fig2G for both MDA and JHH cohorts.
Figure. 3.
Figure. 3.
Commensal microbiome from LTS PDAC patients induces a strong immune infiltration and antitumoral immune response. (A) Immunohistochemical (IHC) staining of CD3, CD8 and Granzyme B from tumors of STS and LTS PDAC patients (representative picture). (B) Quantification of IHC of CD3, CD8 and Granzyme B on STS and LTS PDAC patients. (C) Representive pictures of multiplex immunofluorescence staining (Multiplex IF) with Opal kit. (D) Immunohistochemical staining of CD8 from tumors of STS and LTS PDAC patients from validation cohorts (JHH) (representative picture). (E) Quantification of IHC of CD8 on STS and LTS PDAC patients from validation cohorts (JHH). (F) Spearman correlation between CD3+, CD8+ and GzmB+ tissue densities and the overall survival (upper panel) and alpha diversity by Shannon Index (lower panel) of all PDAC patients. (G) Spearman correlation between CD8+ tissue densities and Saccharopolyspora, Pseudoxanthomonas and Streptomyces (p < 0.0001, p = 0.006 and p < 0.0001, respectivelly) in PDAC patients.
Figure. 4.
Figure. 4.
Gut microbiota from PDAC patients can influence tumor microbiota and tumor growth (A) Taxonomic classification of bacterial 16S sequence detected in human samples by origin (B) Experimental design of Fecal Microbiota Transplantation (FMT) from metastatic PDAC donors in C57BL/6 wild-type mice treated with antibiotics (ATBx). (C) Taxonomic classification of bacterial 16S sequence detected in human donor stools and FMT recipient mice (stools/tumors) by origin. (D) Principal coordinate analysis (PCA) using Unweighted-UniFraC of beta diversity, showing closeness between mice that received FMT from PDAC STS patients and distance from those that did not receive FMT. (E) Experimental design of Fecal Microbiota Transplantation (FMT) from advanced PDAC (STS), PDAC LTS with no evidence of disease (LTS-NED) and Healthy Control (HC) donors in C57BL/6 wild-type mice treated with antibiotics (ATBx). (F) Tumor volume from mice orthotopically implanted with KPC pancreatic cancer cell lines along with transplantation with stools from STS, LTS-NED and HC donors. (G) Magnetic resonance imaging (MRI) scans of KPC-implanted mice transplanted with stools from STS, LTS-NED and HC donors (representative images). (H) Flow cytometry analysis of CD45+CD8+, CD45+CD8+IFN-γ+, Treg (CD45+CD4+FOXP3+) and MDSC (CD45+CD11b+Ly-6G/Ly-6C+) cells from KPC-implanted mice and transplanted with stools from STS, LTS-NED and HC donors. (I) Serum level of IL-2 and IFN-γ in KPC-implanted mice and transplanted with stools from STS, LTS-NED and HC donors. (J) Experimental design of Fecal Microbiota Transplantation (FMT) from LTS-NED who received CD8 neutralizing antibodies vs isotype control. (K) Tumor volume from KPC-implanted mice and transplanted with stools from LTS-NED who received CD8 neutralizing antibodies vs isotype control.

Comment in

References

    1. Anders S, and Huber W(2010). Differential expression analysis for sequence count data. Genome Biol 11, R106. - PMC - PubMed
    1. Atarashi K, Tanoue T, Oshima K, Suda W, Nagano Y, Nishikawa H, Fukuda S, Saito T, Narushima S, Hase K, et al. (2013). Treg induction by a rationally selected mixture of Clostridia strains from the human microbiota. Nature 500, 232–236. - PubMed
    1. Balachandran VP, Luksza M, Zhao JN, Makarov V, Moral JA, Remark R, Herbst B, Askan G, Bhanot U, Senbabaoglu Y, et al.(2017). Identification of unique neoantigen qualities in long-term survivors of pancreatic cancer. Nature 551, 512–516. - PMC - PubMed
    1. Benjamini Y, Drai D, Elmer G, Kafkafi N, and Golani I(2001). Controlling the false discovery rate in behavior genetics research. Behav Brain Res 125, 279–284. - PubMed
    1. Bolger AM, Lohse M, and Usadel B(2014). Trimmomatic: a flexible trimmer for Illumina sequence data. Bioinformatics 30, 2114–2120. - PMC - PubMed

Publication types

MeSH terms

Substances