. 2019 Aug 8;178(4):807-819.e21.
doi: 10.1016/j.cell.2019.07.031.

The Oncogenic Action of NRF2 Depends on De-glycation by Fructosamine-3-Kinase

Affiliations

The Oncogenic Action of NRF2 Depends on De-glycation by Fructosamine-3-Kinase

Viraj R Sanghvi et al. Cell. .

Abstract

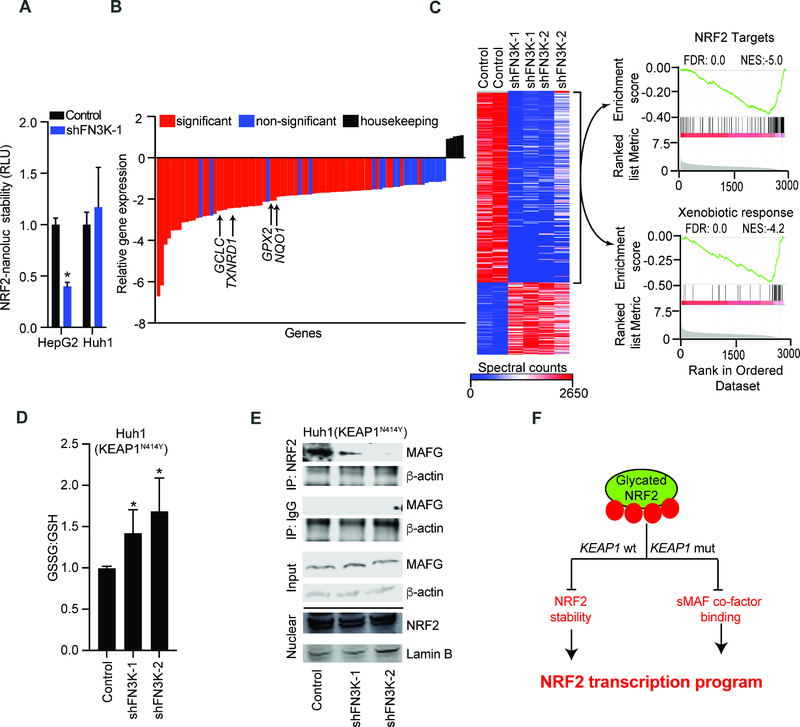
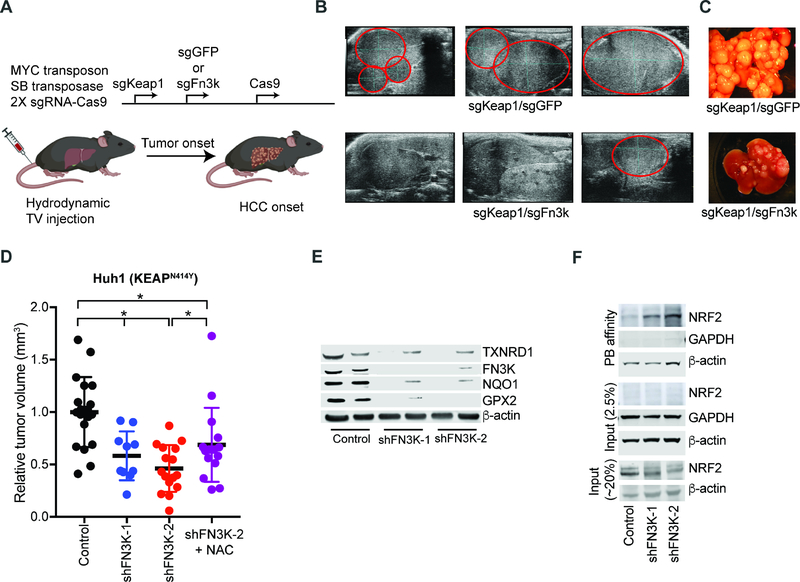
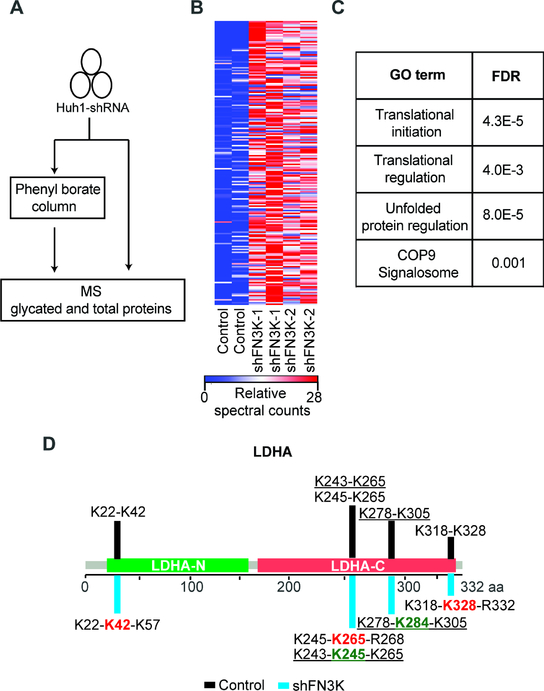
The NRF2 transcription factor controls a cell stress program that is implicated in cancer and there is great interest in targeting NRF2 for therapy. We show that NRF2 activity depends on Fructosamine-3-kinase (FN3K)-a kinase that triggers protein de-glycation. In its absence, NRF2 is extensively glycated, unstable, and defective at binding to small MAF proteins and transcriptional activation. Moreover, the development of hepatocellular carcinoma triggered by MYC and Keap1 inactivation depends on FN3K in vivo. N-acetyl cysteine treatment partially rescues the effects of FN3K loss on NRF2 driven tumor phenotypes indicating a key role for NRF2-mediated redox balance. Mass spectrometry reveals that other proteins undergo FN3K-sensitive glycation, including translation factors, heat shock proteins, and histones. How glycation affects their functions remains to be defined. In summary, our study reveals a surprising role for the glycation of cellular proteins and implicates FN3K as targetable modulator of NRF2 activity in cancer.

Keywords: EGFR; FN3K; KEAP1; NRF2; de-glycation; fructosamine; glucose; glycation; hepatocellular carcinoma; redox.


Conflict of interest statement

Declaration of Interests

The authors declare no competing interests.

Figures

Figure 1:
Figure 1:. NRF2 has an oncogenic function in hepatocellular carcinoma
A) Kaplan-Meier survival analysis of mice hydrodynamically injected with the MYC transposon system and the indicated NRF2 activating guide RNAs (sgRNA) and Cas9; B) Representative diseased livers from mice injected with MYC and sgKeap1 or sgNrf2 (targeting the Keap1 interacting ETGE domain); C) In vivo growth of murine MYC/sgKeap1 tumors transduced with Nrf2-targeted or control shRNAs; Data from HCC lines 1 & 2 were combined and plotted (n=5 each); D) Kaplan-Meier survival analysis of mice that were hydrodynamically injected with the MYC transposon system and an sgRNA/Cas9 targeting Keap1 and subsequently treated with glutathione synthesis inhibitor BSO. (* indicates p-value < 0.05 by two-tailed student t test). See also Figure S1 and Table S1.
Figure 2:
Figure 2:. Mutual exclusive activation of NRF2 and EGFR pathways in human cancers
A) Unbiased, pan-cancer analysis of mutations that are significantly related (co-occurring or mutual exclusive) with KEAP1 and NRF2 using the SELECT algorithm (see text and methods for details); B) Oncoprint showing mutual exclusive relation between NRF2/ KEAP1 and EGFR mutations in human cancers; C) Nuclear extracts from HepG2 cells treated with NRF2 inducer DLS (1 μM, 24 hours), EGF (10 ng/mL, 24 hours), TGFα (1 nM, 24 hours) or DMSO and probed with antibodies against NRF2 and lamin B; D) Nuclear (upper panel) and cytoplasmic extracts (lower panel) from H3255 (EGFRL858R) cells transduced with EGFR-specific shRNA or control and immunoblotted with indicated antibodies; E) Viability of isogenic H3255 cells transduced with sgRNAs targeting KEAP1 or LacZ (control) and treated with erlotinib; error bars represent SD from 3 replicates; F) Lysates from paired PC9 cells transduced with indicated sgRNA-Cas9 constructs and treated with DMSO or erlotinib (10 nM, 6 hours) probed with the indicated antibodies. (* indicates p-value < 0.05 by two-tailed student t test). See also Figure S2 and Table S2.
Figure 3:
Figure 3:. Genome-wide CRISPR screen identifies the de-glycating kinase FN3K as a requirement for NRF2 function
A) Diagram of our strategy for a genome-wide screen against NRF2 driven expression of the HSV-TK suicide gene; B) Map of the lentiviral vector directing ARE-controlled HSV-TK and luciferase expression; C) Change in sgRNA library representation comparing untreated cells and cells treated with the NRF2 inducer tBHQ and ganciclovir; D) Predicted sites of NRF2 protein glycation using indicated algorithms; TAD: Transactivation domain; E) Phenyl borate affinity purification and immunoblotting reveals NRF2 glycation upon FN3K knockdown in KEAP1 mutant Huh1 cells; values on top refers to % of glycated NRF2 represented by the ratio of NRF2 signal intensity in PB-bound (PB) to the sum PB-bound and flow through (FT); F) Immunoblot for nuclear (upper panel) and cytoplasmic (lower panel) levels of the indicated proteins in KEAP1 wild type HepG2 cells transduced and treated as indicated; G) Chromatin immunoprecipitation (ChIP) on indicated HepG2 nuclear lysates with anti-NRF2 antibody followed by amplification of indicated promoters; shown as % of input DNA and error bar is SD of 4 replicates; H) Viability of HepG2 cells untreated or treated with H2O2 (400 μM, 24 hours) with and with without pre-incubation with NAC (10 mM, 3 hours); mean of 9 replicates ± SD. (* indicates p-value < 0.05 by two-tailed student t test). See also Figure S3 and Table S3.
Figure 4:
Figure 4:. NRF2 glycation suppresses its oncogenic functions in KEAP1 wild type and mutant cell
A) Measuring NRF2 stability using an NRF2-nanoluciferase fusion protein in lysates of KEAP1 proficient HepG2 and KEAP1 mutant Huh1 cells transduced with control or shRNA against FN3K; mean of n=6 for HepG2 and n=3 for Huh1 cells ± SD; B) Relative expression of ~80 antioxidative genes in KEAP1N414Y mutant Huh1 cells transduced with control or FN3K shRNAs; average of four replicates (n=2 for each FN3K-specific shRNAs) relative to control shRNA; C) Unsupervised clustering of total proteomics data from indicated Huh1 cell lysates; GSEA analysis of over- and underrepresented proteins in FN3K-deficient cells shows reduction of NRF2 target proteins (top) and proteins involved in xenobiotic metabolism (bottom); D) Luminescence-based quantification of oxidized and reduced glutathione in KEAP1N414Y Huh1 cells expressing control vector or shRNA against FN3K; error bar represents SD from n ≥ 5 replicates; E) Nuclear extracts from Huh1 cells with control vector or FN3K knockdown immunoprecipitated with NRF2 or IgG antibodies and probed for MAFG and β-actin; nuclear lysates (bottom) were loaded on a separate gel and probed with αNRF2 and αLamin B as indicated; F) Schematic of KEAP1-dependent and independent mechanisms of NRF2 inhibition by glycation. (*denotes two-tailed t test calculated p-value of <0.05). See also Figure S4 and Table S4.
Figure 5:
Figure 5:. Mapping and quantifying NRF2 glycation by mass spectrometry
A) Mass spectrometric identification of tryptic peptides from unglycated (upper) and in vitro glycated recombinant NRF2 (lower); peptides that decreased in abundance upon in vitro glycation are shown in black while those that are unaffected in red; B) AUC analysis of indicated tryptic peptides generated from non-glycated and in vitro glycated NRF2; data are represented relative to R25-R34 peptide and error bar represents SD from 3 replicates; C) Spectral plot of K487-R499 peptide from unmodified (left) and in vitro glycated NRF2 (right, 5 g/L glucose for 14 days); D) Spectral intensity graphs of indicated peptides obtained from tryptic digest of immunoprecipitated nuclear NRF2 from control and FN3K deficient Huh1 cells; E) Normalized AUC analysis of indicated tryptic peptides generated by digesting immunoprecipitated NRF2 from parental (n=2) or FN3K-silenced Huh1 cells (n=3) as indicated; error bar represents SD. (* indicates p-value < 0.05). See also Figures S5, S6, and Table S5.
Figure 6:
Figure 6:. FN3K is required for proliferation of NRF2-driven tumors in vivo
A) Diagram of dual gene-targeting strategy in murine HCCs; B) Ultrasound of murine livers 4 weeks after injection with indicated plasmids; tumors are marked in red; C) Ex vivo images of livers from animals injected with indicated sgRNA combinations; D) Subcutaneous Huh1 xenografts with and without FN3K knockdown and NAC treatment as indicated measured ~30 days after implantation; E) Decreased NRF2 target protein expression by immunoblot on the FN3K deficient Huh1 tumors from panel 5D; F) Phenyl borate enrichment and immunoblot shows NRF2 glycation in the FN3K deficient Huh1 xenografts. See also Figure S7 and Table S6.
Figure 7:
Figure 7:. Analyzing the glycated proteome in liver cancer
A) Experimental strategy for MS identification of differentially glycated proteins in isogenic FN3K proficient and deficient Huh1 cells B) Heat map showing significantly glycated proteins in FN3K-deficient Huh1 cells; C) Gene ontology analysis identifies pathways significantly enriched in proteins susceptible to FN3K-sensitive glycation; D) Glycation patterns for LDHA; terminally glycated lysine residues that cause peptide elongations upon FN3K knockdown are marked in red while internal residues are shown in green and underlined. See also Figure S8 and Table S7.

References

    1. Abdel-Wahab YH, O’Harte FP, Barnett CR, and Flatt PR (1997). Characterization of insulin glycation in insulin-secreting cells maintained in tissue culture. The Journal of endocrinology 152, 59–67. - PubMed
    1. Anguizola J, Matsuda R, Barnaby OS, Hoy KS, Wa C, DeBolt E, Koke M, and Hage DS (2013). Review: Glycation of human serum albumin. Clinica chimica acta; international journal of clinical chemistry 425, 64–76. - PMC - PubMed
    1. Arbour KC, Jordan E, Kim HR, Dienstag J, Yu HA, Sanchez-Vega F, Lito P, Berger M, Solit DB, Hellmann M, et al. (2018). Effects of Co-occurring Genomic Alterations on Outcomes in Patients with KRAS-Mutant Non-Small Cell Lung Cancer. Clinical cancer research : an official journal of the American Association for Cancer Research 24, 334–340. - PMC - PubMed
    1. Bai X, Chen Y, Hou X, Huang M, and Jin J (2016). Emerging role of NRF2 in chemoresistance by regulating drug-metabolizing enzymes and efflux transporters. Drug metabolism reviews 48, 541–567. - PubMed
    1. Banito A, Li X, Laporte AN, Roe JS, Sanchez-Vega F, Huang CH, Dancsok AR, Hatzi K, Chen CC, Tschaharganeh DF, et al. (2018). The SS18-SSX Oncoprotein Hijacks KDM2B-PRC1.1 to Drive Synovial Sarcoma. Cancer cell 33, 527–541 e528. - PMC - PubMed

Publication types

MeSH terms