. 2019 Aug 8;178(4):850-866.e26.
doi: 10.1016/j.cell.2019.07.015.

Inherited and De Novo Genetic Risk for Autism Impacts Shared Networks

Affiliations

Inherited and De Novo Genetic Risk for Autism Impacts Shared Networks

Elizabeth K Ruzzo et al. Cell. .

Abstract

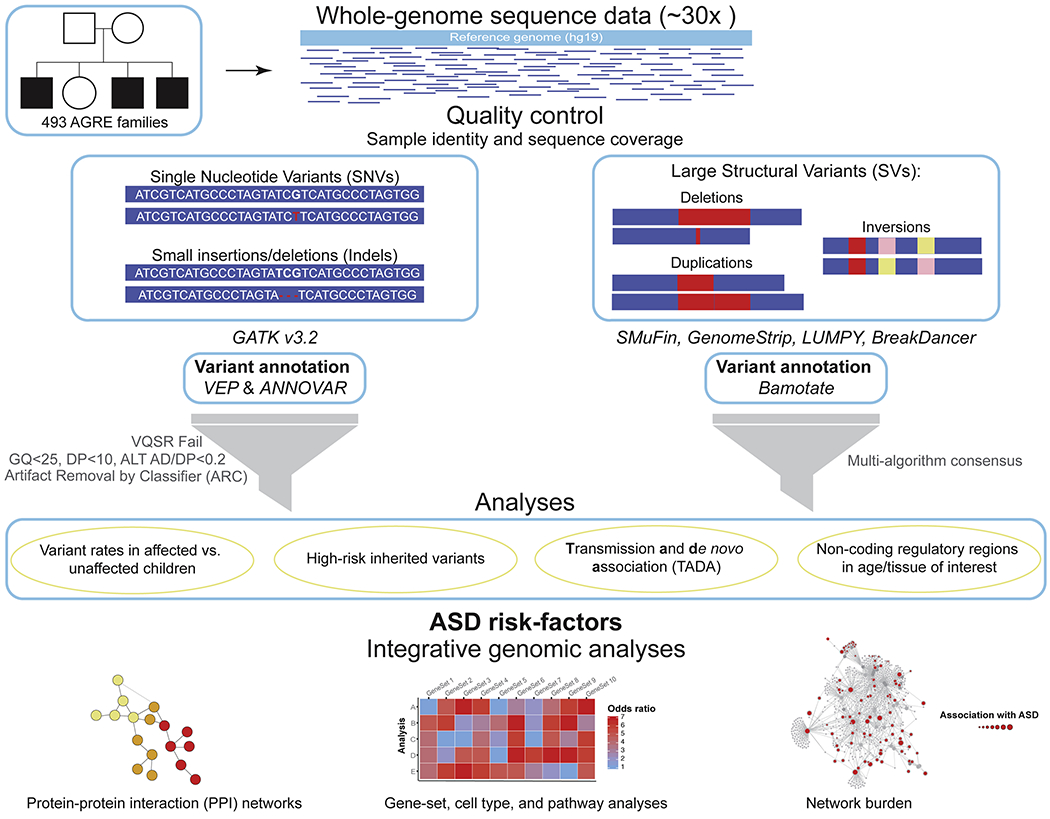
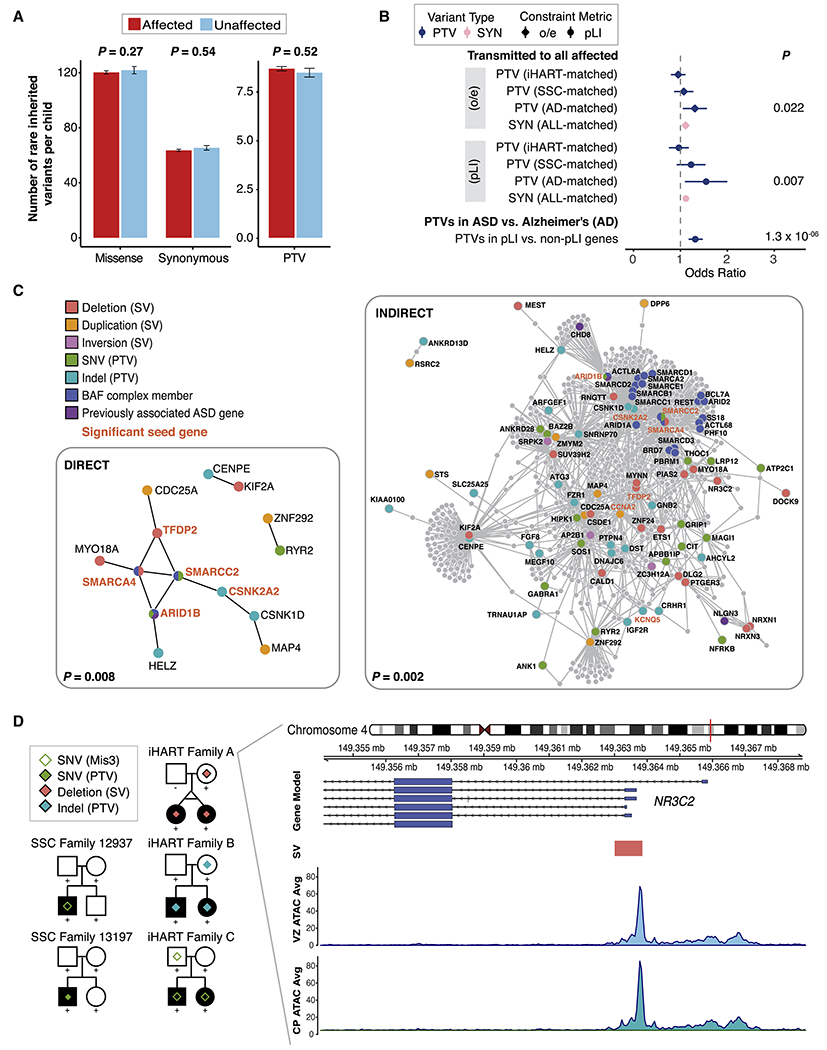
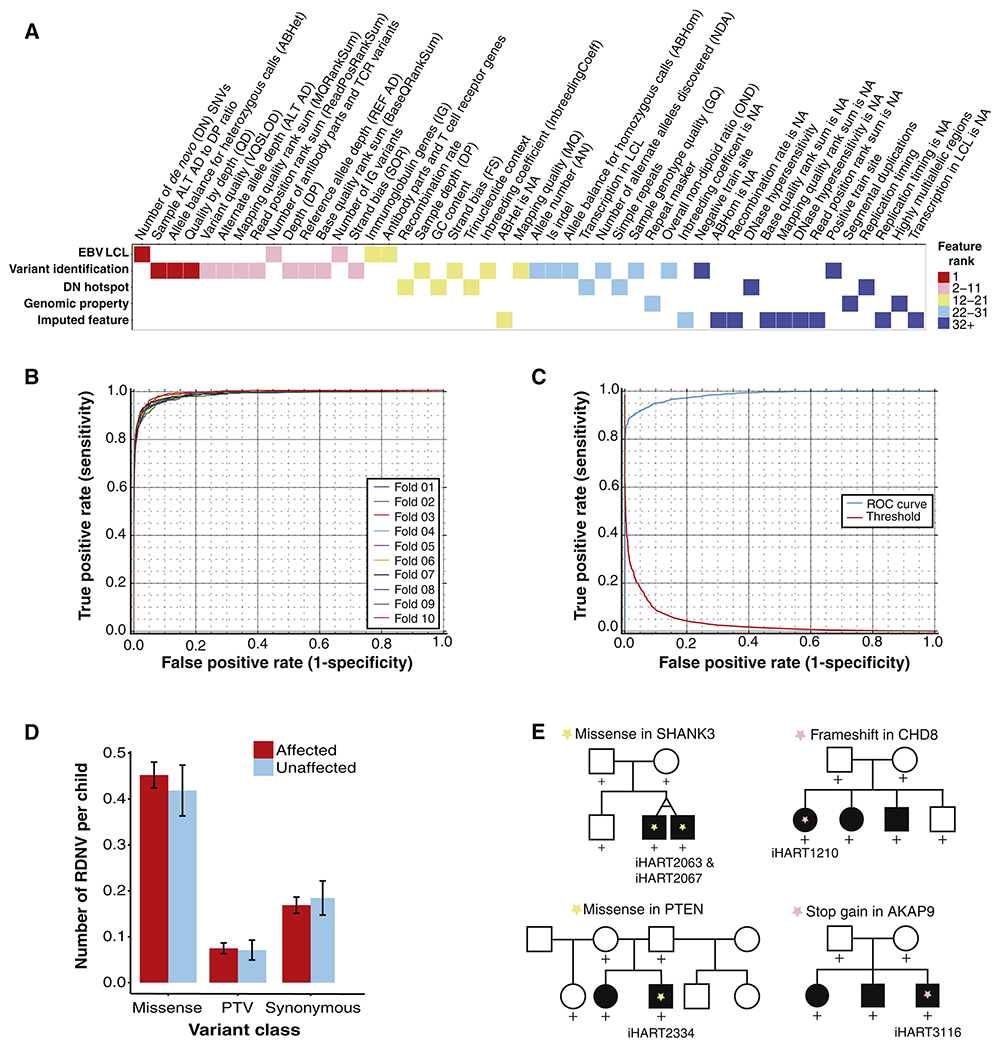
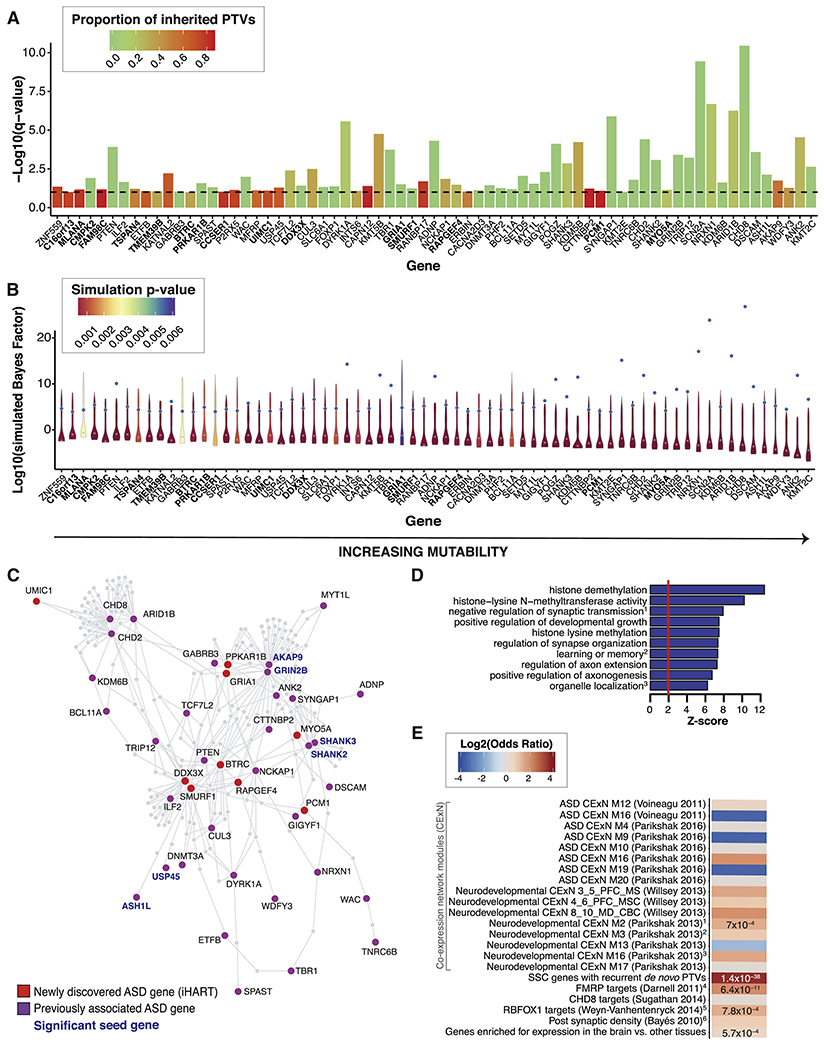
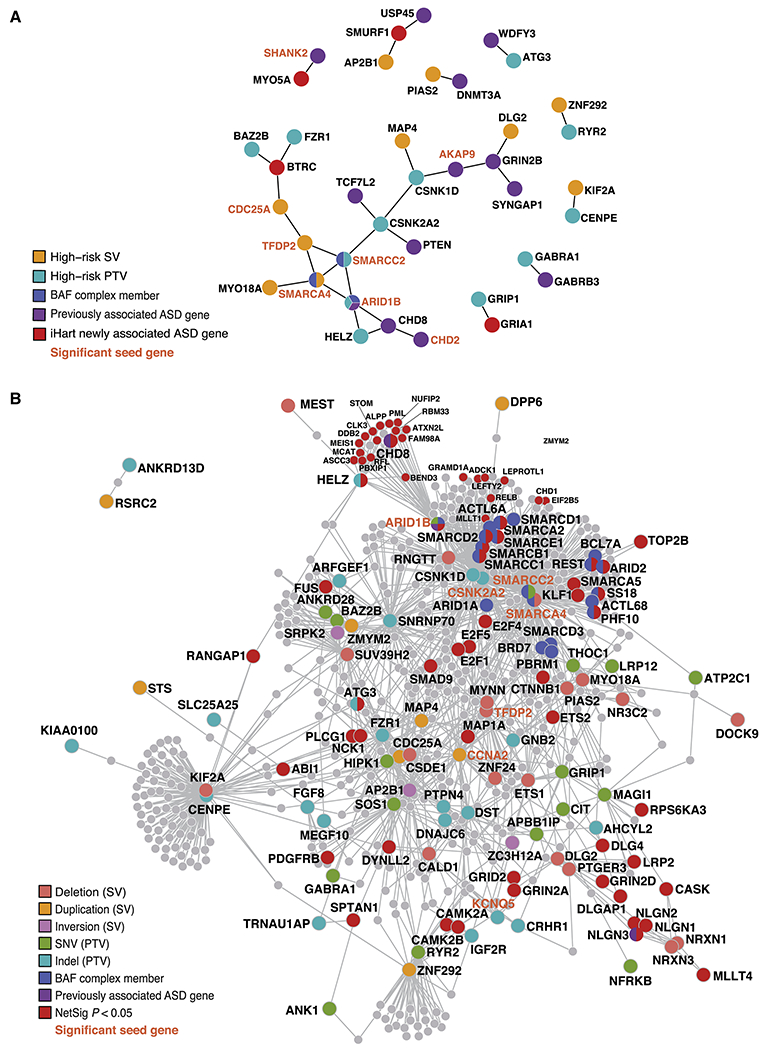
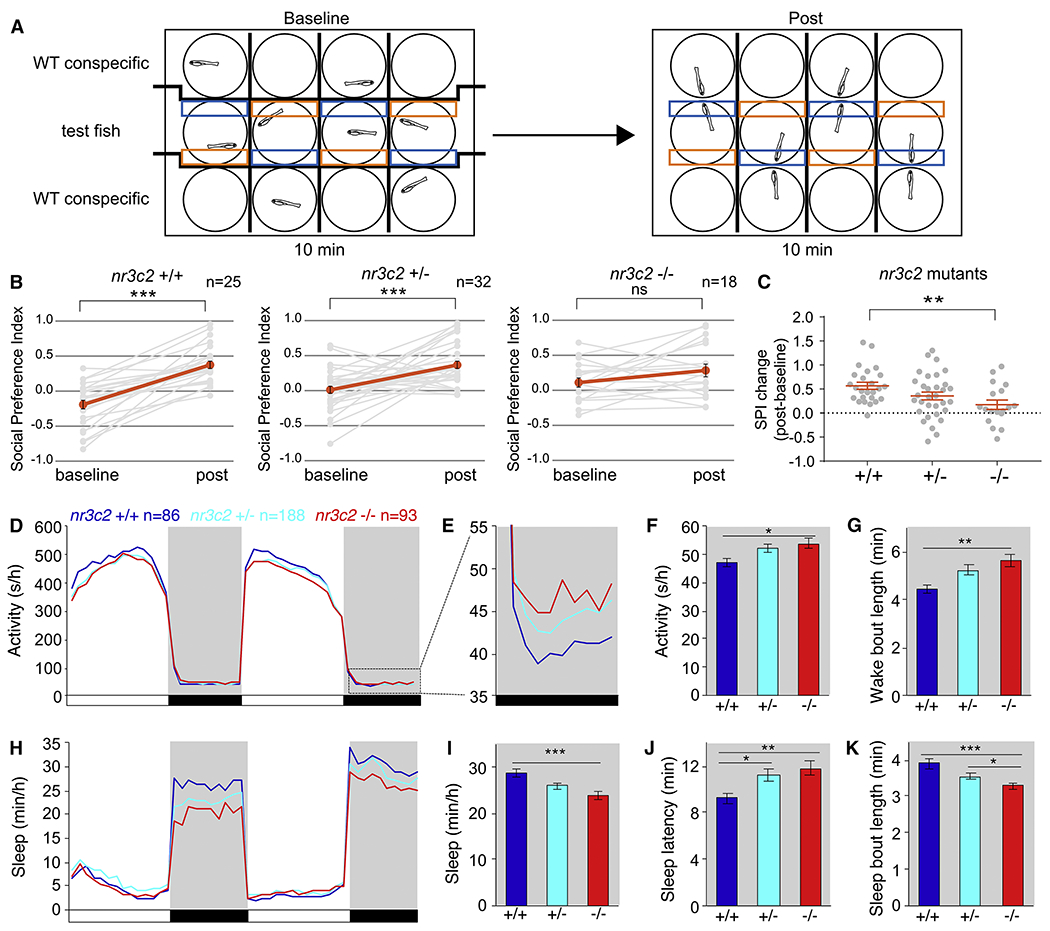
We performed a comprehensive assessment of rare inherited variation in autism spectrum disorder (ASD) by analyzing whole-genome sequences of 2,308 individuals from families with multiple affected children. We implicate 69 genes in ASD risk, including 24 passing genome-wide Bonferroni correction and 16 new ASD risk genes, most supported by rare inherited variants, a substantial extension of previous findings. Biological pathways enriched for genes harboring inherited variants represent cytoskeletal organization and ion transport, which are distinct from pathways implicated in previous studies. Nevertheless, the de novo and inherited genes contribute to a common protein-protein interaction network. We also identified structural variants (SVs) affecting non-coding regions, implicating recurrent deletions in the promoters of DLG2 and NR3C2. Loss of nr3c2 function in zebrafish disrupts sleep and social function, overlapping with human ASD-related phenotypes. These data support the utility of studying multiplex families in ASD and are available through the Hartwell Autism Research and Technology portal.

Keywords: ASD; autism; de novo; genetics; inherited; machine learning; multiplex families.


Conflict of interest statement

DECLARATION OF INTERESTS

The authors declare no competing interests.

Figures

Figure 1.
Figure 1.. Overview of the Analysis Pipeline.
High-coverage whole-genome sequence reads were aligned to the human reference genome (hg19) and quality control checks were applied to insure both sample identity and sequencing coverage (see Figure S1). SNVs and indels were called following GATK’s best practices; annotated using both VEP and ANNOVAR, and then filtered for mildly stringent quality thresholds. All de novo variants were classified by ARC and high-confidence variants were retained (see Figures 3 and S3–S4). Large SVs were identified by four different SV-detection algorithms, three of which used aligned sequence reads and one that performed de novo alignment (SMuFin). Large SVs were annotated using Bamotate and then filtered for high quality variants by using our multi-algorithm consensus pipeline. The resulting variants were then analyzed to identify ASD-risk factors and perform integrative genomic analyses.
Figure 2.
Figure 2.. Inherited ASD-risk genes.
(A) The number of rare inherited coding variants per fully phase-able child is displayed for 960 affected (red) and 217 unaffected (blue) children by variant consequence. Mean ± SE rates are shown. (B) Odds ratios from simulations of high-risk inherited PTV or SYN variants. Results are shown for constrained genes (gnomAD pLI score or gnomAD o/e score) and the cohort used for calculation of the null PTV or SYN rate is displayed (cohort-matched class rate). The odds ratio resulting from a Fisher’s exact test comparing the rate of PTVs in constrained vs. non-constrained genes in the iHART and SSC cohorts to that observed in the Alzheimer’s Disease cohort is also shown. Significant p-values are displayed. Whiskers represent 95% confidence intervals. (C) Direct and indirect PPI networks formed by constrained genes harboring PTVs or SVs (promoter or exon disrupting) transmitted to all affected and no unaffected children in a family. Proteins are colored according to the variant category of the variant identified in the high-risk inherited analysis, and previously known ASD-risk genes (Sanders et al., 2015) are shown in purple. Significant seed genes are bold and orange. P-values from 1,000 permutations. (D) Pedigrees for five ASD families with coding or regulatory NR3C2 variants. Square=male, circle=female, filled shape=individual with ASD, ‘+’=sequenced individual. Both SSC families harbor de novo variants in the proband (a PTV in SSC13197 and a probably damaging missense (Mis3, a “probably damaging” prediction by PolyPhen-2 (Adzhubei et al., 2010)) in SSC12937). iHART families A-C harbor rare inherited variants transmitted to both affected children; including a ~850bp deletion in family A, a PTV in family B, and a Mis3 variant in family C. The NR3C2 promoter-disrupting deletion (orange rectangle, chr4:149363005-149363852) overlaps a functional non-coding regulatory region in developing human brain (chr4:149362706-149367485) (de la Torre-Ubieta et al., 2018). The average ATAC-seq peak read depth from the cortical plate (CP) and ventricular zone (VZ) of developing human brain samples (n=3) are shown below the NR3C2 deletion.
Figure 3.
Figure 3.. Rare de novo variants in iHART.
(A) Heat map reflecting the importance ranking for all 48 ARC features, listed on the x-axis in order of rank and sorted by category (signatures of transformation of peripheral B lymphocytes by Epstein-Barr virus (EBV LCL), properties of variant identification, de novo hot spots, intrinsic genomic property, or imputed feature) on the y-axis. (B) ROC curves for 10-fold cross validation for the ARC training set; AUC=0.99. (C) ROC curve for the ARC test set; AUC=0.98. (D) Rate of RDNVs per child is displayed for 575 affected (red) and 141 unaffected (blue) children (716 fully phase-able samples after excluding MZ twins and ARC outliers) by variant consequence. Mean ± SE rates are shown. (E) Pedigrees for iHART families containing RDNVs in previously established ASD-risk genes. Children harboring the RDNV of interest are labeled with their iHART sample ID and a star symbol. The missense variants in SHANK3 and PTEN are predicted to damage the encoded protein (Mis3).
Figure 4.
Figure 4.. 69 ASD-risk genes identified by TADA mega-analysis.
(A,B) The 69 genes identified in the iHART TADA mega-analysis (FDR<0.1) are displayed in order of increasing gene mutability; the 16 novel genes are in bold. (A) The per-gene TADA FDR is displayed as a bar reaching the −log10(q-value). The dashed horizontal line marks the FDR=0.1 threshold. Bars are colored by the proportion of inherited PTVs for each gene (inherited PTVs/(inherited PTVs + de novo PTVs + de novo Mis3 + de novo small deletions)). (B) Violin plots of the simulated Bayes Factors (displayed as log(simulated Bayes Factor), 111 quantiles from the 1.1 million simulations) for each gene. The violin plots are colored by simulation p-value (max p-value=0.006). For each gene, the grey x indicates the median of the simulated Bayes Factors and the blue dot is the Bayes Factor obtained in the iHART TADA-mega analysis. The larger the distance between the median simulated Bayes Factor and the observed TADA-mega analysis Bayes Factor, the lower the probability of having achieved the observed Bayes Factor by chance. (C) Indirect PPI network formed by the 69 ASD-risk genes identified by TADA (FDR<0.1). Proteins encoded by previously known ASD-risk gene (Sanders et al., 2015)) are shown in purple and newly identified ASD-risk genes (iHART TADA-mega analysis) are shown in red. Gene labels for the six significant seed genes are bold and blue. (D) Gene-ontology enrichment for the 69 ASD-risk genes with known biological pathways. Three of the enriched pathways contain one or more of the 16 novel ASD-risk genes (any of the 69 genes in biological pathway are listed, with novel risk genes in bold): (1) negative regulation of synaptic transmission includes ADNP, SLC6A1, and RAPGEF4; (2) learning and memory includes ADNP, GRIA1, NRXN1, PRKAR1B, SLC6A1, and SYNGAP1; and (3) organelle organization includes MYO5A, PCM1, and TCF7L2. (E) Gene-set enrichment results for the 69 ASD-risk genes displayed by the log2(odds ratio), with p-values listed for gene sets surviving multiple test correction (P<0.002); the SSC gene set was included as a positive control. In addition to the gene set “genes enriched for expression in the brain vs. other tissues” which contains almost all of the 16 novel ASD-risk genes, six additional gene-sets contain one or more of the 16 novel ASD-risk genes: (1) TMEM39B and PCM1, (2) CCSER1 and UIMC1, (3) BTRC, PRKAR1B, and MYO5A, (4) RAPGEF4 and MYO5A, (5) BTRC, (6) DDX3X, GRIA1, RAPGEF4, and MYO5A.
Figure 5.
Figure 5.. PPI networks formed by ASD-risk genes.
(A,B) Proteins encoded by previously known ASD-risk genes (Sanders et al., 2015) are shown in purple, those belonging to the BAF complex are blue, and those belonging to more than one category are shown with all colors that apply. Gene labels for significant seed genes are bold and orange. (A) Direct PPI network formed by constrained genes harboring high-risk inherited variants (98 genes) and ASD-risk genes identified in the TADA mega-analysis (69 genes, FDR<0.1). The direct PPI network formed by these 165 unique genes is significant for three connectivity metrics: the direct edges count (P=0.036), the seed direct degrees mean (P=0.046), and the CI degrees mean (P=0.005). Proteins encoded by a gene with a high-risk inherited SV are shown in gold, those with PTVs are teal, and those that are a newly identified ASD-risk gene by the iHART TADA mega analysis are shown in red. (B) Indirect PPI networks seeded by genes harboring high-risk inherited variants (98 genes). Proteins are colored according to the variant class identified and NetSig significant genes (P<0.05) are shown in red.
Figure 6.
Figure 6.. nr3c2 mutant zebrafish exhibit impaired social preference behavior and disrupted sleep at night.
(A) Schematic of social preference behavioral assay. Boxes indicate regions used to quantify time spent by the test fish near (blue) and far (orange) from the conspecific. Thick lines indicate opaque dividers. (B) nr3c2 +/+ and nr3c2 +/− animals on average showed a significant preference for the conspecific but nr3c2 −/− animals did not. (C) The change in social preference index (SPI post – SPI baseline) was significantly smaller for nr3c2 −/− animals compared to their nr3c2 +/+ siblings. Grey data represent individuals. Red data indicate mean ± SEM. (D-K) Compared to their nr3c2 +/+ siblings at night, nr3c2 −/− animals were 14% more active (D-F) and slept 17% less (H,I) due to 27% longer wake bouts (G) and 16% shorter sleep bouts (K). nr3c2 −/− animals also showed a 28% longer sleep latency (time to first sleep bout at night) (J). There was no difference among the three genotypes in the number of sleep bouts at night or in any of these measures during the day (data not shown). Boxed region in (D) is magnified in (E). White and black bars indicate day (14 h) and night (10 h). Grey shading indicates night. Line graphs show mean and bar graphs show mean ± SEM for 5 pooled experiments. n=number of animals. *P<0.05; **P<0.01; ***P<0.001, ns=not significant by paired t test (B), one-way ANOVA with Tukey’s HSD post-hoc test (C), or one-way ANOVA with Holm-Sidak post-hoc test (F,G,I-K). See also Figure S7.

References

    1. Adzhubei IA, Schmidt S, Peshkin L, Ramensky VE, Gerasimova A, Bork P, Kondrashov AS, and Sunyaev SR (2010). A method and server for predicting damaging missense mutations. Nature methods 7, 248–249. - PMC - PubMed
    1. American Psychiatric Association; (2013). Diagnostic and Statistical Manual of Mental Disorders, 5th edn (Arlington, Virginia, USA: ).
    1. An JY, Lin K, Zhu L, Werling DM, Dong S, Brand H, Wang HZ, Zhao X, Schwartz GB, Collins RL, et al. (2018). Genome-wide de novo risk score implicates promoter variation in autism spectrum disorder. Science (New York, NY) 362. - PMC - PubMed
    1. Auton A, Brooks LD, Durbin RM, Garrison EP, Kang HM, Korbel JO, Marchini JL, McCarthy S, McVean GA, and Abecasis GR (2015). A global reference for human genetic variation. Nature 526, 68–74. - PMC - PubMed
    1. Bacchelli E, Blasi F, Biondolillo M, Lamb JA, Bonora E, Barnby G, Parr J, Beyer KS, Klauck SM, Poustka A, et al. (2003). Screening of nine candidate genes for autism on chromosome 2q reveals rare nonsynonymous variants in the cAMP-GEFII gene. Molecular psychiatry 8, 916–924. - PubMed

Publication types

MeSH terms