. 2019 Aug 8;178(4):867-886.e24.
doi: 10.1016/j.cell.2019.07.024.

Targeting Peripheral Somatosensory Neurons to Improve Tactile-Related Phenotypes in ASD Models

Affiliations

Targeting Peripheral Somatosensory Neurons to Improve Tactile-Related Phenotypes in ASD Models

Lauren L Orefice et al. Cell. .

Abstract

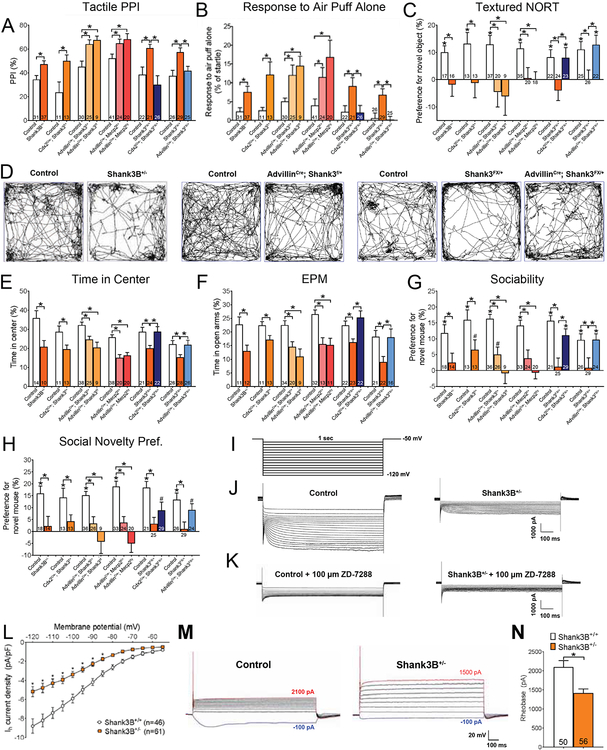
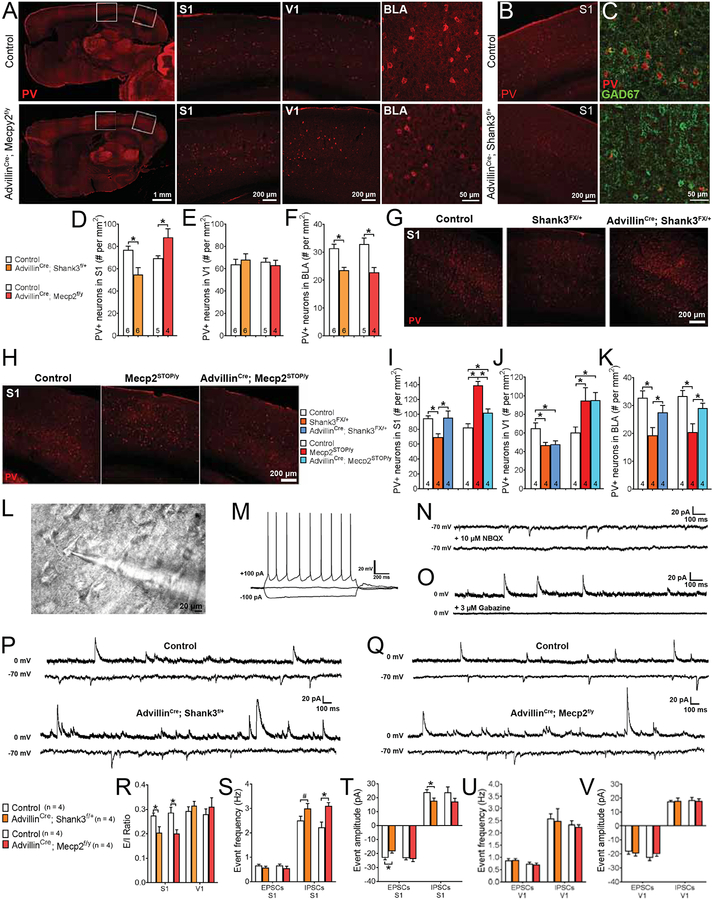
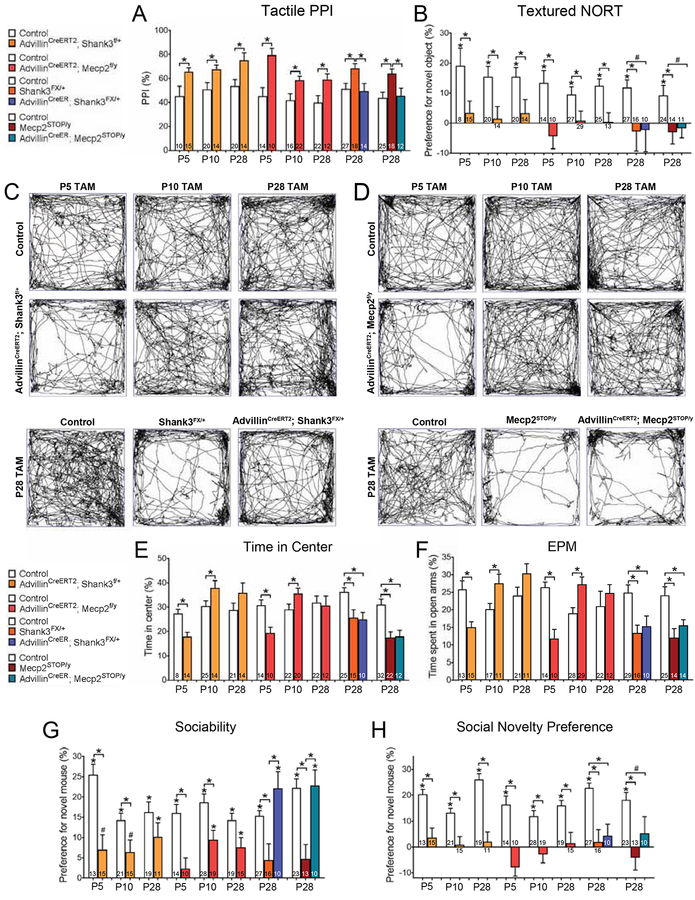
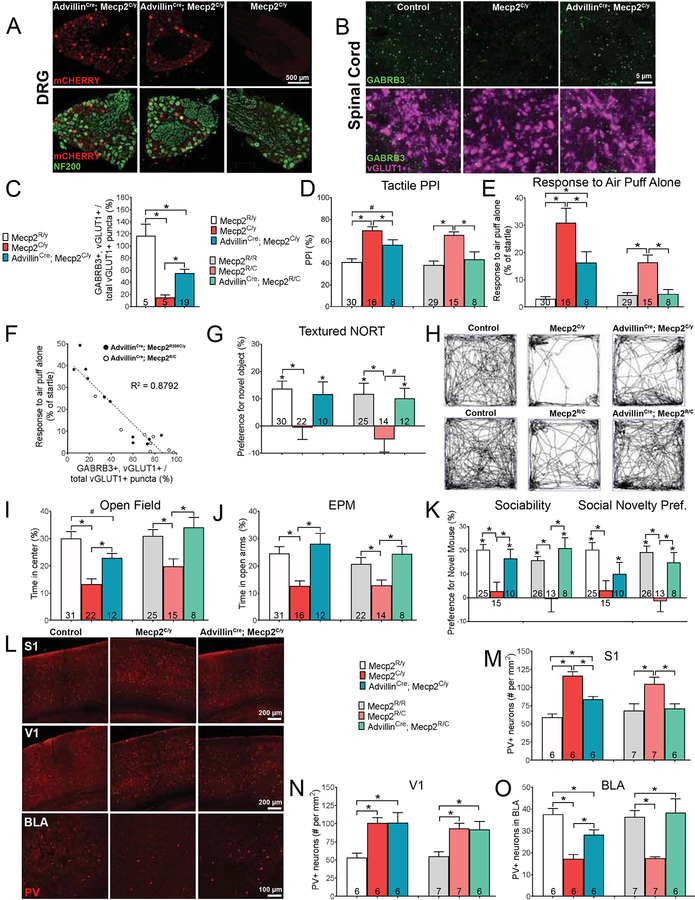
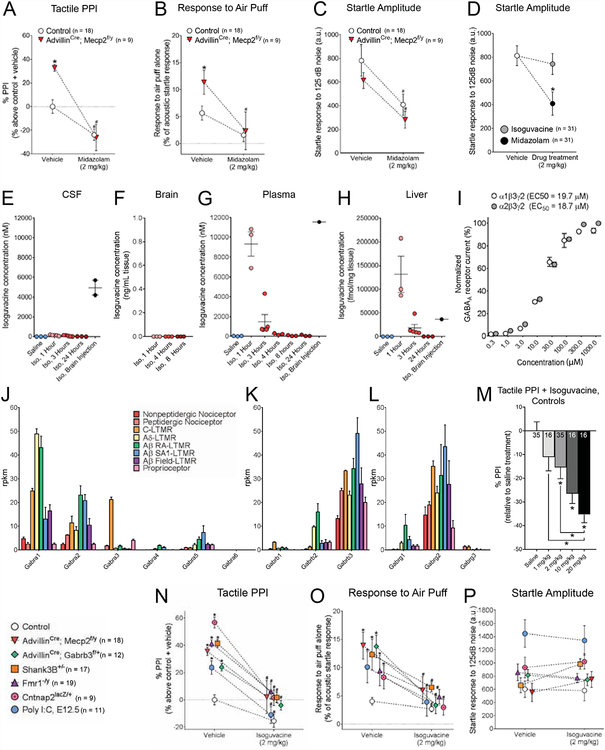
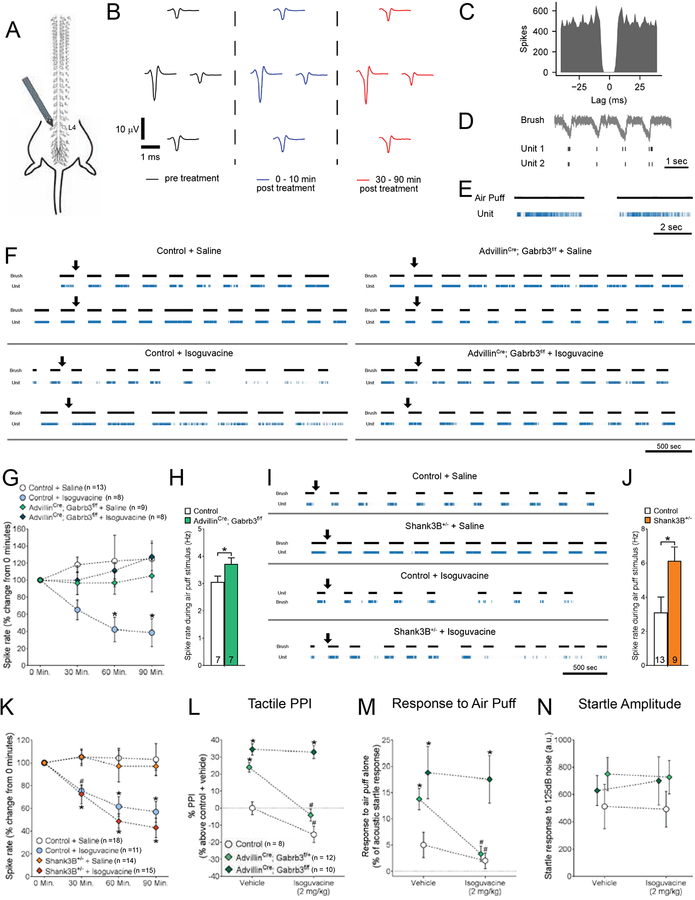
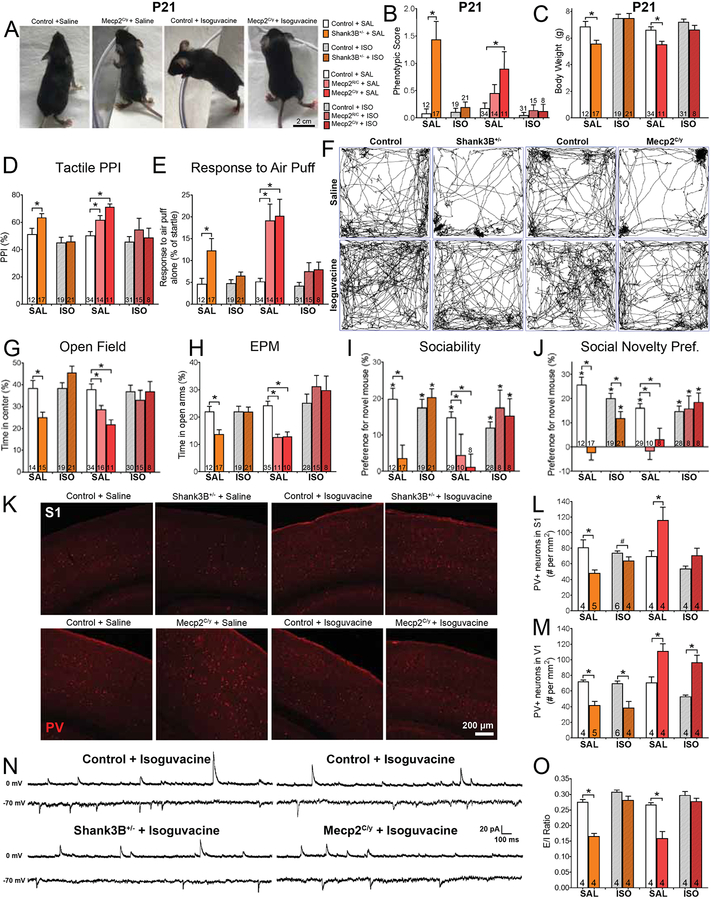
Somatosensory over-reactivity is common among patients with autism spectrum disorders (ASDs) and is hypothesized to contribute to core ASD behaviors. However, effective treatments for sensory over-reactivity and ASDs are lacking. We found distinct somatosensory neuron pathophysiological mechanisms underlie tactile abnormalities in different ASD mouse models and contribute to some ASD-related behaviors. Developmental loss of ASD-associated genes Shank3 or Mecp2 in peripheral mechanosensory neurons leads to region-specific brain abnormalities, revealing links between developmental somatosensory over-reactivity and the genesis of aberrant behaviors. Moreover, acute treatment with a peripherally restricted GABAA receptor agonist that acts directly on mechanosensory neurons reduced tactile over-reactivity in six distinct ASD models. Chronic treatment of Mecp2 and Shank3 mutant mice improved body condition, some brain abnormalities, anxiety-like behaviors, and some social impairments but not memory impairments, motor deficits, or overgrooming. Our findings reveal a potential therapeutic strategy targeting peripheral mechanosensory neurons to treat tactile over-reactivity and select ASD-related behaviors.

Keywords: ASD therapeutics; GABA; autism spectrum disorders; brain development; mechanosensation; mouse genetics.


Conflict of interest statement

Declaration of Interests

LLO and DDG have patents pending on the use of peripherally restricted GABAA receptor drugs for the treatment of tactile over-reactivity in ASD and other disorders.

Figures

Figure 1.
Figure 1.. Shank3 functions cell-autonomously in peripheral somatosensory neurons for normal innocuous touch behaviors.
(A) Hairy skin sensitivity was measured using tactile PPI. Percent inhibition of the startle response to a 125 dB noise, when the startle noise is preceded by a light air puff (250 ms ISI). Student’s unpaired t-test or one-way ANOVA with post-hoc Tukey’s test, *, p < 0.05. (B) Response to a light air puff stimulus alone directed to the back hairy skin. Responses are expressed as percent of startle response to a 125 dB noise. Student’s unpaired t-test or one-way ANOVA with post-hoc Tukey’s test, *, p < 0.05. (C) Texture discrimination was measured using the textured NORT behavioral assay. A positive value indicates preference for the novel object, compared to the familiar object. Student’s unpaired t-test or one-way ANOVA with post-hoc Tukey’s test, *, p < 0.05. (D) Open field (OF) test was used as a general measure of exploration and anxiety-like behavior. Shown are representative activity traces in the OF test for mutant mice and control littermates. (E) Percent time spent in the center of the OF chamber. Student’s unpaired t-test or one-way ANOVA with post-hoc Tukey’s test, *, p < 0.05. (F) Percent time spent in the open arms of the EPM. Student’s unpaired t-test or one-way ANOVA with post-hoc Tukey’s test, *, p < 0.05. (G) Preference index for the percentage of time spent investigating a novel mouse, compared to a novel object, in the “Sociability” portion of the 3-chamber social interaction test. Student’s unpaired t-test or one-way ANOVA with post-hoc Tukey’s test, *, p < 0.05; #, p < 0.10. (H) Preference index for the percentage of time spent investigating a novel mouse, compared to a familiar mouse, in the “Social Novelty Preference” portion of the 3-chamber social interaction test. Student’s unpaired t-test or one-way ANOVA with post-hoc Tukey’s test, *, p < 0.05; #, p < 0.10. (I) Voltage step protocol used to activate HCN channels and elicit Ih during whole-cell voltage clamp recordings. (J-K) Representative electrophysiological traces showing Ih during a hyperpolarizing voltage step protocol in large diameter DRG neurons cultured control and Shank3B+/− mutant mice, at baseline (K) and with a selective HCN-channel blocker, ZD-7288 (L). (L) Quantification of Ih density at each voltage step for large diameter neurons cultured from DRGs of control and mutant mice. Two-way ANOVA with post-hoc Sidak’s test, [F (1,1470) =187.7; P < 0.0001] *, p < 0.05. (M) Representative traces from large diameter DRG neurons cultured from control and Shank3B+/− mutant mice during whole cell current clamp recordings, in which the minimal amount of current required to elicit an action potential in each neuron (rheobase, Rh), was determined. (N) Quantification of average R in large diameter DRG neurons cultured from control and Shank3B+/− mutant mice. Student’s unpaired t-test, *, p < 0.005.
Figure 2.
Figure 2.. Loss of either Shank3 or Mecp2 in peripheral somatosensory neurons leads to abnormal brain interneuron development and microcircuit properties in a region-specific manner.
(A) Representative immunohistochemistry (IHC) images of parvalbumin (PV) immunoreactivity in control or AdvillinCre; Mecp2f/y mutant mice, showing full sagittal brain sections and corresponding magnified sections of primary somatosensory cortex (S1) and primary visual cortex (V1), or coronal sections of basolateral amygdala (BLA). (B) Representative IHC images of coronal brain sections, showing PV immunoreactivity in control or AdvillinCre; Shank3f/+ mutant mice. (C) Representative IHC images of coronal S1 brain sections, showing PV and GAD67 immunoreactivity in control or AdvillinCre; Shank3f/+ mutant mice. (D-F) Quantification of the number of PV-positive (PV+) neurons in S1 (D), V1 (E), and BLA (F) in mutant mice and their control littermates. Student’s unpaired t-test, *, p < 0.05. (G) Representative IHC images of coronal S1 brain sections, showing PV immunoreactivity in control, Shank3FX/+, or AdvillinCre; Shank3FX/+ mutant mice. (H) Representative IHC images of coronal S1 brain sections, showing PV immunoreactivity in control, Mecp2STOP/y, or AdvillinCre; Mecp2STOP/y mutant mice. (I-K) Quantification of the number of PV+ neurons in S1 (I), V1 (J), and BLA (K) in mutant mice and their control littermates. One-way ANOVA with post-hoc Tukey’s test, *, p < 0.05; #, p < 0.10. (L) Example image of a coronal S1 slice with a layer 2/3 pyramidal neuron in whole cell patch clamp recording configuration. (M) Example firing pattern of a layer 2/3 pyramidal neuron in whole cell patch clamp recording configuration during current injection steps. (N) Example traces from a layer 2/3 pyramidal neuron showing spontaneous excitatory postsynaptic currents (sEPSCs) in normal bath solution or following application of NBQX (10 μM) to block AMPA receptors. (O) Example traces from a layer 2/3 pyramidal neuron showing spontaneous inhibitory postsynaptic currents (sIPSCs) in normal bath solution or following application of gabazine (3 μM) to block GABAA receptors. (P) Representative traces showing sEPSCS (−70 mv hold) and sIPSCs (0 mV hold) from S1 slices of control or AdvillinCre; Shank3f/+ mutant mice. (Q) Representative traces showing sEPSCs (−70 mv hold) and sIPSCs (0 mV hold) from S1 slices of control or AdvillinCre; Mecp2f/y mutant mice. (R) Quantification of excitatory/inhibitory (E/I) ratios in S1 or V1 slices from control and mutant mice. Two-way ANOVA with post-hoc Sidak’s test, *, p < 0.05. (S-T) Quantification of sEPSC and sIPSC event frequency (S) and event amplitude (T) in S1 slices from control and mutant mice. Two-way ANOVA with post-hoc Sidak’s test, *, p < 0.05; #, p < 0.10. (U-V) Quantification of sEPSC and sIPSC event frequency (U) and event amplitude (V) in V1 slices from control and mutant mice. Two-way ANOVA with post-hoc Sidak’s test, *, p < 0.05.
Figure 3.
Figure 3.. Normal tactile sensitivity is necessary during early postnatal periods for normal brain development and behavior.
(A) Percent inhibition of the startle response to a 125 dB noise, when the startle noise is preceded by a light air puff in mutant mice and control littermates. Student’s unpaired t-test or one-way ANOVA with post-hoc Tukey’s test, *, p < 0.05. For experiments shown in this figure, tamoxifen was administered to all littermates, over a five-day period, beginning on the day noted for each condition. For all behavioral experiments in this figure, animals began testing at P42. (B) Discrimination index for textured NORT. Student’s unpaired t-test or one-way ANOVA with post-hoc Tukey’s test, *, p < 0.05. (C) Representative activity traces in the OF test for Shank3 mutant mice and control littermates. Tamoxifen (TAM) was administered over a five-day period, beginning on the day noted for each condition. (D) Representative activity traces in the OF test for Mecp2 mutant mice and control littermates. (E) Percent time spent in the center of the OF chamber. Student’s unpaired t-test or one-way ANOVA with post-hoc Tukey’s test, *, p < 0.05. (F) Percent time spent in the open arms of the EPM. Student’s unpaired t-test or one-way ANOVA with post-hoc Tukey’s test, *, p < 0.05. (G-H) Preference index for the percentage of time spent investigating the novel mouse in the “Sociability” (G) and “Social Novelty Preference” (H) portions of the 3-chamber social interaction test. Student’s unpaired t-test or one-way ANOVA with post-hoc Tukey’s test, *, p < 0.05; #, p < 0.10.
Figure 4.
Figure 4.. Viral expression of GABRB3 in peripheral sensory neurons, beginning at P5, improves some tactile, brain and behavioral deficits observed in Mecp2R306C mutant mice.
(A) Intraperitoneal (i.p.) injection of AAV.FLEx.GABRB3.mCHERRY into AdvillinCre; Mecp2C/y hemizygous null mutant mice at P5 transduces peripheral sensory neurons, as evidenced by immunoreactivity for mCHERRY. Transduced large diameter neurons are immunoreactive for both mCHERRY and NF200. All littermates received i.p. injection of AAV.FLEx.GABRB3.mCHERRY at P5. (B) IHC images of spinal cord (SC) dorsal horn lamina III/IV from male control, Mecp2C/y or AdvillinCre; Mecp2C/y mice, showing GABRB3 puncta at vGLUT1+ presynaptic terminals for Aα and Aδ LTMRs. (C) Quantification of vGLUT1+ puncta co-labeled with GABRB3, relative to the total number of vGLUT1+ puncta visualized per image of SC dorsal horn. One-way ANOVA with post-hoc Tukey’s test, *, p < 0.01. (D) Percent inhibition of the startle response to a 125 dB noise, when the startle noise is preceded by a light air puff in male control, Mecp2C/y, AdvillinCre; Mecp2C/y or female control, Mecp2R/C, and AdvillinCre; Mecp2R/C mice. One-way ANOVA with post-hoc Tukey’s test, *, p < 0.05; #, p < 0.10. (E) Response to a light air puff stimulus alone. Responses are expressed as percent of startle response to a 125 dB noise. One-way ANOVA with post-hoc Tukey’s test, *, p < 0.05. (F) The percentage of vGLUT1+ puncta co-labeled with GABRB3, relative to the total number of vGLUT1+ puncta is negatively correlated with hairy skin sensitivity. Comparison of individual animals’ expression levels of GABRB3 at vGLUT1+ terminals, to their responses to a light air puff stimulus (50 ms, 0.9 PSI). Linear regression analysis, R2 = 0.8792. (G) Discrimination index for textured NORT. Student’s unpaired t-test or one-way ANOVA with post-hoc Tukey’s test, *, p < 0.05; #, p < 0.10. (H) Representative activity traces in the OF test. (I) Percent time spent in the center of the OF chamber. One-way ANOVA with post-hoc Tukey’s test, *, p < 0.05; #, p < 0.10. (J) Percent time spent in the open arms of the EPM. One-way ANOVA with post-hoc Tukey’s test, *, p < 0.05. (K) Preference index for the percentage of time spent investigating the novel mouse in the “Sociability” or “Social Novelty Preference” portion of the 3-chamber social interaction test. One-way ANOVA with post-hoc Tukey’s test, *, p < 0.05. (L) Representative IHC images of coronal S1, V1 and BLA brain sections, showing PV immunoreactivity in control, Mecp2C/y or AdvillinCre; Mecp2C/y mice. (M-O) Quantification of the number of PV-positive (PV+) neurons in S1 (M), V1 (N), and BLA (O) in mutant, mutant rescues and their control littermates. One-way ANOVA with post-hoc Tukey’s test, *, p < 0.05.
Figure 5.
Figure 5.. Acute administration of the peripherally-restricted GABAA receptor agonist isoguvacine improves tactile hypersensitivity in five genetic and one environmental model for ASD.
(A) Percent inhibition of the startle response to a 125 dB noise, when the startle noise is preceded by a light air puff in mice following i.p. administration of either saline or 2 mg/kg midazolam treatment. Two-way ANOVA with post-hoc Sidak’s test, *, p < 0.05. (B) Response to a light air puff stimulus alone in mice following i.p. administration of either saline or 2 mg/kg midazolam treatment. Responses are expressed as percent of startle response to a 125 dB noise. Two-way ANOVA with post-hoc Sidak’s test, *, p < 0.05 for comparisons between mutant group with saline to control littermates with saline; #, p < 0.05, for comparisons between mutant group with saline to same mutant group with isoguvacine. (C) Magnitude of startle response to a 125 dB noise in mice following i.p. administration of either saline or 2 mg/kg midazolam treatment. Two-way ANOVA with post-hoc Sidak’s test, *, p < 0.05 for comparisons between mutant group with saline to control littermates with saline; #, p < 0.05, for comparisons between mutant group with saline to same mutant group with isoguvacine. (D) Magnitude of startle response to a 125 dB noise in control mice following i.p. administration of saline, midazolam (2mg/kg) or a peripherally-restricted GABAA receptor agonist, isoguvacine (2 mg/kg). Two-way ANOVA with post-hoc Sidak’s test, *, p < 0.05. (E-H) Liquid chromatography mass spectrometry (LC-MS) quantified isoguvacine concentrations in cerebrospinal fluid (CSF) (E), brain homogenate (F), plasma (G) or liver (H) samples of mice treated with: i.p. saline, i.p. isoguvacine (“Iso.”, 20 mg/kg, samples collected multiple time points post-injection), or intracerebral injection isoguvacine (20 mg/kg, 1 hour post-injection). (I) Normalized peak chloride flux through α1β3γ2- and α2β3γ2-containing GABAA receptors in response to isoguvacine application. Response data has been normalized to the baseline peak current induced by addition of EC100 GABA (30μM) for 2 seconds during the assay (J-L) GABAA receptor subunit RNA expression levels across peripheral somatosensory neuron subtypes, for the alpha (I), beta (J), and gamma (K) subunit types. (M) Percent inhibition of the startle response to a 125 dB noise, when the startle noise is preceded by a light air puff in control mice following i.p. administration of saline or isoguvacine at a range of concentrations. One-way ANOVA with post-hoc Sidak’s test [F (4, 113) = 8.005, P < 0.0001], above bars: *, p < 0.05 for comparisons between saline to each isoguvacine concentration; above brackets: *, p < 0.05, for comparisons between indicated conditions. (N) Percent inhibition of the startle response to a 125 dB noise, when the startle noise is preceded by a light air puff in mice following i.p. administration of either saline or 2 mg/kg isoguvacine. Two-way ANOVA with post-hoc Sidak’s test [F (7,277) = 16.44, P < 0.0001], *, p < 0.05 for comparisons between mutant group with saline to control littermates with saline; #, p < 0.05, for comparisons between mutant condition with saline to same mutant group with isoguvacine. (O) Response to a light air puff stimulus alone in mice following i.p. administration of either saline or 2 mg/kg isoguvacine treatment. Responses are expressed as percent of startle response to a 125 dB noise. Two-way ANOVA with post-hoc Sidak’s test [F (7,277) = 9.650, P < 0.0001], *, p < 0.05 for comparisons between mutant group with saline to control littermates with saline; #, p < 0.05, for comparisons between mutant condition with saline to same mutant group with isoguvacine. (P) Magnitude of startle response to a 125 dB noise in mice following i.p. administration of either saline or 2 mg/kg isoguvacine treatment.
Figure 6.
Figure 6.. Isoguvacine attenuates tactile sensitivity through reduced excitability of peripheral, low-threshold mechanosensory neurons.
(A) Diagram for in vivo dorsal root ganglion (DRG) multi-unit electrode recordings, showing tetrode placement into the left L4 ganglia. (B) Example single unit identified during the spike sorting process. Average waveform at each electrode site. (C) Example inter-spike interval for a single unit identified during the spike sorting process. (D) Activity traces of two putative single units in response to a brush stimulus. (E) Activity traces of a putative single unit in response to a light air puff stimulus (1 PSI). (F) Representative activity raster plots for multiple putative LTMRs in multiple mice over the duration of a recording experiment in controls and AdvillinCre; Gabrb3f/f mice. Mice received a subcutaneous injection of either saline or isoguvacine (2 mg/kg) during the experiment, and activity of light-touch responsive units in response to a light brush stimulus was assessed over a 90-minute period. Arrows indicate time of injection. (G) Relative firing frequency of LTMRs in response to a brush stimulus over the duration of each recording experiment, following subcutaneous injection of either saline or isoguvacine (2 mg/kg). Repeated measures, two-way ANOVA with post-hoc Dunnett’s test [F (3,136) = 9.326, P < 0.0001], *p < 0.05. (H) Average baseline spike rate of LTMRs in response to an air puff stimulus (1 PSI), in control and AdvillinCre; Gabrb3f/f mice. Student’s t-test, *p = 0.490. (I) Representative activity raster plots for putative LTMRs in multiple mice over the duration of recordings in controls and Shank3B+/− mice. Mice received a subcutaneous injection of either saline or isoguvacine (2 mg/kg) during the experiment, and activity of light-touch responsive units was assessed over a 90-minute period. Arrows indicate time of injection. (J) Average baseline spike rate of LTMRs in response to an air puff stimulus (1 PSI), in control and Shank3B+/− mice. Student’s t-test, *p = 0.0291. (K) Relative firing frequency of LTMRs in response to a brush stimulus over the duration of each recording experiment, following subcutaneous injection of either saline or isoguvacine (2 mg/kg). Repeated measures, two-way ANOVA with post-hoc Dunnett’s test [F (3, 216) = 22.69, P < 0.0001], *p < 0.05. (L) Percent inhibition of the startle response to a 125 dB noise, when the startle noise is preceded by a light air puff in control, AdvillinCre; Gabrb3f/+ and AdvillinCre; Gabrb3f/f mice following i.p. administration of 2 mg/kg isoguvacine (i.p., 2 mg/kg). Two-way ANOVA with post-hoc Sidak’s test, *, p < 0.05 for comparisons between mutant group to control littermates with saline; #, p < 0.05, for comparisons between mutant condition with saline to same mutant group with isoguvacine. (M) Response to a light air puff stimulus alone in mice following i.p. administration of either saline or 2 mg/kg isoguvacine treatment. Responses are expressed as percent of startle response to a 125 dB noise. Two-way ANOVA with post-hoc Sidak’s test, *, p < 0.05 for comparisons between mutant group to control littermates with saline; #, p < 0.05, for comparisons between mutant condition with saline to same mutant group with isoguvacine. (N) Magnitude of startle response to a 125 dB noise in mice following i.p. administration of either saline or 2 mg/kg isoguvacine treatment. Two-way ANOVA with post-hoc Sidak’s test, *, p < 0.05.
Figure 7.
Figure 7.. Chronic administration of isoguvacine improves tactile over-reactivity, region-selective cortical abnormalities, and some ASD-related behaviors in Mecp2 and Shank3 mutant mice.
(A) Representative images of P21 control and Mecp2C/y mutant mice treated daily from P1–21 with either saline or isoguvacine (2 mg/kg). (B) Average phenotypic score of P21 Shank3B+/− or Mecp2C/y mutant mice and control littermates treated daily with either saline or isoguvacine (2 mg/kg). One-way ANOVA with post-hoc Tukey’s test, *, p < 0.05. (C) Average bodyweight of P21 Shank3B+/− or Mecp2C/y mutant mice and control littermates treated daily with either saline or isoguvacine (2 mg/kg). One-way ANOVA with post-hoc Tukey’s test, *, p < 0.05. (D) Percent inhibition of the startle response to a 125 dB noise, when the startle noise is preceded by a light air puff in Shank3B+/−, Mecp2R/C or Mecp2C/y mutant mice and control littermates treated daily from P1–42 with either saline or isoguvacine (2 mg/kg). One-way ANOVA with post-hoc Tukey’s test, *, p < 0.05. (E) Response to a light air puff stimulus alone in Shank3B+/−, Mecp2R/C or Mecp2C/y mutant mice and control littermates treated daily from P1–42 with either saline or isoguvacine (2 mg/kg). One-way ANOVA with post-hoc Tukey’s test, *, p < 0.05. (F) Representative activity traces in the OF test. (G) Percent time spent in the center of the OF chamber. One-way ANOVA with post-hoc Tukey’s test, *, p < 0.05. (H) Percent time spent in the open arms of the EPM. One-way ANOVA with post-hoc Tukey’s test, *, p < 0.05. (I-J) Preference index for the percentage of time spent investigating the novel mouse in the “Sociability” (I) or “Social Novelty Preference” (J) portion of the 3-chamber social interaction test. One-way ANOVA with post-hoc Tukey’s test, *, p < 0.05. (K) Representative IHC images of coronal S1 brain sections, showing PV immunoreactivity in Shank3B+/− or Mecp2C/y mutant mice and control littermates treated daily from P1–42 with either saline or isoguvacine (2 mg/kg). (L-M) Quantification of the number of PV-positive (PV+) neurons in S1 (L) and V1 (M). One-way ANOVA with post-hoc Tukey’s test, *, p < 0.05. (N) Representative traces showing sEPSCS (−70 mv hold) and sIPSCs (0 mV hold) from S1 slices from Shank3B+/− or Mecp2C/y mutant mice and control littermates treated daily from P1–42 with either saline or isoguvacine (2 mg/kg). (O) Quantification of excitatory/inhibitory (E/I) ratio in S1 slices from control and mutant mice. Two-way ANOVA with post-hoc Sidak’s test, *, p < 0.05.

Comment in

  • A Light Touch on Sociability.
    Domínguez-Iturza N, Bagni C. Domínguez-Iturza N, et al. Cell. 2019 Aug 8;178(4):769-771. doi: 10.1016/j.cell.2019.07.022. Cell. 2019. PMID: 31398332

References

    1. Akyol A, Hinoi T, Feng Y, Bommer GT, Glaser TM, and Fearon ER (2008). Generating somatic mosaicism with a Cre recombinase-microsatellite sequence transgene. Nature methods 5, 231–233. - PMC - PubMed
    1. Antoine MW, Langberg T, Schnepel P, and Feldman DE (2019). Increased Excitation-Inhibition Ratio Stabilizes Synapse and Circuit Excitability in Four Autism Mouse Models. Neuron 101, 648–661 e644. - PMC - PubMed
    1. Baio J, Wiggins L, Christensen DL, Maenner MJ, Daniels J, Warren Z, Kurzius-Spencer M, Zahorodny W, Robinson Rosenberg C, White T, et al. (2018). Prevalence of Autism Spectrum Disorder Among Children Aged 8 Years - Autism and Developmental Disabilities Monitoring Network, 11 Sites, United States, 2014. MMWR Surveill Summ 67, 1–23. - PMC - PubMed
    1. Bakker CE, Verheij C, Willemsen R, van der Helm R, Oerlemans F, Vermey M, Bygrave A, Hoogeveen AT, and Oostra BA (1994). Fmr1 knockout mice: a model to study fragile X mental retardation. The Dutch-Belgian Fragile X Consortium. Cell 78, 23–33. - PubMed
    1. Bhattacherjee A, Mu Y, Winter MK, Knapp JR, Eggimann LS, Gunewardena SS, Kobayashi K, Kato S, Krizsan-Agbas D, and Smith PG (2017). Neuronal cytoskeletal gene dysregulation and mechanical hypersensitivity in a rat model of Rett syndrome. Proceedings of the National Academy of Sciences of the United States of America 114, E6952–E6961. - PMC - PubMed

Publication types

MeSH terms