. 2019 Aug 8;178(4):933-948.e14.
doi: 10.1016/j.cell.2019.07.019.

Opposing Functions of Interferon Coordinate Adaptive and Innate Immune Responses to Cancer Immune Checkpoint Blockade

Affiliations

Opposing Functions of Interferon Coordinate Adaptive and Innate Immune Responses to Cancer Immune Checkpoint Blockade

Joseph L Benci et al. Cell. .

Abstract

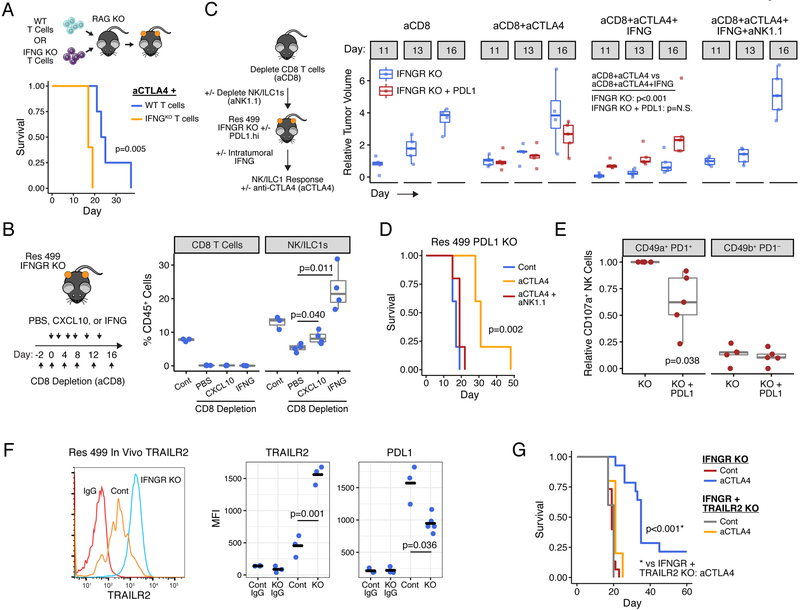
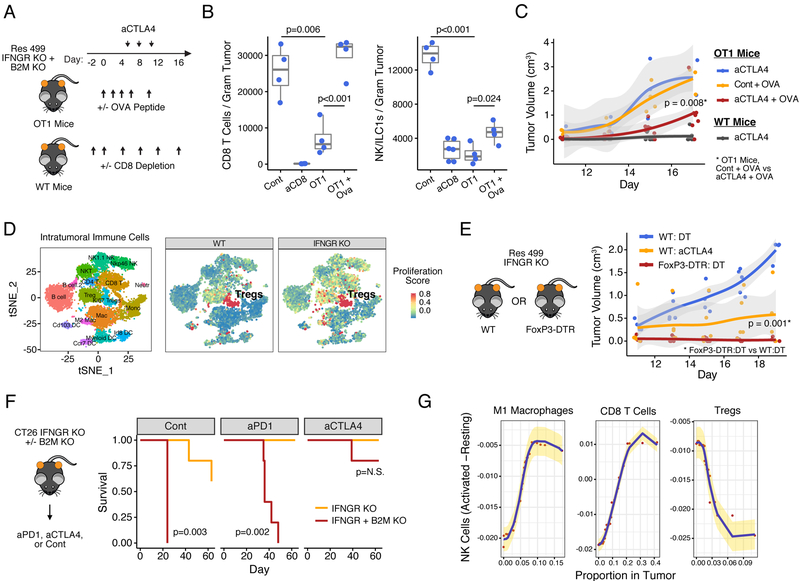
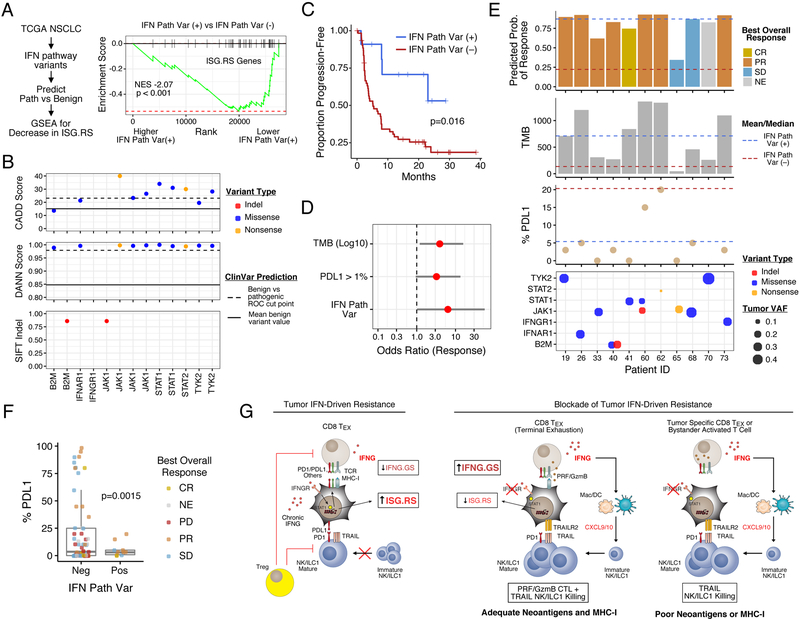
Interferon-gamma (IFNG) augments immune function yet promotes T cell exhaustion through PDL1. How these opposing effects are integrated to impact immune checkpoint blockade (ICB) is unclear. We show that while inhibiting tumor IFNG signaling decreases interferon-stimulated genes (ISGs) in cancer cells, it increases ISGs in immune cells by enhancing IFNG produced by exhausted T cells (TEX). In tumors with favorable antigenicity, these TEX mediate rejection. In tumors with neoantigen or MHC-I loss, TEX instead utilize IFNG to drive maturation of innate immune cells, including a PD1+TRAIL+ ILC1 population. By disabling an inhibitory circuit impacting PD1 and TRAIL, blocking tumor IFNG signaling promotes innate immune killing. Thus, interferon signaling in cancer cells and immune cells oppose each other to establish a regulatory relationship that limits both adaptive and innate immune killing. In melanoma and lung cancer patients, perturbation of this relationship is associated with ICB response independent of tumor mutational burden.

Keywords: CTLA4; ISGs; NK cells; PDL1; T cell exhaustion; immune checkpoint blockade; immunotherapy resistance; innate lymphoid cells; interferon.


Figures

Figure 1.
Figure 1.. Distinct ISGs are differentially expressed in cancer and immune cells and have opposing functions in predicting clinical ICB response.
A) Gene set enrichment analysis (GSEA) of resistance-associated ISGs (ISG.RS) in Res 499 cells compared to parental B16 cells, both sorted from in vivo tumors. Heatmap (red is high expression, blue is low) and enrichment plot is shown along with the normalized enrichment score (NES) and p-value. B) Venn diagram of genes in the ISG.RS along with hallmark IFNG-related genes (IFNG.GS) partitioned into non-overlapping gene sets (color-coded) and used to create individual metagenes. Cell types from scRNA-seq data of pooled human melanoma tumors are shown in the tSNE plot along with expression of the ISG metagenes. C) Genomic and clinical features associated with anti-PD1 response in melanoma patients. Shown are tumor mutational burden (TMB), prior treatment with ipilimumab (Ipi), relative frequency of CD8 T cells and activated NK cells (activated minus resting) inferred by CIBERSORT, and bulk tumor expression of the ISG metagenes. D) Proportion of activated NK cells vs. CD8 T cells stratified by low/high IFNG.GS and ISG.RS expression. Regression line (orange), Pearson correlation and p-value, and percent CD8 T cells in each quadrant are shown. E) Odds ratio and 95% confidence intervals from a multivariable model for clinical anti-PD1 response. F) Expression of each metagene (left plot), and the predicted probability of anti-PD1 response (right plot) from a model using TMB and the ratio of IFNG.GS over ISG.RS (dISG). Odds ratios are shown in the inset. Circle color indicates response and size indicates TMB. G) Summary of cancer and immune cell relationships inferred by statistical modeling and how ISGs impact probability of ICB response. H) GSEA for ISG.RS genes after KO of the indicated IFN receptor in Res 499 tumors. See also Figure S1.
Figure 2.
Figure 2.. Mouse models differing in MHC-I, tumor mutational burden, and predicted neoantigen status.
A) Summary of key properties of mouse tumor models. N.D. is not determined. B) TMB for each of the indicated cell lines. The proportion of predicted neoantigens (MHC-I affinity ≤ 500 nM) is shown. C) Constitutive (baseline) and D) IFNG-inducible (+IFNG) MHC-I on indicated tumor cells with or without IFNGR KO. E) Cumulative distribution function plot of the allelic frequencies for predicted high-affinity (≤ 100 nM) neoantigens. The p-value is determined by an empirical distribution of the KS statistic from random variants. F) Allelic frequency of predicted high-affinity neoantigens in B16 and Res 499 tumors. Values are transformed onto a log10 scale with a near-heterozygous value for a tetraploid genome indicated (dashed blue line). Circle size corresponds to neoantigen affinity. Circle color corresponds to neoantigen clusters predicted to be evolutionarily related and giving rise to G) subclonal populations (Subclone 1–4) inferred from high quality variants and displayed using a phylogenetic tree. Frequencies of these subclonal populations are shown. See also Figure S2.
Figure 3.
Figure 3.. Preventing tumor IFN signaling promotes CD8 T cell-dependent and/or NK/ILC1-dependent ICB response.
A) Survival of mice bearing CT26 tumors with KO of IFNGR +/− B2M or of both IFNGR and IFNAR (IFNA/GR) after no treatment (Cont), CD8 depletion (aCD8), or anti-PD1 (aPD1). For each group, n=5–15. B) Survival (top) and tumor volumes (bottom) after treatment with RT + anti-CTLA4 or control (Cont) for mice bearing B16 or Res 499 tumors with the indicated KO. Unless indicated, displayed p-values are for comparisons within each genotype (legend). For tumor volumes, only groups of interest are shown. Groups with no depletion: WT, n=20–28; IFNA/GR KO, n=10–20; IFNA/GR + B2M KO, n=4–5. For aNK1.1 groups, n=5. C) Tumor volumes for B16 and Res 499 tumors expressing human CD19 (hCD19) with or without IFNA/GR KO after a single infusion with primary murine T cells transduced with a CAR (CART) against hCD19. D) Survival of mice bearing IFNGR KO Res 499 tumors with or without concurrent B2M KO after treatment with anti-CTLA4. Effect of immune cell depletion with anti-CD8 or anti-NK1.1 is shown. IFNGR KO, n=5; B2M KO, n=5; IFNGR + B2M KO, n=10–20. E) Survival of wild type (WT) or Perforin KO (Prf1 KO) mice bearing IFNGR KO Res 499 tumors after anti-CTLA4. aCTLA4, n=7–10; Cont, n=2–4. See also Figure S3.
Figure 4.
Figure 4.. Blockade of tumor IFNG signaling promotes CD8 TEX expansion, IFNG production, immune cell IFNG signaling, and maturation of NK and PD1+ TRAIL+ ILC1 cells.
CD45+ immune cells from Res 499 tumors with or without IFNGR KO were profiled by scRNA-seq. A) tSNE plot with identified immune populations (left) and corresponding density plots (right). The percent of CD8 T cells is 6.4% and 16.8% in wild type (WT) and IFNGR KO tumors, respectively. B) GSEA on CD8 T cell clusters using T cell terminal exhaustion and progenitor exhaustion gene sets. C) Intratumoral IFNG protein levels from wild type or IFNGR KO Res 499 tumors treated with or without anti-CTLA4. Effect of CD8 T cell depletion (aCD8) is also shown. D) Expression of IFNG.GS or E) average expression of Cxcl9 and Cxcl10 across intratumoral immune cells from wildtype or IFNGR KO tumors overlaid on the tSNE map shown in (A). F) NK1.1+ and NKp46+ NK cell clusters from (A) were re-clustered. Shown is a tSNE plot with identified NK and ILC1 populations (left) and corresponding density plots (right). G) Average expression of select NK/ILC1 genes for each of the indicated NK or ILC1 maturation stage. H) CD8 T cells and NK/ILC1 populations were identified by 28-color flow cytometry. Shown is ratio of PD1+ Eomes+ CD8 TEX that belong to Ki67+ GzmB+ clusters over total PD1+ Eomes+ CD8 TEX (left) or the proportion of CD11bhi NK and PD1+ TRAIL+ ILC1 cells relative to total NK/ILC1s (right). I) Density plots of NK/ILC1 clusters and expression of indicated markers overlaid onto a tSNE plot. Points are colored by scaled MFI and overlaid with a contour plot. Clusters 3, 9, 10, and 11 are CD11bhi NK cells, and cluster 4 is PD1+ TRAIL+ ILC1 cells. See also Figure S4.
Figure 5.
Figure 5.. NK/ILC1-mediated killing from blocking tumor IFNG signaling is regulated by IFNG produced by TEX, PD1/PDL1, and TRAIL/TRAILR2.
A) Wild type or IFNG-deficient CD8 T cells were adoptively transferred into Rag1−/− mice. Shown is survival after implantation of IFNGR KO Res 499 tumors and treatment with anti-CTLA4 (n=4–5). B) Mice bearing IFNGR KO Res 499 tumors were depleted of CD8 T cells followed by intratumoral injection of the indicated cytokine. Shown is the percentage of intratumoral CD8 T cells and NK/ILC1s. C) Response of IFNGR KO Res 499 tumors in CD8 T cell-depleted mice. Mice were treated with anti-CTLA4 with or without intratumoral injection of IFNG. Effect of concurrent depletion of NK/ILC1s with anti-NK1.1 is also shown as well as effect of high constitutive PDL1 on IFNGR KO tumors (red boxplots). Tumor volumes are relative to initial control tumor volume. D) Survival after anti-CTLA4 treatment of mice bearing Res 499 tumors with concurrent KO of PDL1 (n=5). The effect of anti-NK1.1 is shown. E) In vitro NK cell killing of Res 499 IFNGR KO tumor cells with or without constitutive ectopic PDL1 expression. Both CD49a+ PD1+ and CD49b+ PD1 populations were tested. Shown are relative proportions of CD107a+ NK cells. For each biological replicate, data are normalized to results from Res 499 IFNGR KO cells cultured with CD49a+ PD1+ NK cells. F) In vivo TRAILR2 and PDL1 expression on Res 499 tumors with or without IFNGR KO. G) Survival after anti-CTLA4 of mice bearing IFNGR KO Res 499 tumors with (n=14–15) or without (n=5) concurrent KO of TRAILR2. See also Figure S5.
Figure 6.
Figure 6.. Activated bystander T cells support and Tregs inhibit NK/ILC1-dependent response after blocking tumor IFNG signaling.
A) OT-1 mice bearing Res 499 tumors with combined IFNGR and B2M KO were treated with anti-CTLA4 with or without intratumoral injection of OVA peptide. Wild type mice with or without CD8 T cell depletion were used as comparison. B) Tumor infiltration by CD8 T cells and NK/ILC1s and C) growth of Res 499 IFNGR + B2M KO tumors after anti-CTLA4 (95% confidence interval in grey). D) Proliferation status of Tregs and other intratumoral immune cells in control (WT) or Res 499 IFNGR KO tumors measured by average expression of Ki67 and Top2a. E) Tumor growth of Res 499 IFNGR KO tumors implanted into wild type or FoxP3-DTR mice treated with anti-CTLA4 or diptheria toxin (DT). F) Survival of mice bearing CT26 tumors with IFNGR +/− B2M KO after treatment with anti-PD1 or anti-CTLA4. For all groups, n=5. G) Top predictive features from a random forest model (and confirmed by lasso regression) for how the proportion of different intratumoral immune cells (x-axis) predicts the proportion of activated NK cells in human melanoma tumors (y-axis). Standard error is in yellow. See also Figure S6.
Figure 7.
Figure 7.. Tumor mutations in the IFN pathway predict decreased ISG.RS and increased survival in lung cancer patients treated with anti-CTLA4 and anti-PD1.
A) GSEA of ISG.RS genes comparing TCGA NSCLC patients with and without a predicted pathogenic variant in the IFN pathway (IFN Path Var). B) CADD, DANN, and SIFT scores for IFN Path Var from a cohort of 75 NSCLC patients treated with anti-CTLA4 + anti-PD1. Variant type (color), optimal cut points for classification (dashed line), and mean value for benign ClinVar variants (solid line) are shown. C) Progression-free survival after anti-CTLA4 and anti-PD1, and D) odds ratios for response (with 95% confidence intervals) from multivariable logistic regression. E) Response (top plot), clinical features (middle two plots), and variant allele frequency (VAF; bottom plot) of tumors with IFN Path Vars. The mean/median values are indicated by dashed lines. Top plot shows predicted probability of response (from logistic regression) and observed best overall response (NE is nonevaluable). F) Boxplot of %PDL1 staining and response. G) Model for how the opposing roles of IFN signaling in immune and tumor cells regulate ICB response in tumors differing in neoantigen and MHC-I status. See also Figure S7.

References

    1. Ahlenstiel G, Titerence RH, Koh C, Edlich B, Feld JJ, Rotman Y, Ghany MG, Hoofnagle JH, Liang TJ, Heller T, et al. (2010). Natural killer cells are polarized toward cytotoxicity in chronic hepatitis C in an interferon-alfa-dependent manner. Gastroenterology 138, 325–35.e1–2. - PMC - PubMed
    1. Arce Vargas F, Furness AJS, Litchfield K, Joshi K, Rosenthal R, Ghorani E, Solomon I, Lesko MH, Ruef N, Roddie C, et al. (2018). Fc Effector Function Contributes to the Activity of Human Anti-CTLA-4 Antibodies. Cancer Cell 33, 649–663.e4. - PMC - PubMed
    1. Ayers M, Lunceford J, Nebozhyn M, Murphy E, Loboda A, Kaufman DR, Albright A, Cheng JD, Kang SP, Shankaran V, et al. (2017). IFN-γ-related mRNA profile predicts clinical response to PD-1 blockade. J Clin Invest 127, 2930–2940. - PMC - PubMed
    1. Benci JL, Xu B, Qiu Y, Wu TJ, Dada H, Twyman-Saint Victor C, Cucolo L, Lee DSM, Pauken KE, Huang AC, et al. (2016). Tumor Interferon Signaling Regulates a Multigenic Resistance Program to Immune Checkpoint Blockade. Cell 167, 1540–1554.e12. - PMC - PubMed
    1. Breiman L (2001). Random forests. Machine Learning.

Publication types

MeSH terms