. 2019 Aug 9;11(1):71.
doi: 10.1186/s13195-019-0524-x.

A single-nuclei RNA sequencing study of Mendelian and sporadic AD in the human brain

Affiliations

A single-nuclei RNA sequencing study of Mendelian and sporadic AD in the human brain

Jorge L Del-Aguila et al. Alzheimers Res Ther. .

Abstract

Background: Alzheimer's disease (AD) is the most common form of dementia. This neurodegenerative disorder is associated with neuronal death and gliosis heavily impacting the cerebral cortex. AD has a substantial but heterogeneous genetic component, presenting both Mendelian and complex genetic architectures. Using bulk RNA-seq from the parietal lobes and deconvolution methods, we previously reported that brains exhibiting different AD genetic architecture exhibit different cellular proportions. Here, we sought to directly investigate AD brain changes in cell proportion and gene expression using single-cell resolution.

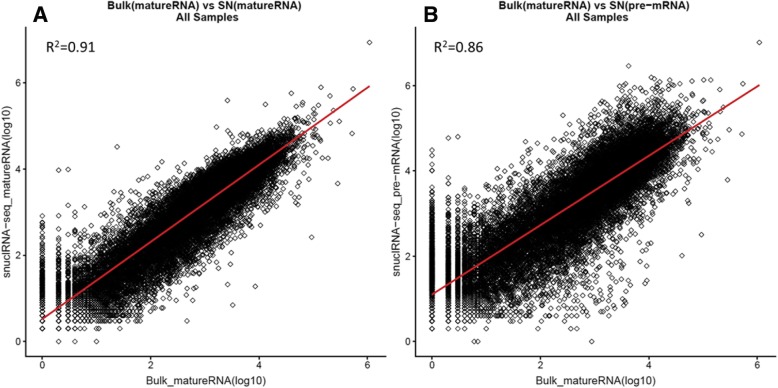
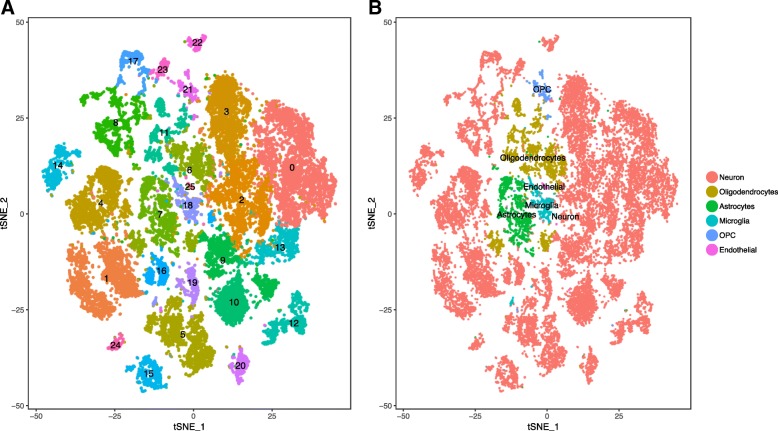
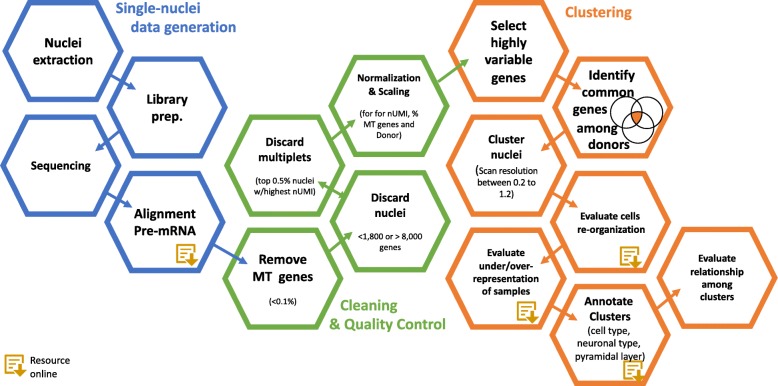
Methods: We generated unsorted single-nuclei RNA sequencing data from brain tissue. We leveraged the tissue donated from a carrier of a Mendelian genetic mutation, PSEN1 p.A79V, and two family members who suffer from sporadic AD, but do not carry any autosomal mutations. We evaluated alternative alignment approaches to maximize the titer of reads, genes, and cells with high quality. In addition, we employed distinct clustering strategies to determine the best approach to identify cell clusters that reveal neuronal and glial cell types and avoid artifacts such as sample and batch effects. We propose an approach to cluster cells that reduces biases and enable further analyses.

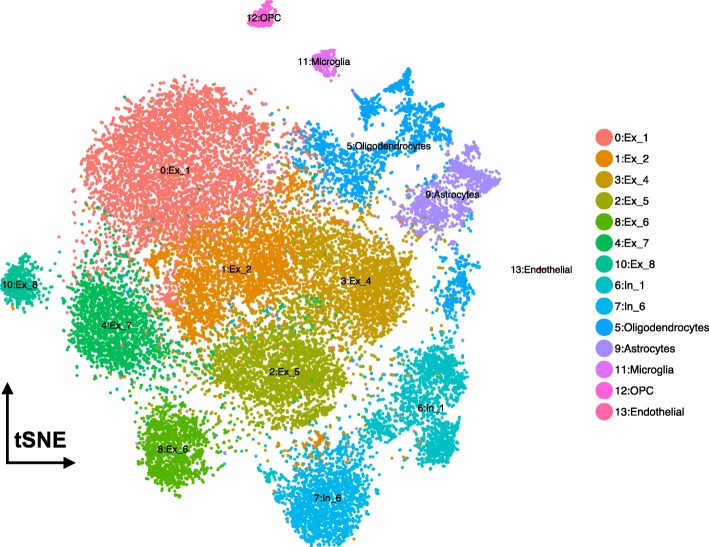
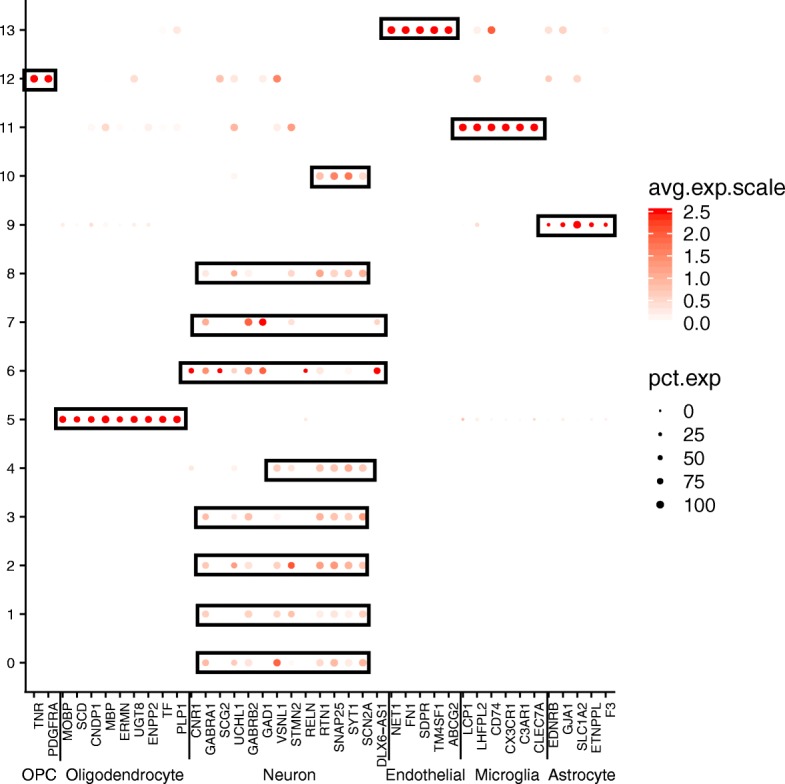
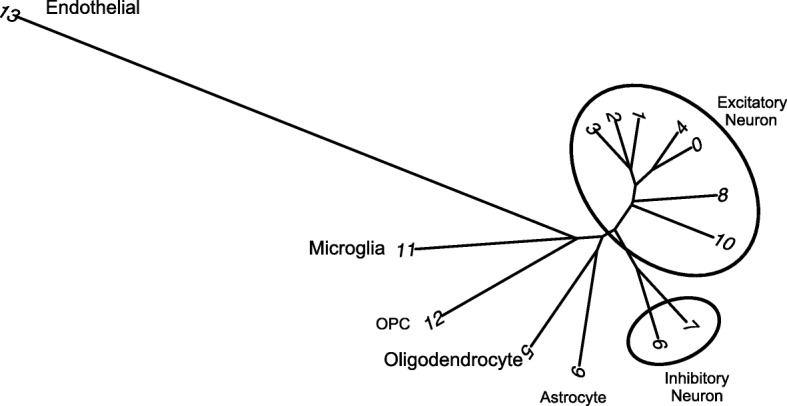
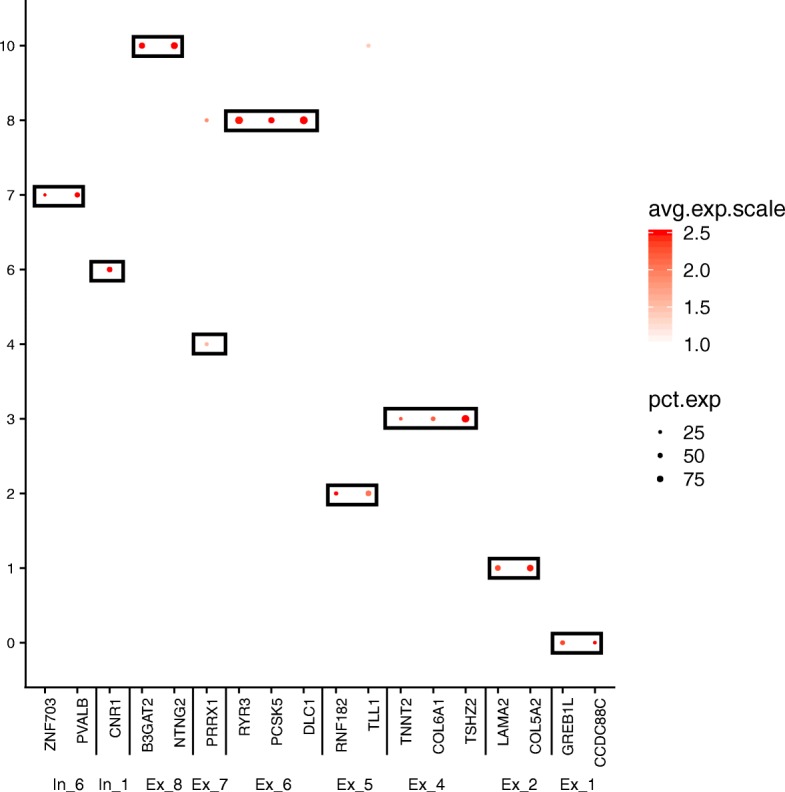
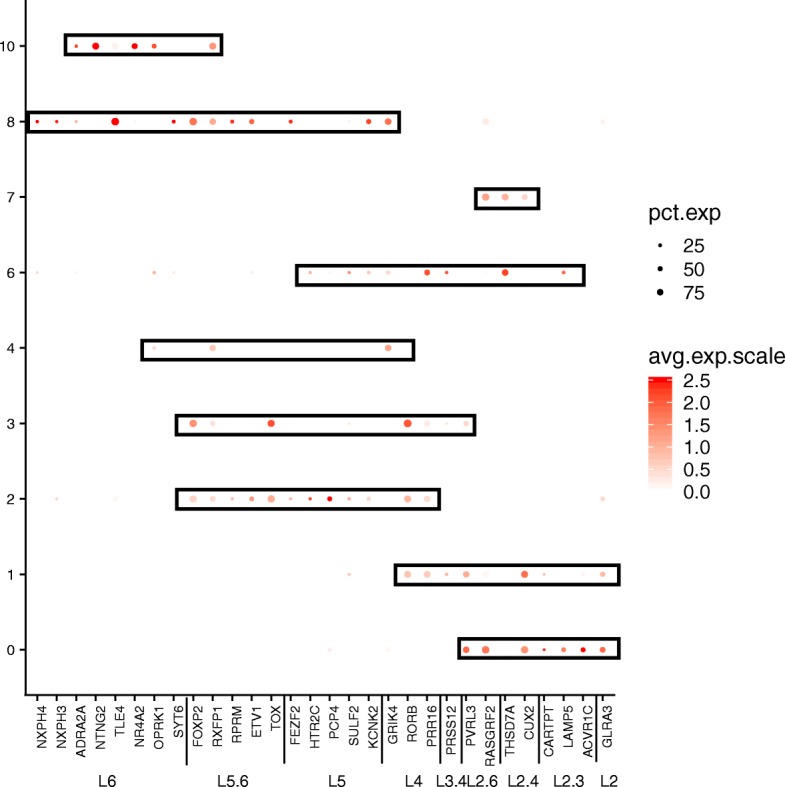
Results: We identified distinct types of neurons, both excitatory and inhibitory, and glial cells, including astrocytes, oligodendrocytes, and microglia, among others. In particular, we identified a reduced proportion of excitatory neurons in the Mendelian mutation carrier, but a similar distribution of inhibitory neurons. Furthermore, we investigated whether single-nuclei RNA-seq from the human brains recapitulate the expression profile of disease-associated microglia (DAM) discovered in mouse models. We also determined that when analyzing human single-nuclei data, it is critical to control for biases introduced by donor-specific expression profiles.

Conclusion: We propose a collection of best practices to generate a highly detailed molecular cell atlas of highly informative frozen tissue stored in brain banks. Importantly, we have developed a new web application to make this unique single-nuclei molecular atlas publicly available.

Keywords: Alzheimer’s disease; PSEN1; Single-nuclei RNA-seq; Web-based brain molecular atlas.


Conflict of interest statement

CC receives research support from: Biogen, EISAI, Alector and Parabon. The funders of the study had no role in the collection, analysis, or interpretation of data; in the writing of the report; or in the decision to submit the paper for publication. CC is a member of the advisory board of ADx Healthcare, and Vivid Genomics. D.M.H. co-founded and is on the scientific advisory board of C2N Diagnostics. D.M.H. is on the scientific advisory board of Denali, Genentech, and Proclara. D.M.H. consults for AbbVie.

Figures

Fig. 1
Fig. 1
Correlation between bulk RNA-seq and single-nuclei RNA-seq aligned using the pre-mRNA and mRNA annotation references. Along the X-axis, we show the gene expression values obtained from the bulk RNA-seq, and along the Y-axis, the single-nuclei expression, which was analyzed as bulk RNA-seq. a Bulk RNA-seq vs snuclRNA-seq aligned with mRNA (see the “Methods” section). b Bulk RNA-seq vs snuclRNA-seq aligned with pre-mRNA
Fig. 2
Fig. 2
TSNE plots for the CGS dimensional reduction approach. TSNE plots depicting 26,331 nuclei. a The nuclei are colored to represent the 25 CGS clusters. b The clusters are annotated to represent the cell types (neuron, ologodendrocytes, astrocytes, microglia, OPC, and endothelial)
Fig. 3
Fig. 3
TSNE plots for Consensus Gene Set dimensional reduction approach. TSNE plots depicting 26,331 cells in 14 annotated clusters: Cluster0-Ex_1, Cluster1-Ex_2, Cluster3-Ex_4, Cluster2-Ex_5, Cluster8-Ex_6, Cluster4-Ex_7, Cluster10-Ex_8, Cluster6-In_1, Cluster7-In_6, Cluster5-Oligodendrocytes, Cluster9-Astrocytes, Cluster11-Microglia, Cluster12-OPC, and Cluster13-Endothelial. In, inhibitory neuron; Ex, excitatory neuron
Fig. 4
Fig. 4
DotPlot depicting the expression of marker genes selected by the literature for the ConGen approach (see Additional file 1: Table S2 and Table S3). This graphical approach allows us to annotate the clusters that were obtained by after the selection of the 1434 common genes
Fig. 5
Fig. 5
Dendrogram for Consensus Gene Set clusters. This dendrogram shows the hierarchical relationship between clusters, based on the Euclidean distance of cluster mean expression. The proximity of that clusters 0, 1, 2, 3, 4, 8, and 10 indicates the same cell type (excitatory neurons). Inhibitory neurons (clusters 6 and 7) are placed in the same branch as the excitatory neuron. This is another way to confirm the clustering obtained by TSNE
Fig. 6
Fig. 6
DotPlot depicting the expression of the neuron cell for ConGen approach. Inhibitory neurons are distributed between clusters 6 and 7, and the excitatory neurons are distributed in clusters 0, 1, 2, 3, 4, and 8 as defined by Lake et al. [5]. In, inhibitory neuron; Ex, excitatory neuron
Fig. 7
Fig. 7
Dot Plots of layer markers in different subclusters of neuron cell subclusters from ConGen approach. DotPlot depicting the expression of layer-specific marker genes going from the superficial layers (e.g., L2) to the deeper layers (L6) for each neural clusters (clusters 0, 1, 2, 3, 4, 6, 7, 8)
Fig. 8
Fig. 8
Workflow analysis plan. In blue, the single-nuclei data generation. The most important step is the quantification of the nuclei using a “pre-mRNA” annotation. This step will significantly increase the quantity of nuclei and the quantification of their expression profile. In green, the cleaning and quality control steps. The QC followed standard measurements such as removing mitochondrial genes (MT), removing doublets and multiples, and the normalization of the data using nUMI, percent mitochondrial reads sample origin as confounding factors. In orange, the clustering. In this step, we performed the identification of genes that are highly variable in common among brain nuclei from all of the subjects. Later on, the nuclei can be clustered differently using different resolution, but in general, they are assigned to clusters that are annotated to group nuclei from the same specific cell type. Next, we identified a hierarchical relationship among the clusters by performing coincidence analyses. The entropy, from Shannon’s information theory, provides a quantitative measure of even distribution of samples in a cluster. To annotate the clusters, we use a set of gene markers for each cell type collected from the literature. Finally, a hierarchical clustering of clusters should reproduce expected results, grouping together neuronal subtypes in one branch and in another branch glial cells

References

    1. LaFerla FM, Oddo S. Alzheimer’s disease: Aβ, tau and synaptic dysfunction. Trends Mol Med. 2005;11(4):170–176. doi: 10.1016/j.molmed.2005.02.009. - DOI - PubMed
    1. De Strooper B, Annaert W. Novel research horizons for presenilins and gamma-secretases in cell biology and disease. Annu Rev Cell Dev Biol. 2010;26:235–260. doi: 10.1146/annurev-cellbio-100109-104117. - DOI - PubMed
    1. Selkoe DJ. Alzheimer’s disease: genes, proteins, and therapy. Physiol Rev. 2001;81(2):741–766. doi: 10.1152/physrev.2001.81.2.741. - DOI - PubMed
    1. Li Z, Del-Aguila JL, Dube U, Budde J, Martinez R, Black K, et al. Genetic variants associated with Alzheimer’s disease confer different cerebral cortex cell-type population structure. Genome Med. 2018;10(1):43. doi: 10.1186/s13073-018-0551-4. - DOI - PMC - PubMed
    1. Lake BB, Ai R, Kaeser GE, Salathia NS, Yung YC, Liu R, et al. Neuronal subtypes and diversity revealed by single-nucleus RNA sequencing of the human brain. Science. 2016;352(6293):1586–1590. doi: 10.1126/science.aaf1204. - DOI - PMC - PubMed

Publication types