. 2019 Aug 22;75(4):683-699.e7.
doi: 10.1016/j.molcel.2019.06.034. Epub 2019 Aug 6.

The Histone Deacetylase SIRT6 Restrains Transcription Elongation via Promoter-Proximal Pausing

Affiliations

The Histone Deacetylase SIRT6 Restrains Transcription Elongation via Promoter-Proximal Pausing

Jean-Pierre Etchegaray et al. Mol Cell. .

Abstract

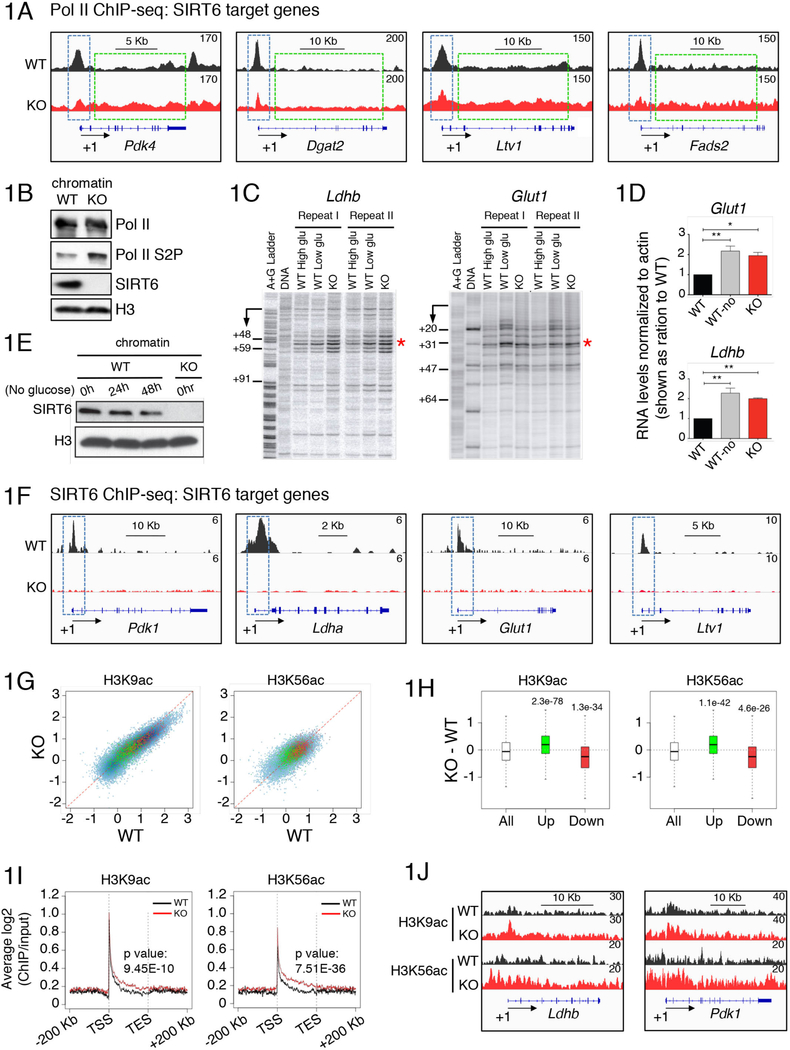
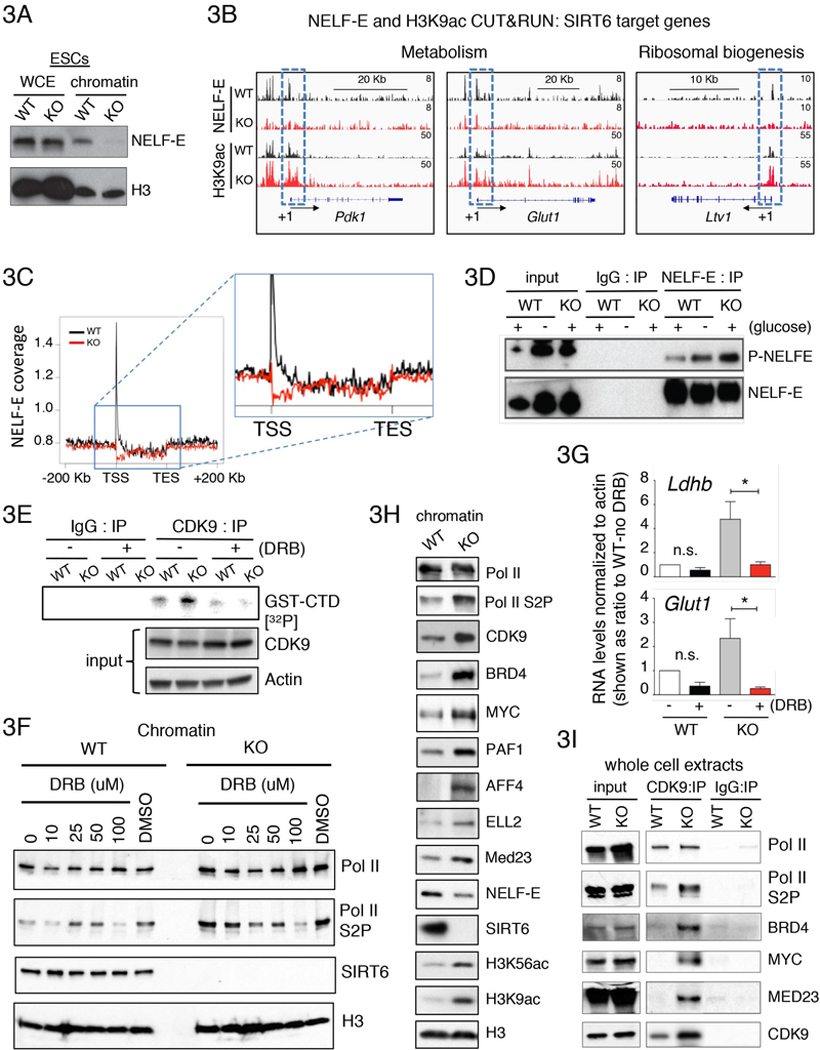
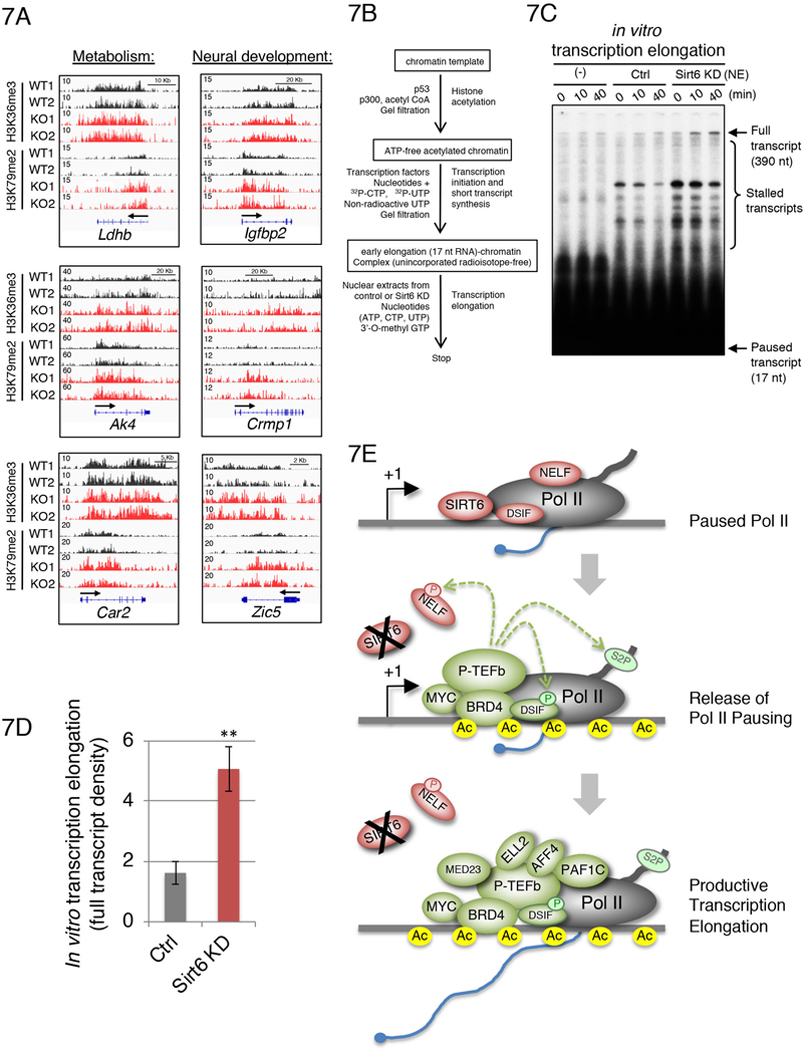
Transcriptional regulation in eukaryotes occurs at promoter-proximal regions wherein transcriptionally engaged RNA polymerase II (Pol II) pauses before proceeding toward productive elongation. The role of chromatin in pausing remains poorly understood. Here, we demonstrate that the histone deacetylase SIRT6 binds to Pol II and prevents the release of the negative elongation factor (NELF), thus stabilizing Pol II promoter-proximal pausing. Genetic depletion of SIRT6 or its chromatin deficiency upon glucose deprivation causes intragenic enrichment of acetylated histone H3 at lysines 9 (H3K9ac) and 56 (H3K56ac), activation of cyclin-dependent kinase 9 (CDK9)-that phosphorylates NELF and the carboxyl terminal domain of Pol II-and enrichment of the positive transcription elongation factors MYC, BRD4, PAF1, and the super elongation factors AFF4 and ELL2. These events lead to increased expression of genes involved in metabolism, protein synthesis, and embryonic development. Our results identified SIRT6 as a Pol II promoter-proximal pausing-dedicated histone deacetylase.

Keywords: BRD4; NELF; SIRT6; chromatin; epigenetics; histone deacetylation; transcription elongation; transcriptional pausing.


Conflict of interest statement

Declaration of Interests: Dr. Mostoslavsky has a financial interest in Galilei Biosciences Inc., a company developing activators of the mammalian SIRT6 protein. Dr. Mostoslavsky’s interests were reviewed and are managed by MGH and Partners HealthCare in accordance with their conflict of interest policies.

Figures

Figure 1.
Figure 1.. SIRT6 regulates transcriptional pausing via deacetylation of H3K9ac and H3K56ac.
(A) Integrative Genomics Viewer (IGV) browser (Robinson et al., 2011; Thorvaldsdottir et al., 2013) images of read coverage across the genome. Images of tiled data files (TDFs) generated by the displaying the density tracks of reads aligned across the genome. The tracks show ChIP-seq maps of Pol II on SIRT6 target genes Pdk4, Dgat2, Ltv1 and Fads2 in WT (black) and SIRT6 KO (red) ESCs. (B) Western blots showing levels of Pol II and Pol II Ser2P in the chromatin fraction isolated from WT and SIRT6 KO ESCs. (C) Permanganate footprinting and (D) RTqPCR showing levels of Ldhb and Glut1 genes in WT ESCs grown in high glucose (black) or no glucose (grey), and SIRT6 KO ESCs (red). Samples were normalized to actin and shown as ratios over WT samples (*: p < 0.05, **: p< 0.01, n > 3. Error bar represents s.e.m). (E) Western blots showing levels of SIRT6 and H3 in chromatin fraction from WT ESCs grown in normal glucose (0hr) or under no glucose for 24hrs or 48hrs, and chromatin from SIRT6 KO ESCs grown in normal glucose conditions. (F) IGV browser images from SIRT6 ChIP-seq showing SIRT6 target genes Pdk1, Ldha and Glut1 and Ltv1 in WT (black) and in SIRT6 KO ESCs (red). (G) Scatter plot analysis showing significant increase (green) or decrease (red) in H3K9ac or H3K56ac on genes upregulated in SIRT6 KO versus WT ESCs (upper panels). (H) Graphical quantification of the data on (G). (I) Metagene analysis showing enrichment of H3K9ac or H3K56ac at intragenic regions in SIRT6 KO (red) compared to WT (black) ESCs. (J) IGV broswer images from H3K9ac and H3K56ac ChIP-seqs in SIRT6 KO (red) versus WT ESCs (black) on Ldhb and Pdk1 genes.
Figure 2.
Figure 2.. Global decrease of Pol II pausing in ESCs lacking SIRT6.
(A) Co-localization of SIRT6 and Pol II. Heat maps showing Pol II and SIRT6 ChIP-seq signal within 3kb genomic windows flanking the TSS (the TSS is denoted as an arrow) in WT and SIRT6 KO ESCs. The SIRT6 heat map on SIRT6 KO ESCs was included as a control. (B) IGV broswer images for of Pol II and SIRT6 ChIP-seq on the SIRT6 target genes Ldha and Ak4. (C) IGV broswer images from Pol II ChIP-seq showing increased levels on Pol II at intragenic regions (gene bodies) in SIRT6 KO (red) compared to WT ESCs (black) on SIRT6 target genes (Ldhb and Ak4). (D) IGV browser images from PRO-seq analysis showing increase levels on Pol II at gene bodies in SIRT6 KO (red) compared to WT ESCs (black) on SIRT6 target genes (Ldhb and Ak4). (E) Metagene profile, from Pol Ii ChIP-seq analysis, showing a decrase in Pol II levels near TSS in SIRT6 KO ESCs (red) compared to WT cells (black) and an overall increased intragenic Pol II levels in SIRT6 KO ESCs. The inset is a zoom-in of intragenic regions highlighting the higher levels of Pol II in SIRT6 KO cells (p<0.04). (F) Pausing Index, calculated from Pol II ChIP-seq analysis, is decreased in SIRT6 KO compared to WT (grey) ESCs. (G) Metagene profile, from PRO-seq analysis, showing an overall increased intragenic Pol II levels in SIRT6 KO (red) compared to WT (black) ESCs. The inset is a zoom-in of intragenic regions highlighting the higher levels of Pol II in SIRT6 KO cells (p<0.0001). (H) Pausing Index, calculated from PRO-seq analysis, is decreased in SIRT6 KO (red) compared to WT (black) ESCs ( p<0.0001). (I) Metagene profile, from PRO-seq analysis, showing an overall increased intragenic Pol II levels in glucose deprived WT ESCs (green) versus WT control cells (black) grwon under normal conditions. The inset is a zoom-in of intragenic regions highlighting the higher levels of Pol II in glucose deprived WT cells (p<0.0001). (J) Decreased Pausing Index, calculated from PRO-seq analysis, in glucose deprived WT ESCs (green) compared to WT control cells (black)(p<0.0001).
Figure 3.
Figure 3.. SIRT6 is an integral component of the Pol II transcription pausing machinery.
(A) Western blot showing decreased levels of chromatin-bound NELF-E in SIRT6 KO compared to WT ESCs. (B) IGV broswer images from CUT&RUN assays for NELF-E and H3K9ac in WT (black) and SIRT6 KO ESCs (red). TSS regions are denoted as +1 and directionality of transcription by the arrow. Levels of NELF-E and H3K9ac near TSS are highlighted inside the blue dotted line square. (C) Metagene profile for NELF-E coverage in SIRT6 KO (red) versus WT ESCs shows a drastic decrease of NELF-E at promoter-proximal regions. (D) Phosphorylated NELF-E (P-NELF-E) levels increased in SIRT6 KO and glucose starved WT ESCs compared to WT controls. Western blots showing immunoprecipitation of NELF-E blotted with anti-Phospho-CDK9 substrate and anti-NELF-E antibodies in WT, WT no glucose and SIRT6 KO ESCs. (E) CDK9-dependent in vitro kinase assay. CDK9 was immunoprecipitated from either WT or SIRT6 KO ESCs and in vitro kinase assay was performed on beads conjugated with a synthetic GST-tagged carboxyl terminal domain of Pol II peptide (GST-CTD) in the presence of 32p-γATP, in the presence or absence of the CDK9 inhibitor DRB. A representative experiment is shown. (F) Western blot analysis showing decreasing chromatin levels of Pol II S2P by adding the CDK9 inhibitor DRB in a dose-dependent manner to WT and SIRT6 KO ESCs. (G) RTqPCR showing levels of Ldhb and Glut1 genes with or without DRB treatment in WT and SIRT6 KO ESCs. (H) Western blots showing chromatin levels for Pol II, Pol II Ser2P, CDK9, BRD4, MYC, PAF1, AFF4 and ELL2, MED23, NELF-E, SIRT6, H3K56ac, H3K9ac and total histone H3 in WT and SIRT6 KO ESCs. (I) Western blots showing increased co-immunoprecipitation of CDK9 with Pol II Ser2P, BRD4, MYC and MED23 in SIRT6 KO ESCs.
Figure 4.
Figure 4.. SIRT6 regulates transcription by modulating the levels of chromatin-bound MYC.
(A) Western blots showing chromatin bound MYC and levels H3K9ac and H3K56ac in WT, glucose deprived WT and SIRT6 KO ESCs. (B) MYC ChIP-qPCR experiments in Ldhb and Glut1 genes. Schematic representation for these genes are shown below. Samples were normalized to input and further normalized to IgG ChIP controls. (*: p < 0.05, **: p < 0.005, ***: p < 0.0005, n = 3. Error bar represents s.e.m). (C) RTqPCR analysis showing RNA levels for the metabolic genes Ldha, Ldhb, Glut1, Pdk1 and the ribosomal genes Rpl3, Rpl5, Rpl6 upon MYC knockdown (shMyc) or a control shRNA (shCtrl) in WT, glucose deprived WT and SIRT6 KO ESCs. (*: p < 0.05, n = 3. Error bar represents s.e.m). (D) Western blot analysis showing decreased Pol II S2P, BRD4 and CDK9 on chromatin of SIRT6 KO ESCs upon acute MYC knockdown using two distinct siRNA oligos. H3 is shown as loading control for chromatin fractions. Cytosolic fractions show the rescue of PDK1 and LDH levels upon accute Myc knockdown in SIRT6 KO ESCs. Actin is included as a loading control.
Figure 5.
Figure 5.. SIRT6 controls the assembly of transcription elongation and super elongation factors.
(A) Western blots from whole cell extracts show levels of PDK1 and LDHA rescued upon accute si RNA-mediated knockdown of BRD4 and/or PAF1 in SIRT6 KO ESCs. (B) RTqPCR analysis showing cDNA levels for Pdk1, Ldha and Ldhb in WT and SIRT6 KO ESCs following siRNA-mediated knockdown of BRD4 (siBrd4) and/or PAF1 (siPAF1). Samples were normalized to actin levels. Error bar represents s.e.m (*: p < 0.05, **: p< 0.01, ***: p< 0.001, n = 3). (C) Western blots showing decreased levels of Pol II Ser2P, in SIRT6 KO ESCs following accute siRNA-dependent BRD4 knockdown (siBRD4). (D) Western blots showing chromatin levels of BRD4, PAF1, MYC, AFF4, ELL2, SIRT6, and histone H3 in WT and SIRT6 KO ESCs upon acute siRNA-mediated knockdown of BRD4 and/or PAF1.
Figure 6.
Figure 6.. The PAF1 complex is a positive regulator of transcription elongation in ESCs lacking SIRT6.
(A) Increased recruitment of the PAF1C subunit LEO1 in SIRT6 KO ESCs at specific genes. IGV broswer images of LEO1 ChIP-seq in SIRT6 KO (red) versus WT ESCs (black) on genes implicated in metabolism (Ldhb, Ak4, Car2) and neural development (Igfbp2, Crmp1, Zic5). (B) Western blot analysis showing increased co-imunoprecipitation of PAF1C components PAF1, LEO1 and CDC73 with Pol II, Pol II Ser2P and the super elongation factor AFF4 in chromatin fractions from SIRT6 KO compared to WT ESCs. (C) Enrichment of SEC complex at intragenic regions of SIRT6 target genes. ChIP-qPCR analysis of super elongation factors ELL2 and AFF4 at various genomic regions of Ldhb and Glut1 genes, in WT (black) versus SIRT6 KO (red) ESCs. Schematic representation of the Ldhb and Glut1 genes and the location of the regions targeted for qPCR is shown below.
Figure 7.
Figure 7.. SIRT6-dependent chromatin dynamics regulates Pol II elongation.
(A) IGV broswer images showing the enrichment of H3K36me3 and H3K79me2 on metabolic (Ldhb, Ak4, Car2) and neural developmental (Igfbp2, Crmp1, Zic5) genes in WT (black) and SIRT6 KO (red) ESCs. (B) Scheme of the in vitro transcription elongation protocol using a chromatinized DNA template. (C) In vitro transcription elongation assay showing and augmentation of full elongation capacity in the absence of SIRT6. (D) Quantification of full elongation products from panel (C). (E) Model of SIRT6-dependent regulation of transcription elongation. Under normal nutrient conditions, SIRT6 forms a complex with Pol II at promoter-proximal regions where NELF is retained during transcriptional pausing. In this complex, SIRT6 maintains histone H3 in a deacetylated state on its targeted genes, thereby facilitating Pol II pausing. However, under poor nutrient conditions such as glucose starvation, SIRT6 dissociates from the chromatin, allowing acetylation of histone H3, which triggers the recruitment of BRD4, MYC. This facilitate the recruitment and activation of P-TEFb (containing CDK9), which causes the phosphorylation and chromatin eviction of NELF. Activated P-TEFb also phosphorylates the carboxyl terminal domain of Pol II at serine 2 (Ser2P), which triggers the release of transcriotional pausing. Subsequent recruitment of additional factors including PAF1C, MED23, along with super elongation factors AFF4 and ELL2 impel transcription into productive elongation mode.

References

    1. Adelman K, and Lis JT (2012). Promoter-proximal pausing of RNA polymerase II: emerging roles in metazoans. Nat Rev Genet 13, 720–731. - PMC - PubMed
    1. Alland L, Muhle R, Hou H Jr., Potes J, Chin L, Schreiber-Agus N, and DePinho RA (1997). Role for N-CoR and histone deacetylase in Sin3-mediated transcriptional repression. Nature 387, 49–55. - PubMed
    1. Bartkowiak B, Liu P, Phatnani HP, Fuda NJ, Cooper JJ, Price DH, Adelman K, Lis JT, and Greenleaf AL (2010). CDK12 is a transcription elongation-associated CTD kinase, the metazoan ortholog of yeast Ctk1. Genes Dev 24, 2303–2316. - PMC - PubMed
    1. Bisgrove DA, Mahmoudi T, Henklein P, and Verdin E (2007). Conserved P-TEFb-interacting domain of BRD4 inhibits HIV transcription. Proc Natl Acad Sci U S A 104, 13690–13695. - PMC - PubMed
    1. Boettiger AN, and Levine M (2009). Synchronous and stochastic patterns of gene activation in the Drosophila embryo. Science 325, 471–473. - PMC - PubMed

Publication types

MeSH terms