. 2019 Aug 14;26(2):252-264.e10.
doi: 10.1016/j.chom.2019.07.004. Epub 2019 Aug 6.

Obese Individuals with and without Type 2 Diabetes Show Different Gut Microbial Functional Capacity and Composition

Affiliations

Obese Individuals with and without Type 2 Diabetes Show Different Gut Microbial Functional Capacity and Composition

Louise B Thingholm et al. Cell Host Microbe. .

Abstract

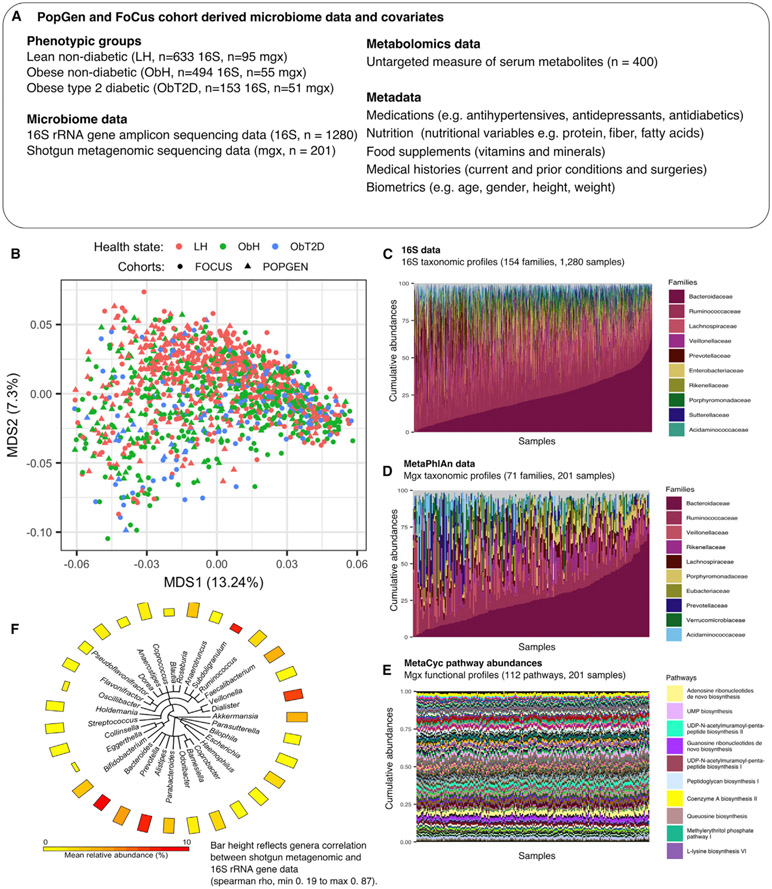
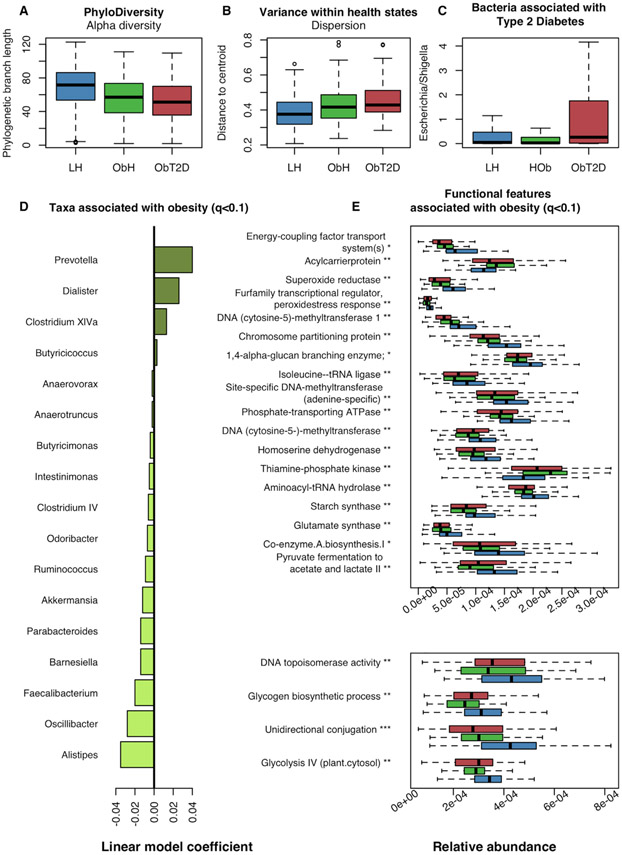
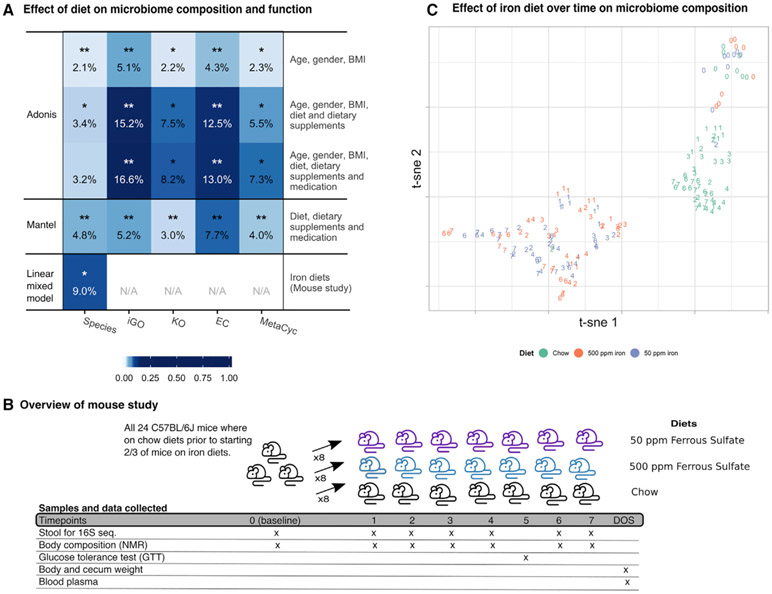
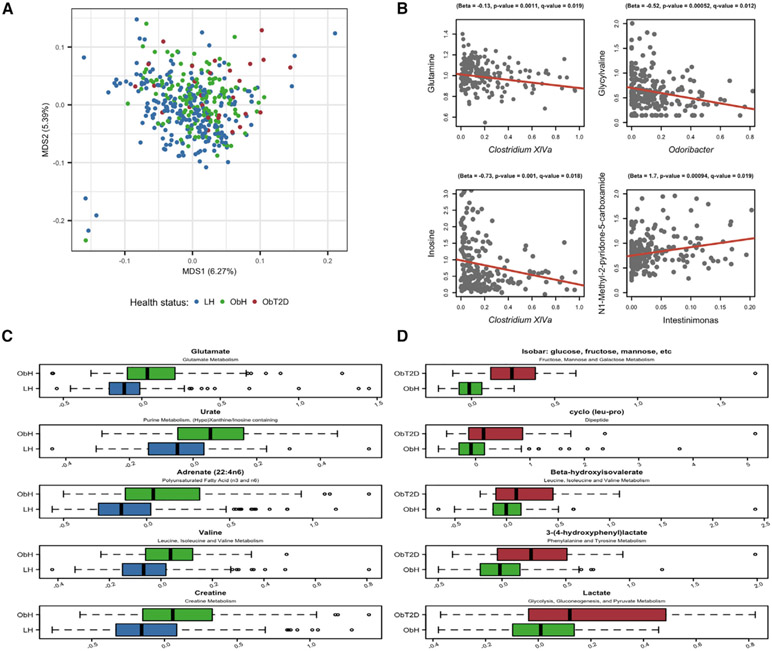
Obesity and type 2 diabetes (T2D) are metabolic disorders that are linked to microbiome alterations. However, their co-occurrence poses challenges in disentangling microbial features unique to each condition. We analyzed gut microbiomes of lean non-diabetic (n = 633), obese non-diabetic (n = 494), and obese individuals with T2D (n = 153) from German population and metabolic disease cohorts. Microbial taxonomic and functional profiles were analyzed along with medical histories, serum metabolomics, biometrics, and dietary data. Obesity was associated with alterations in microbiome composition, individual taxa, and functions with notable changes in Akkermansia, Faecalibacterium, Oscillibacter, and Alistipes, as well as in serum metabolites that correlated with gut microbial patterns. However, microbiome associations were modest for T2D, with nominal increases in Escherichia/Shigella. Medications, including antihypertensives and antidiabetics, along with dietary supplements including iron, were significantly associated with microbiome variation. These results differentiate microbial components of these interrelated metabolic diseases and identify dietary and medication exposures to consider in future studies.

Keywords: dietary supplements; iron; magnesium; medication; metabolic disease; microbiome; nutrition; obesity; type 2 diabetes.


Conflict of interest statement

DECLARATION OF INTERESTS

L.B.T. is an employee and shareholder of BiomCare. C.H. is a scientific advisor for Seres Therapeutics, microbiome Insights, and ZOE.

Figures

Figure 1.
Figure 1.. The Gut Microbiome in Obesity and Obesity-Associated type 2 Diabetes in Two Northern German Population Cohorts
We investigated 1,280 individuals from two cohorts (popgen, n = 436, and focus, n = 844) to assess the role of the gut microbiome in T2D and obesity. In addition to extensive lifestyle, dietary, and environmental covariates recorded for these individuals, a stool sample from each participant was assayed using 16S rRNA gene sequencing, and a subset of these samples (n = 201) were metagenomically profiled. (A) Overview of study data and metadata; detailed information in Table S1. (B) Ordination of genus-level taxonomic profiles from 16S rRNA gene sequencing, using multidimensional scaling (MDS) of Bray-Curtis dissimilarities. (C and D) Family-level taxonomic abundances for 16S (C) and metagenomic (D) data. The top 10 abundant families are annotated in the panel legend, while the remaining detected families are indicated in gray. Samples are ordered according to increasing relative abundance of bacteroidaceae. (E) MetaCyc pathway abundances across 201 metagenomes (Caspi et al., 2014). The top 10 abundant pathways are colored and annotated in the panel legend, while the remaining core pathways (selected as top 50% mean abundant and top 50% variant) are indicated in gray. (F) The phyloT-based (http://phylot.biobyte.de/) phylogeny of 31 genera well-detected in both the 16S and metagenomic profiles. The two measurement types generally agreed well (mean spearman ρ = 0.67). A total of 27 core genera from the shotgun data matched best with taxonomically identical taxa in the 16S data. The remaining four genera, eggerthella, blautia, oscillibacter, and subdoligranulum, showed highest correlation with a genus from the clostridiales order, predominantly in the unclassified clostridiales. See also Figure S1; Table S1.
Figure 2.
Figure 2.. Functional and Microbial Deviations in Obesity and Type 2 Diabetes
(A) Alpha-diversity (total unique phylogenetic branch length) was significantly reduced in obese subjects (compared to LH) (p = 3.20×10⁻¹¹ by robust regression, 16S data) while not significantly different between obese with and without T2D (p = 0.92, ObH versus ObT2D). (B) Microbial dispersion was significantly increased in obese subjects as compared to LH (q = 0.023), but not significant between ObH and ObT2D (q = 0.16; Table S2). The illustration was generated using all subjects with 16S data and the betadisper function in R package vegan. (C) Analysis of individual taxa for association with ObT2D identified limited taxonomic variation in T2D (Table S3). After adjusting for insulin and metformin usage, no genera remained significantly associated after correcting for multiple testing. Escherichia possesses properties functionally relevant for T2D, and presented with a nominal increased abundance (p = 0.025) that however was not robust after multiple testing correction. (D) Analysis of individual taxa for association with obesity identified 17 genera, including prevotella and alistipes (LH versus ObH, q < 0.1, Table S3). Associations were detected using 16S-based genera abundance profiles and MaAsLin generalized linear model (STAR Methods). (E) Analysis of microbial processes (MetaCyc, iGO, EC, and KO) identified 22 clusters, comprising 97 features (see Table S3), associated with obesity (q < 0.1). Two plots are used for optimal visualization of all features (top and bottom). One feature from each associated cluster was selected to annotate the panel and may not be the cluster-representative feature. See Table S1 for a full overview of functional clusters. Associated processes were detected using MaAsLin-generalized linear model and metagenomic functional profiles (STAR Methods). Boxplots were made with R function boxplot with default settings (whiskers extend 1.5 times the interquartile range). ***: q < 0.01, **: 0.01 ≤ q < 0.05, *: 0.05 ≤ q < 0.1. Summary statistics and full lists of associated functional features and taxa are found in Table S3.
Figure 3.
Figure 3.. Overall Microbiome Composition and Functional Capacity Associate with Diet, Dietary Supplements, and Medication Intake
(A) Evaluation of associations between external factors, comprising dietary nutrients, dietary supplements and medication classes, and the gut microbiome (metagenomic data), showed clear associations albeit with small effects. The percentage of variation explained and the significance of the associations between the gut microbiome (x axis) and external parameters, together with age, gender and bmi (y axis), was evaluated using adonis (top three rows). Furthermore, the correspondence between diet and medication profiles (four drug classes, dietary nutrients, and dietary supplements) and the microbiome, was evaluated using mantel (fourth row). Finally, the effect of high (500 ppm) and sufficient (50 ppm) iron diets on the microbiome composition was evaluated under controlled circumstances in a mouse study using a linear mixed model (fifth row). For adonis, variance explained was calculated using ω instead of r2 to limit overfitting, and significance was estimated using permutation of samples (see STAR Methods). Percentage variance explained was calculated for mantel analyses as mantel(r)-squared. Both mantel and adonis was performed across all non-diabetic subjects. ***q ≤ 0.001; **0.001 < q ≤ 0.01; *0.01 < q ≤ 0.05. (B) Schematic overview of the mouse study and collected data. Three groups of eight mice were fed chow for one week (time-point (TP) 0, baseline), after which eight mice were started on an iron diet of 50 ppm ferrous sulfate and another eight mice were started on 500 ppm ferrous sulfate iron. Mice were kept on the respective diets for seven weeks during which stool was collected weekly for microbiome profiling (except week five, week of GTT). Furthermore, extensive phenotypic information was collected on a weekly basis. (C) Non-linear dimensionality reduction of the mice stool microbiome(Rtsne function in r package Rtsne v0.15 based on OTU tables with Bray-Curtis dissimilarity and perplexity = 10) show clustering of mice on chow and the two iron diets [50 ppm and 500 ppm; (Krijthe, 2015)]. Points are colored by diet and numbered according to time-point (six time-points where mice were kept on different diets and stool collected). The microbiome of mice on different diets are clearly distinct, with the strongest separation between mice on chow versus the iron diets. For one mouse on chow, and one mouse on 50 ppm iron, the second timepoint cluster with the opposite diet group, suggesting that sample IDs for these two samples were swabbed during processing. ppm: parts per million; nmr: nuclear magnetic resonance; DOS: day of sacrifice; iGO: informative gene ontology; KO: kegg ontology; EC: enzyme commission. Figure relates to Figures S3 and S4, Tables 1 and S6.
Figure 4.
Figure 4.. Serum Metabolite Profiles Associated with Obesity and Type 2 Diabetes
(A) Ordination of 400 metabolite profiles across lean non-diabetic (LH), obese non-diabetic (ObH), and obese T2D (ObT2D) individuals, reflecting a shift in the profiles along the first ordination axis, using multidimensional scaling (MDS) based on gower’s index (capscale function in r package vegan). (B) Correlation of four metabolites with single taxon abundance. All genera and metabolites tested for correlations were found in pre-analysis to associate with obesity. The results from MaAsLin analysis provide intercept and slope for the red line and association statistics are given over each plot. Samples are filtered as by maaslin (STAR Methods). (C and D) A total of 105 metabolites were found to associate with obesity and 19 with T2D (linear model and chi-square test, q < 0.1, Table S5). (C) and (D) show the top five metabolites found by MaAsLin to associate with obesity (LH versus ObH) and T2D (ObH versus ObT2D), respectively. X axes show metabolite residuals after adjusting for age and gender. Boxplots were made with R function boxplot with default settings (whiskers extend 1.5 times the interquartile range). Summary statistics are in Table S5.

Comment in

Similar articles

Cited by

References

    1. Ahmed K, Tunaru S, Langhans CD, Hanson J, Michalski CW, Kölker S, Jones PM, Okun JG, and Offermanns S (2009). Deorphanization of GPR109B as a receptor for the β-oxidation intermediate 3-OH-octanoic acid and its role in the regulation of lipolysis. J. Biol. Chem 284, 21928–21933. - PMC - PubMed
    1. Aron-Wisnewsky J, Prifti E, Belda E, Ichou F, Kayser BD, Dao MC, Verger EO, Hedjazi L, Bouillot JL, Chevallier JM, et al. (2019). Major microbiota dysbiosis in severe obesity: fate after bariatric surgery. Gut 68, 70–82. - PMC - PubMed
    1. Ashburner M, Ball CA, Blake JA, Botstein D, Butler H, Cherry JM, Davis AP, Dolinski K, Dwight SS, Eppig JT, et al. (2000). Gene ontology: tool for the unification of biology. The Gene Ontology Consortium. Nat. Genet 25, 25–29. - PMC - PubMed
    1. Bairoch A (2000). The ENZYME database in 2000. Nucleic Acids Res. 28, 304–305. - PMC - PubMed
    1. Bao W, Rong Y, Rong S, and Liu L (2012). Dietary iron intake, body iron stores, and the risk of type 2 diabetes: a systematic review and meta-analysis. BMC Med. 10, 119. - PMC - PubMed

Publication types

MeSH terms