. 2019 Sep 12;146(17):dev175315.
doi: 10.1242/dev.175315.

Lactate dehydrogenase and glycerol-3-phosphate dehydrogenase cooperatively regulate growth and carbohydrate metabolism during Drosophila melanogaster larval development

Affiliations

Lactate dehydrogenase and glycerol-3-phosphate dehydrogenase cooperatively regulate growth and carbohydrate metabolism during Drosophila melanogaster larval development

Hongde Li et al. Development. .

Abstract

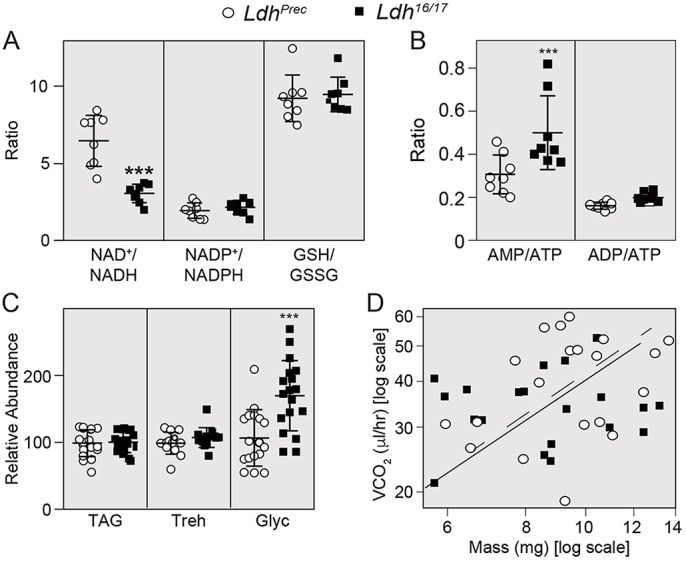
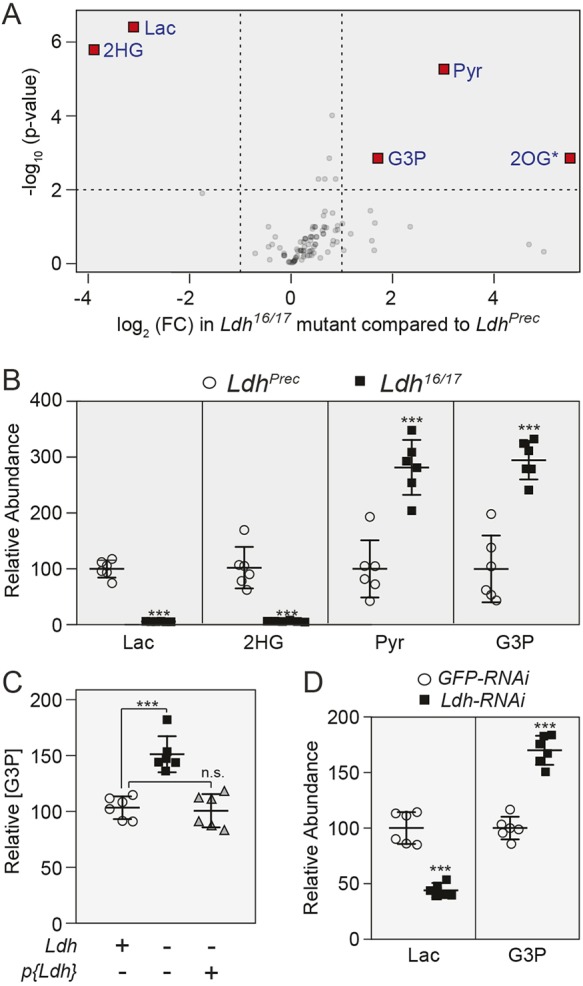
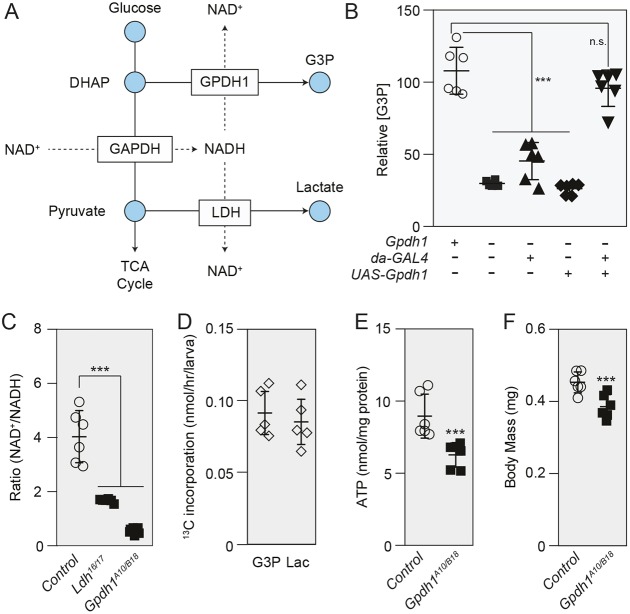
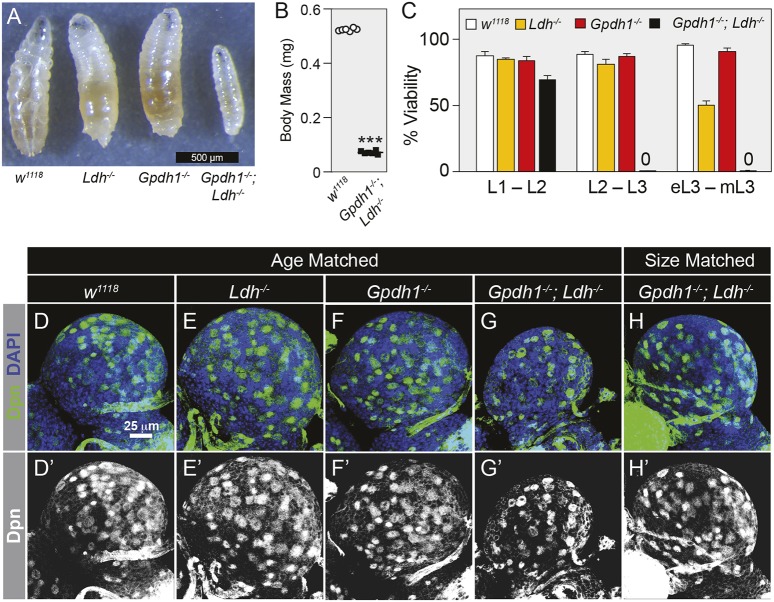
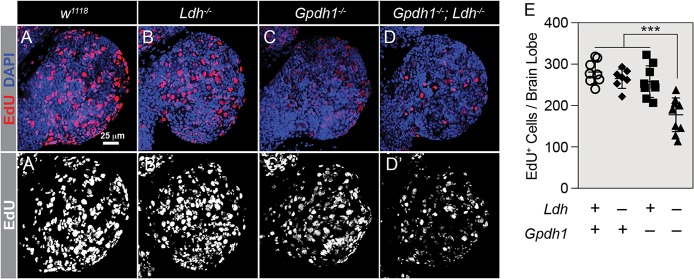
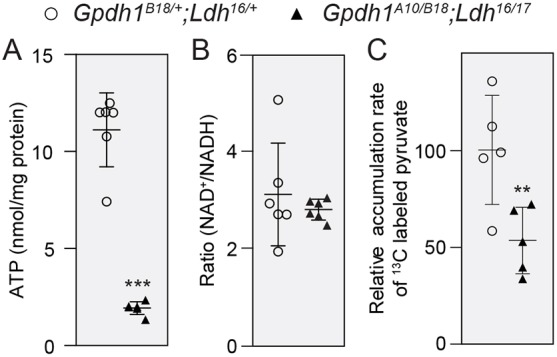
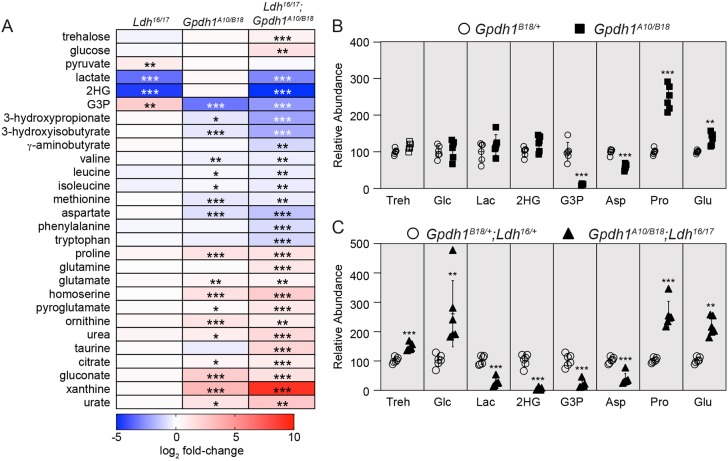
The dramatic growth that occurs during Drosophila larval development requires rapid conversion of nutrients into biomass. Many larval tissues respond to these biosynthetic demands by increasing carbohydrate metabolism and lactate dehydrogenase (LDH) activity. The resulting metabolic program is ideally suited for synthesis of macromolecules and mimics the manner by which cancer cells rely on aerobic glycolysis. To explore the potential role of Drosophila LDH in promoting biosynthesis, we examined how Ldh mutations influence larval development. Our studies unexpectedly found that Ldh mutants grow at a normal rate, indicating that LDH is dispensable for larval biomass production. However, subsequent metabolomic analyses suggested that Ldh mutants compensate for the inability to produce lactate by generating excess glycerol-3-phosphate (G3P), the production of which also influences larval redox balance. Consistent with this possibility, larvae lacking both LDH and G3P dehydrogenase (GPDH1) exhibit growth defects, synthetic lethality and decreased glycolytic flux. Considering that human cells also generate G3P upon inhibition of lactate dehydrogenase A (LDHA), our findings hint at a conserved mechanism in which the coordinate regulation of lactate and G3P synthesis imparts metabolic robustness to growing animal tissues.

Keywords: Aerobic glycolysis; Drosophila; Glycerol-3-phosphate dehydrogenase; Lactate dehydrogenase; Redox balance.


Conflict of interest statement

Competing interestsThe authors declare no competing or financial interests.

Figures

Fig. 1.
Fig. 1.
LDH maintains the NAD+/NADH redox balance during larval development. Targeted LC-MS/MS analysis was used to measure metabolites associated with redox balance in Ldhprec controls and Ldh16/17 mutants. (A,B) The ratios of NAD+/NADH, NADP+/NADPH, GSH/GSSG, AMP/ATP and ADP/ATP were determined in control and mutant larvae; n=8 biological replicates were collected from independent populations with 100 mid-L2 larvae per sample. Experiments were repeated twice (see Table S1). (C) Ldhprec controls and Ldh16/17 mutants were collected as mid-L2 larvae and the concentration of triglycerides (TAG), trehalose (Treh) and glycogen (Glyc) were measured in whole animal homogenates. All assays were repeated a minimum of three times; n>10 samples collected from independent populations with 25 mid-L2 larvae per sample. Absolute values for all samples illustrated in C are available in Table S2. (D) The rate of CO2 production was measured in Ldh16/17 mutants and precise excision controls. Diagonal lines represent the slope relating log(mass) and log(metabolic rate) for Ldhprec (broken line) or Ldh16/17 (unbroken line). Error bars represent s.d.; ***P<0.001.
Fig. 2.
Fig. 2.
Metabolomic analysis of Ldh mutants. Data from GC-MS metabolomic analysis (Table S4) comparing Ldhprec controls and Ldh16/17 mutants were analyzed using Metaboanalyst. (A) Volcano plot highlighting metabolites that exhibited a >1.5-fold change and a P-value of <0.01. Note that changes in 2OG levels were not reproducible in subsequent experiments. (B) Relative abundance of metabolites that exhibited significant changes in all four GC-MS experiments (P<0.01; see Table S3). (C) Relative abundance of G3P was measured in Ldhprec controls, Ldh16/17 mutants and p{Ldh}; Ldh16/17 rescued animals during the L2 larval stage. (D) Lactate and G3P levels were measured in L2 larvae that ubiquitously expressed either a UAS-GFP-RNAi construct or a UAS-Ldh-RNAi construct under the control of da-GAL4. For all panels, n=6 biological replicates were collected from independent populations with 25 mid-L2 larvae per sample. For C and D, experiments were repeated twice; ***P<0.001. 2HG, 2-hydroxyglutarate; 2OG, 2-oxoglutarate; G3P, glycerol-3-phosphate; Lac, lactate; n.s., not significant; Pyr, pyruvate.
Fig. 3.
Fig. 3.
GPDH1 controls NAD+/NADH redox balance during larval development. (A) Diagram illustrating how GPDH1 and LDH redundantly influence NAD+ levels. (B) GC-MS was used to measure relative G3P abundance in mid-L2 larvae for the following five genotypes (as presented left to right in the figure): Gpdh1B18/+, Gpdh1A10/B18, Gpdh1A10/B18; da-GAL4/+, GpdhA10/B18; UAS-Gpdh1 and Gpdh1A10/B18; da-GAL4 UAS-Gpdh1. (C) NAD+/NADH ratio in mid-L2 larvae of genotypes Gpdh1B18/+, Ldh16/17 and Gpdh1A10/B18. (D) Mid-L2 larvae were fed D-glucose-13C6 for 2 h and the rates of 13C isotope incorporation into lactate and G3P were determined based on m+3 isotopologue abundance. (E) ATP levels were significantly decreased in Gpdh1A10/B18 compared with Gpdh1B18/+ controls. (F) The body mass of Gpdh1A10/B18 larvae was significantly lower than that of Gpdh1B18/+ controls 0-4 h after the L2-L3 molt. In B,C,E,F, n=6 biological replicates per genotype; in D, n=5 biological replicates per genotype. Error bars represent s.d. For B and C, the P-value was adjusted for multiple comparisons using the Bonferroni–Dunn method; ***P<0.001. All experiments were repeated a minimum of two times. G3P, glycerol-3-phosphate; DHAP, dihydroxyacetone phosphate; Lac, lactate.
Fig. 4.
Fig. 4.
Gpdh1; Ldh double mutants exhibit severe growth phenotypes. (A) Representative images of L2 larvae (68-72 h after egg laying) from synchronized populations of w1118, Ldh16/17, Gpdh1A10/B18 or Gpdh1A10/B18; Ldh16/17 double mutants. (B) The body mass of w1118 and Gpdh1A10/B18; Ldh16/17 double-mutant larvae measured 68-72 h after egg-laying. (C) The viability of the four genotypes listed in A were measured from 0-4 h post-hatching until after completion of the L1-L2 molt (L1-L2), 0-4 h after the L1-L2 molt until after completion of the L2-L3 molt (L2-L3), and from 0-4 h after the L2-L3 molt until the mid-L3 stage (eL3-mL3). In B and C, error bars represent s.d.; n=6 biological replicates per genotype. (D-H) Maximum projections of dorsal half of L2 larval brains stained for Dpn (green) and DAPI (blue) from w1118 controls (D), Ldh16/17 mutants (E), Gpdh1A10/B18 mutants (F), age-matched Gpdh1A10/B18; Ldh16/17 double mutants (G) and size-matched Gpdh1A10/B18; Ldh16/17 double mutants (H). The scale bar in D also applies to E-H. Note that D′-H′ display the Dpn channel alone in grayscale. ***P<0.001.
Fig. 5.
Fig. 5.
EdU labeling of Gpdh1; Ldh double mutants. (A-D) Maximum projections of the dorsal half of size-matched L2 larval brains stained with EdU (red) and DAPI (blue) from w1118 controls (A), Ldh16/17 mutants (B), Gpdh1A10/B18 mutants (C) and Gpdh1A10/B18; Ldh16/17 double mutants (D). The scale bar in A applies to A-D. Note that A′-D′ display EdU staining alone in grayscale. (E) Histogram of the number of EdU-positive cells per dorsal brain lobe per genotype. Error bars represent s.d. P-value adjusted for multiple comparisons using the Bonferroni–Dunn method; ***P<0.001.
Fig. 6.
Fig. 6.
ATP homeostasis and glycolytic flux are disrupted in Gpdh1; Ldh double mutants. (A-C) Size-matched Gpdh1A10/B18; Ldh16/17 double mutants and Gpdh1B18/+; Ldh16/+ control larvae were collected at the mid-L2 stage and evaluated for changes in ATP (A), NAD+/NADH ratio (B) and the relative metabolic flux rates from 13C6-glucose into pyruvate (C). For all panels, error bars represent s.d.; n=6 biological replicates in A and B; n=5 biological replicates in C. Each experiment was repeated twice. **P<0.01. ***P<0.001.
Fig. 7.
Fig. 7.
Amino acid and glucose metabolism are disrupted in Gpdh1; Ldh double mutants. (A) Heat map summarizing changes in metabolite abundance in Ldh16/17 mutants relative to Ldhprec controls, Gpdh1A10/B18 mutants relative to Gpdh1B18/+ controls, and Gpdh1A10/B18; Ldh16/17 double mutants relative to size-matched Gpdh1B18/+; Ldh16/+ controls. (B,C) Abundance of select metabolites for either Gpdh1A10/B18 mutants relative to Gpdh1B18/+ controls (B) or size-matched Gpdh1A10/B18; Ldh16/17 double mutants relative to Gpdh1B18/+; Ldh16/+ (C). Asp, aspartate; G3P, glycerol-3-phosphate; Glc, glucose; Glu, glutamate; 2HG, 2-hydroxyglutarate; Lac, lactate; Pro, proline; Treh, trehalose. For all panels, n=6 biological replicates per genotype. Each experiment was repeated twice. Error bars represent s.d. P-values adjusted for multiple comparisons using the Bonferroni–Dunn method; *P<0.05, **P<0.01, ***P<0.001.

References

    1. Arrese E. L. and Soulages J. L. (2010). Insect fat body: energy, metabolism, and regulation. Annu. Rev. Entomol. 55, 207-225. 10.1146/annurev-ento-112408-085356 - DOI - PMC - PubMed
    1. Avi-Dor Y. and Mager J. (1956). The effect of fluoropyruvate on the respiration of animal-tissue preparations. Biochem. J. 63, 613-618. 10.1042/bj0630613 - DOI - PMC - PubMed
    1. Backhaus B., Sulkowski E. and Schlote F. (1984). A semi-synthetic, general-purpose medium for Drosophila melanogaster. Dros. Inf. Serv. 60, 210-212.
    1. Bewley G. C. and Lucchesi J. C. (1977). Origin of alpha-glycerophosphate dehydrogenase isozymes in Drosophila melanogaster and their functional relationship in the alpha-glycerophosphate cycle. Biochem. Genet. 15, 235-251. 10.1007/BF00484456 - DOI - PubMed
    1. Billiard J., Dennison J. B., Briand J., Annan R. S., Chai D., Colón M., Dodson C. S., Gilbert S. A., Greshock J., Jing J. et al. (2013). Quinoline 3-sulfonamides inhibit lactate dehydrogenase A and reverse aerobic glycolysis in cancer cells. Cancer Metab. 1, 19 10.1186/2049-3002-1-19 - DOI - PMC - PubMed

Publication types

MeSH terms

LinkOut - more resources