. 2019 Sep 12;12(9):dmm038828.
doi: 10.1242/dmm.038828.

A new mouse model of GLUT1 deficiency syndrome exhibits abnormal sleep-wake patterns and alterations of glucose kinetics in the brain

Affiliations

A new mouse model of GLUT1 deficiency syndrome exhibits abnormal sleep-wake patterns and alterations of glucose kinetics in the brain

Tamio Furuse et al. Dis Model Mech. .

Abstract

Dysfunction of glucose transporter 1 (GLUT1) proteins causes infantile epilepsy, which is designated as a GLUT1 deficiency syndrome (GLUT1DS; OMIM #606777). Patients with GLUT1DS display varied clinical phenotypes, such as infantile seizures, ataxia, severe mental retardation with learning disabilities, delayed development, hypoglycorrhachia, and other varied symptoms. Glut1Rgsc200 mutant mice mutagenized with N-ethyl-N-nitrosourea (ENU) carry a missense mutation in the Glut1 gene that results in amino acid substitution at the 324th residue of the GLUT1 protein. In this study, these mutants exhibited various phenotypes, including embryonic lethality of homozygotes, a decreased cerebrospinal-fluid glucose value, deficits in contextual learning, a reduction in body size, seizure-like behavior and abnormal electroencephalogram (EEG) patterns. During EEG recording, the abnormality occurred spontaneously, whereas the seizure-like phenotypes were not observed at the same time. In sleep-wake analysis using EEG recording, heterozygotes exhibited a longer duration of wake times and shorter duration of non-rapid eye movement (NREM) sleep time. The shortened period of NREM sleep and prolonged duration of the wake period may resemble the sleep disturbances commonly observed in patients with GLUT1DS and other epilepsy disorders. Interestingly, an in vivo kinetic analysis of glucose utilization by positron emission tomography with 2-deoxy-2-[fluorine-18]fluoro-D-glucose imaging revealed that glucose transportation was reduced, whereas hexokinase activity and glucose metabolism were enhanced. These results indicate that a Glut1Rgsc200 mutant is a useful tool for elucidating the molecular mechanisms of GLUT1DS.This article has an associated First Person interview with the joint first authors of the paper.

Keywords: ENU mutagenesis; Epilepsy; GLUT1DS; Glucose transporter 1.


Conflict of interest statement

Competing interestsThe authors declare no competing or financial interests.

Figures

Fig. 1.
Fig. 1.
Mutant mouse line M100200 carries a missense mutation in the Glut1 gene. (A-C) Visible seizures observed in the M100200 mutant. Immobility (A) and convulsive seizure (B) started suddenly with vocalization, ataxic gait (C), lowered posture (C) and slow movement. The symptoms started 30-60 min after mice were transferred to a new home cage or open field. When the mutants are immobile, they continuously open their eyes and sometimes move their vibrissae. (D) Haplotype analysis of the N2 progeny of M100200 crossed with B6. Genetic markers are listed on the left side of the panel. The black boxes represent the homozygotes of B6 and the white boxes represent the heterozygotes of B6 and D2. The numbers of progeny that inherited each haplotype are shown at the bottom. ‘I’ indicates mouse groups that exhibited immobility. (E) Haplotype analysis of N4 and N5 progeny of M100200 crossed with C3 mice. Genetic markers are listed on the left side of the panel. The black boxes represent the heterozygotes of B6 and C3, and the white boxes represent the homozygotes of C3. The numbers of progeny that inherited each haplotype are shown at the bottom. ‘I’ indicates the mice groups that exhibited immobility. (F) Genetic map of M100200 constructed from the backcrossed progeny of G1 mice. Genetic markers are listed on the right. (G) Sequence traces from wild types and heterozygotes. The T-to-C substitution is highlighted with an asterisk and corresponds to a point mutation in exon 7 of Glut1. (H) Alignment of the 8th transmembrane domain of wild-type GLUT1 protein with that of the mutant allele. Conserved amino acid sequences are highlighted in black. The T-to-C mutation results in an amino acid substitution in the 8th transmembrane domain of GLUT1.
Fig. 2.
Fig. 2.
Embryonic lethality in homozygotes, and body weight loss, increased transcription of the Glut1 gene and decreased level of CSF glucose in heterozygotes. (A) Expression of the Glut1 gene in the forebrain. The average mRNA level of Glut1 relative to β-actin is shown. The Glut1 mRNA obtained from forebrain was increased in heterozygotes relative to wild types. Male mice, n=4 of each genotype. Student's t-test, t6=−2.908, P<0.03. (B) Macroscopic observation of fetuses in uteruses at E13.5. Wild types (left), heterozygotes (middle) and homozygotes (right) conformed to Mendel's law in uteruses of recipient ICR females. Homozygote fetuses exhibited abnormal morphology and developmental defects but the exterior morphology of heterozygote fetuses was normal. (C) Macroscopic observation of fetuses in uteruses at E17.5. No homozygotes existed in uteruses of recipient ICR females. Morphological abnormality was not observed exteriorly in wild-type (left) and heterozygote (right) fetuses. (D) Age-dependent body-weight change of wild types and heterozygotes. Body weight of the wild-type and heterozygote mice were measured after the mice had been weaned (4 weeks of age). Body weight of the heterozygotes was significantly decreased relative to wild types (repeated-measures ANOVA). Significant interaction between the genotype of Glut1 and age was not detected. Male mice, n=10 of each genotype. Repeated measures ANOVA, genotype, F1,306=158.450, P<0.0001; age, F1,16=39.798, P<0.0001; interaction between genotype and age, F1,16=1.021, P>0.4. (E) Blood glucose level. There was no significant difference between wild-type and heterozygote mice in blood glucose value. Student's t-test, t22=0.305, P>0.76. (F) CSF glucose level. CSF glucose values were significantly decreased in heterozygotes relative to wild-type mice. Student's t-test, t22=3.126, **P<0.005. (G) CSF:blood ratio of glucose value. CSF:blood ratio of glucose value was significantly decreased in heterozygotes relative to wild-type mice. Student's t-test, t22=3.98, **P<0.0007. (E-G) Male mice at 14 weeks of age, n=12 of each genotype. (A-G) Error bars represent the s.e.m.
Fig. 3.
Fig. 3.
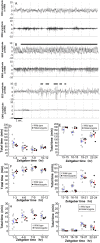
Electrographic seizures and decreased sleep in heterozygotes of Glut1Rgsc200. (A,B) Electrographic seizures observed in heterozygotes. (C) Interictal discharge observed in heterozygotes. (B,C) Horizontal bars indicate appearances of the interictal discharge. (A-C) EEG and EMG recorded from heterozygotes. Upper waveforms show the EEGs and lower waveforms show the EMGs. The EEG signal was amplified 5000-fold and EMG signal was amplified 2000-fold. These amplified signals were converted to the waveform of 16-bit±10 V data. The x-axes indicate time scale (in 1-s bins) and y-axes indicate amplitude. (D-I) Change of sleep-wake state per 3-h interval. (D,E) Wake, (F-G) NREM sleep, (H,I) REM sleep time. (D-I) Individual data points are plotted. White circles indicate wild types and black circles indicate heterozygotes. The data from individual mice are presented as the group mean±s.e.m. Horizontal lines represent the mean and vertical lines represent the s.e.m. (blue lines, wild type; red lines, heterozygotes). Zeitgeber time (ZT): time lapse from light turned on in the experiment room. Results of the one-way repeated measures ANOVA: (D) wake during light period, effect of genotype, F1,10=1.5341, P>0.25; effect of increment of ZT, F3,30=10.6735, P<0.0001; interaction between genotype and increment of ZT, F3,30=0.9562, P>0.4; (E) wake during dark period, effect of genotype, F1,10=7.4648, P<0.022; effect of increment of ZT, F3,30=47.9121, P<0.0001; interaction between genotype and increment of ZT, F3,30=1.0681, P<0.37737; (F) NREM sleep during light period, effect of genotype, F1,10=4.9636, P>0.05; effect of increment of ZT, F3,30=9.6638, P<0.0001; interaction between genotype and increment of ZT, F3,30=0.8496, P>0.4; (G) NREM sleep during dark period, effect of genotype, F1,10=7.3703, P<0.03; effect of increment of ZT, F3,30=49.3272, P<0.0001; interaction between genotype and increment of ZT, F3,30=1.4120, P>0.25; (H) REM sleep during light period, effect of genotype, F1,10=2.1955, P>0.16; effect of increment of ZT, F3,30=12.2923, P<0.0001; interaction between genotype and increment of ZT, F3,30=1.3697, P<0.2709; (I) REM sleep during dark period, effect of genotype, F1,10=2.0277, P>0.18; effect of increment of ZT, F3,30=21.7062, P<0.0001; interaction between genotype and increment of ZT, F3,30=0.4969, P>0.68.
Fig. 4.
Fig. 4.
In vivo PET imaging with [18F]FDG in awake mice. (A) Mean time-radioactivity curves of [18F]FDG in the whole brain. Standardized uptake value (SUV; g/ml) indicates the regional radioactivity (Bq/ml) per injected radioactivity (Bq/g). Genotype, F1,450=3.862, ***P<0.001, two-way repeated-measures ANOVA. (B) Summed PET images from 1 to 5 min (early phase) and 30 to 60 min (later phase) after injection of [18F]FDG were generated by averaging in each group. (C) The k1 values calculated from time-course change of SUV in various brain regions. (D) The k3 values calculated from time-course change of SUV in various brain regions. (E) Regional cerebral glucose metabolic rate. (A,C-E) Error bars represent the s.e.m. Male mice, n=6; measurements were carried out twice per mouse and mean values were used for statistical analyses; *P<0.05, **P<0.01, ***P<0.001, compared with wild type.
Fig. 5.
Fig. 5.
Behavioral alterations in heterozygotes of Glut1Rgsc200 mutants. (A,B) Impaired contextual learning and normal tone-dependent learning in heterozygotes. (A) Freezing responses pre- and post-training with 3 tone-shock pairs in box A. Pre-train indicates the freezing levels in box A (the shocking chamber) before the onset of training. Context indicates freezing level after training. Freezing level after training in heterozygotes (Het) was significantly lower than wild-type (Wt) mice. Student's t-test, pre-train, t18=0.809, P>0.4; contextual, t18=2.871, *P<0.02. (B) Freezing responses to tone presentation in box B after 3 tone-shock pairs. Pre-tone indicates the freezing levels in box B after training and before the tone testing. Tone indicates the freezing levels in box B during the presentation of tone. Freezing level in heterozygotes at the pre-tone period was significantly higher than in wild-type mice. Student's t-test, pre-tone, t18=−2.324, *P<0.04; tone, t18=−0.1739, P>0.1. (A,B) Male mice at 11 weeks of age, wild type, n=12; heterozygote, n=8. (C-E) Locomotor activity of wild types and heterozygotes of Glut1Rgsc200 mice in their home cages. (C) Mean locomotor activity in the home cage during the dark period. Student's t-test, t18=−3.132, **P<0.006. (D) Mean locomotor activity in the home cage during the light period. Student's t-test, t18=0.221, P>0.8. (E) Mean locomotor activity in the home cage during the dark and the light period. Student's t-test, t18=−0.39, **P<0.0008. (C-E) Male mice, n=10 of each genotype at 10- to 11-weeks of age. (A-E) Error bars represent the s.e.m.

Similar articles

Cited by

References

    1. Akman C. I., Provenzano F., Wang D., Engelstad K., Hinton V., Yu J., Tikofsky R., Ichese M. and De Vivo D. C. (2015). Topography of brain glucose hypometabolism and epileptic network in glucose transporter 1 deficiency. Epilepsy Res. 110, 206-215. 10.1016/j.eplepsyres.2014.11.007 - DOI - PubMed
    1. Badr G. A., Zhang J.-Z., Tang J., Kern T. S. and Ismail-Beigi F. (1999). Glut1 and glut3 expression, but not capillary density, is increased by cobalt chloride in rat cerebrum and retina. Brain Res. Mol. Brain Res. 64, 24-33. 10.1016/S0169-328X(98)00301-5 - DOI - PubMed
    1. Boje K. M. K. (2001). In vivo measurement of blood-brain barrier permeability. Curr Protoc. Neurosci. 15, 7.19.1.- 10.1002/0471142301.ns0719s15 - DOI - PubMed
    1. De Giorgis V. and Veggiotti P. (2013). GLUT1 deficiency syndrome 2013: Current state of the art. Seizure 22, 803-811. 10.1016/j.seizure.2013.07.003 - DOI - PubMed
    1. De Vivo D. C., Trifiletti R. R., Jacobson R. I., Ronen G. M., Behmand R. A. and Harik S. I. (1991). Defective glucose transport across the blood-brain barrier as a cause of persistent hypoglycorrhachia, seizures, and developmental delay. N. Engl. J. Med. 325, 703-709. 10.1056/NEJM199109053251006 - DOI - PubMed

Publication types

MeSH terms

Supplementary concepts