. 2019 Oct;181(2):729-742.
doi: 10.1104/pp.19.00507. Epub 2019 Aug 9.

The Intensity of Manganese Deficiency Strongly Affects Root Endodermal Suberization and Ion Homeostasis

Affiliations

The Intensity of Manganese Deficiency Strongly Affects Root Endodermal Suberization and Ion Homeostasis

Anle Chen et al. Plant Physiol. 2019 Oct.

Abstract

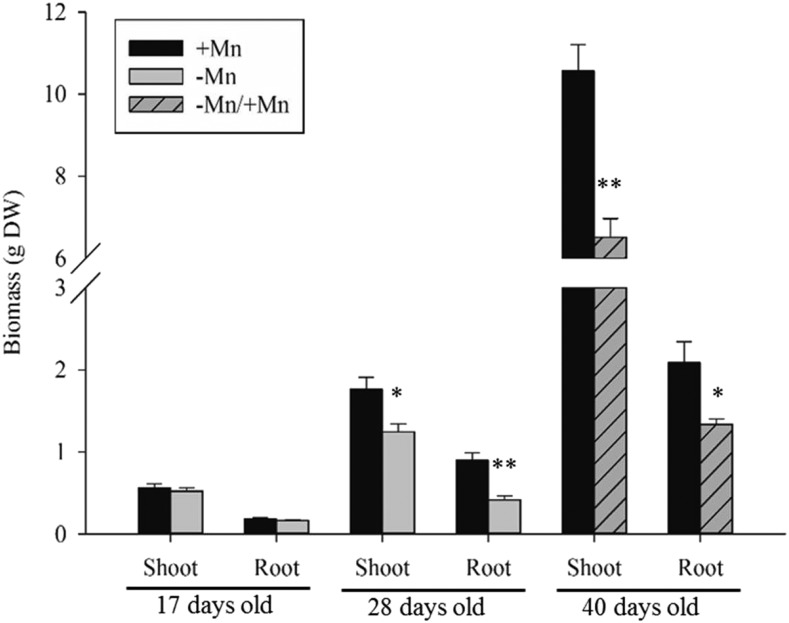
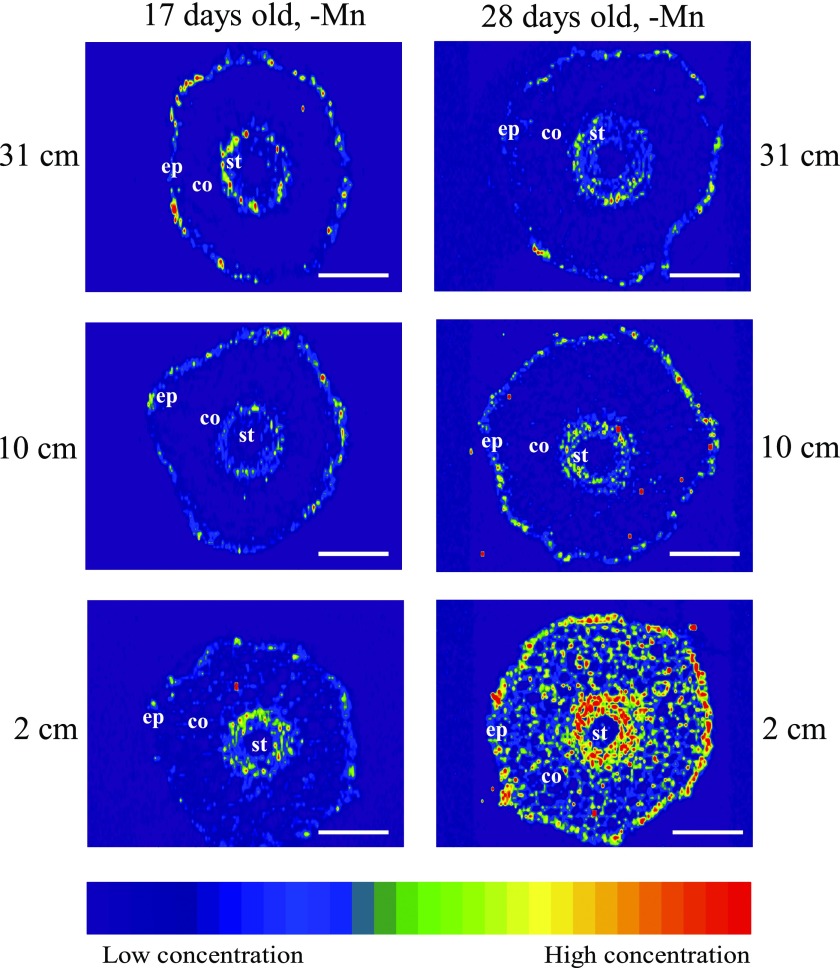
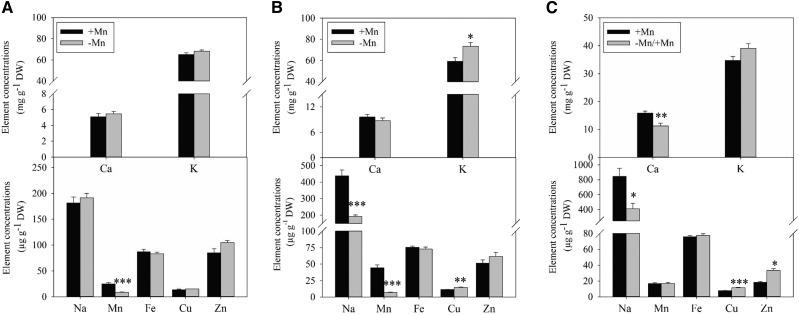
Manganese (Mn) deficiency affects various processes in plant shoots. However, the functions of Mn in roots and the processes involved in root adaptation to Mn deficiency are largely unresolved. Here, we show that the suberization of endodermal cells in barley (Hordeum vulgare) roots is altered in response to Mn deficiency, and that the intensity of Mn deficiency ultimately determines whether suberization increases or decreases. Mild Mn deficiency increased the length of the unsuberized zone close to the root tip, and increased the distance from the root tip at which the fully suberized zone developed. By contrast, strong Mn deficiency increased suberization closer to the root tip. Upon Mn resupply, suberization was identical to that seen on Mn-replete plants. Bioimaging and xylem sap analyses suggest that the reduced suberization in mildly Mn-deficient plants promotes radial Mn transport across the endodermis at a greater distance from the root tip. Less suberin also favors the inwards radial transport of calcium and sodium, but negatively affects the potassium concentration in the stele. During strong Mn deficiency, Mn uptake was directed toward the root tip. Enhanced suberization provides a mechanism to prevent absorbed Mn from leaking out of the stele. With more suberin, the inward radial transport of calcium and sodium decreases, whereas that of potassium increases. We conclude that changes in suberization in response to the intensity of Mn deficiency have a strong effect on root ion homeostasis and ion translocation.


Figures

Figure 1.
Figure 1.
Fv/Fm was used as a proxy for the intensity of Mn deficiency. Mild Mn deficiency (yellow box) was induced 17 d after the start of the experiment, where Fv/Fm was allowed to drop to 0.65 ± 0.02 by adjusting the Mn addition rate. Mild Mn deficiency was continued until d 24, where strong Mn deficiency (red box) was induced by allowing Fv/Fm to drop to 0.55 ± 0.02 until Mn was resupplied at d 30. Resupplying plants with Mn induced a rapid correction of Mn deficiency and from d 34 until the termination of the experiment and at d 40 these plants had the same Fv/Fm as the control (green box; Fv/Fm > 0.8).
Figure 2.
Figure 2.
The dry weight (DW) biomass of 17-, 28-, and 40-d–old plants. Data represents mean values ± se (n = 4–6) for control, deficient (−Mn), and resupplied (−Mn/+Mn) plants. Data were tested with a one-way ANOVA t test, and the asterisks indicate significant differences (*P ≤ 0.05; **P ≤ 0.01) between control and −Mn treatments.
Figure 3.
Figure 3.
Typical suberin patterns in the main root axis of 17-d–old barley roots under control Mn conditions. Suberin was visualized using a GFP filter mounted on a fluorescence microscope after staining whole root segments with FY (left lane) or visualized under bright-field microscopy after staining with Sudan Red 7B (right lane). Four zones were identified, i.e. a nonsuberized zone (zone 1; 0–5 cm), a patchy zone (zone 2; 5–7 cm), a phloem-facing zone (zone 3; 7–30 cm), and a fully suberized zone (zone 4; > 30 cm). The images from zone 1 had no visual suberized cells, whereas in zone 4, all endodermal cells were suberized. Suberized cells in the right lane are indicated by arrows. Scale bars = 100 μm. Mx, metaxylem; Ph, phloem; Xp, xylem poles.
Figure 4.
Figure 4.
Quantification of suberin deposition along the main root axis of 17-, 28-, and 40-d–old plants. The plants were exposed to control (+Mn) or Mn-deficient conditions (−Mn), and the latter resupplied with Mn at day 30 (−Mn/+Mn). The 17-d–old −Mn plants represent mild Mn deficiency and the 28-d–old −Mn plants represent strong Mn deficiency. Four different root zones were identified in 8–10 biological replicates: zone 1 (nonsuberized zone), zone 2 (patchy zone), zone 3 (phloem-facing suberization zone), and zone 4 (fully suberized zone). The length of each zone is expressed in centimeters. Data were analyzed with a one-way ANOVA test, where asterisks indicate significant differences (*P ≤ 0.05; **P ≤ 0.01; ***P ≤ 0.001) between control and Mn treatments. The suberin quantification was performed on two different batches of plants, with similar results.
Figure 5.
Figure 5.
Distribution of Mn in cross sections sampled 10 cm from the root tip (zone 3) and analyzed by LA–ICP–MS with a spot size of 10 μm, monitoring the 55Mn isotope. The 17-d–old −Mn plants represent mild Mn deficiency and the 28-d–old −Mn plants represent strong Mn deficiency. Signal intensities are displayed as a heat map where red represents the strongest intensities and purple the weakest (background). All ion intensities were normalized to endogenous carbon (measured as 13C). Each analysis was repeated three times. co, cortex; ep, epidermis; st, stele. Scale bars = 100 μm.
Figure 6.
Figure 6.
55Mn distribution in root cross sections that are 2- (bottom), 10- (middle), and 31- (upper) cm from the root tip, analyzed by LA–ICP–MS with spot size of 10 μm. All signal intensities were normalized to endogenous carbon (measured as 13C). The images to the left represent 17-d–old, mildly Mn-deficient plants, which had less suberin than the control plants. The images to the right represent 28-d–old, strongly Mn-deficient plants, which have more suberin than nondeficient control plants. The images from 31 cm reflect the differences in suberization, where the −Mn image from the 17-d–old plants represent the phloem-facing (i.e. less suberized) zone 3, whereas the −Mn image from the 28-d–old plants represent the fully suberized zone 4. The signal intensities are displayed as heat maps, where red represents the strongest intensities and purple the weakest intensities. Each analysis was repeated three times. co, cortex; ep, epidermis; st, stele. Scale bars = 100 μm.
Figure 7.
Figure 7.
LA–ICP–MS images of the 55Mn distribution in the stele of root cross sections sampled, 31 cm from the tip. The image to the left represents a mildly Mn-deficient plant, which had less suberin than nondeficient, control plants. The image to the right represents a strongly Mn-deficient plant, which had more suberin than control plants. The images reflect the differences in suberization, where the −Mn image from the 17-d–old plants is from the phloem-facing (i.e. less suberized) zone 3, while the −Mn image from the 28-d–old plants is from the fully suberized zone 4. The signal intensities were normalized to endogenous carbon (13C) and are displayed as heat maps, where red represents the strongest intensities and purple the weakest intensities. Scale bar = 50 μm.
Figure 8.
Figure 8.
Element concentrations in the dry matter of the YFEL of 17- (A), 28- (B), and 40-d–old (C) barley plants. The 17-d–old −Mn plants represent mild Mn deficiency and the 28-d–old −Mn plants represent strong Mn deficiency. Because it takes 7–8 d for the YFEL to develop, the results in (A–C) are from different leaves. The plants were cultivated in a hydroponic system with control (+Mn), Mn-deficient conditions (−Mn), or first Mn-deficient, then resupplied with Mn at d 30 (−Mn/+Mn). Data represents mean values ± se (n = 4), which was tested with a one-way ANOVA t test. Asterisks indicate significant differences (*P ≤ 0.05; **P ≤ 0.01; ***P ≤ 0.001) between control and −Mn treatments. DW, dry weight.
Figure 9.
Figure 9.
Element concentrations in xylem sap from 17- (A), 28- (B), and 40-d–old (C) barley plants. The plants were cultivated in a hydroponic system and the xylem sap was collected from control (+Mn), deficient (−Mn), and first Mn-deficient, then resupplied with Mn at d 30 (−Mn/+Mn). The 17-d–old −Mn plants represent mild Mn deficiency and the 28-d–old −Mn plants represent strong Mn deficiency. Data represents mean values ± se (n = 4), which was tested with a one-way ANOVA t test. Asterisks indicate significant differences (*P ≤ 0.05; **P ≤ 0.01; ***P ≤ 0.001) between control and −Mn treatments.
Figure 10.
Figure 10.
Schematic model of ionic movements from the soil solution toward the xylem in a fully suberized (A) and a nonsuberized (B) stele of barley plants.

References

    1. Alassimone J, Fujita S, Doblas VG, van Dop M, Barberon M, Kalmbach L, Vermeer JE, Rojas-Murcia N, Santuari L, Hardtke CS, et al. (2016) Polarly localized kinase SGN1 is required for Casparian strip integrity and positioning. Nat Plants 2: 16113. - PubMed
    1. Andersen TG, Barberon M, Geldner N (2015) Suberization—the second life of an endodermal cell. Curr Opin Plant Biol 28: 9–15 - PubMed
    1. Andersen TG, Naseer S, Ursache R, Wybouw B, Smet W, De Rybel B, Vermeer JEM, Geldner N (2018) Diffusible repression of cytokinin signalling produces endodermal symmetry and passage cells. Nature 555: 529–533 - PMC - PubMed
    1. Barberon M, Geldner N (2014) Radial transport of nutrients: The plant root as a polarized epithelium. Plant Physiol 166: 528–537 - PMC - PubMed
    1. Barberon M, Vermeer JE, De Bellis D, Wang P, Naseer S, Andersen TG, Humbel BM, Nawrath C, Takano J, Salt DE, et al. (2016) Adaptation of root function by nutrient-induced plasticity of endodermal differentiation. Cell 164: 447–459 - PubMed

Publication types

LinkOut - more resources