. 2019 Sep 18;39(38):7465-7484.
doi: 10.1523/JNEUROSCI.3262-18.2019. Epub 2019 Aug 9.

Rgma-Induced Neo1 Proteolysis Promotes Neural Tube Morphogenesis

Affiliations

Rgma-Induced Neo1 Proteolysis Promotes Neural Tube Morphogenesis

Sharlene Brown et al. J Neurosci. .

Abstract

Neuroepithelial cell (NEC) elongation is one of several key cell behaviors that mediate the tissue-level morphogenetic movements that shape the neural tube (NT), the precursor of the brain and spinal cord. However, the upstream signals that promote NEC elongation have been difficult to tease apart from those regulating apico-basal polarity and hingepoint formation, due to their confounding interdependence. The Repulsive Guidance Molecule a (Rgma)/Neogenin 1 (Neo1) signaling pathway plays a conserved role in NT formation (neurulation) and is reported to regulate both NEC elongation and apico-basal polarity, through signal transduction events that have not been identified. We examine here the role of Rgma/Neo1 signaling in zebrafish (sex unknown), an organism that does not use hingepoints to shape its hindbrain, thereby enabling a direct assessment of the role of this pathway in NEC elongation. We confirm that Rgma/Neo1 signaling is required for microtubule-mediated NEC elongation, and demonstrate via cell transplantation that Neo1 functions cell autonomously to promote elongation. However, in contrast to previous findings, our data do not support a role for this pathway in establishing apical junctional complexes. Last, we provide evidence that Rgma promotes Neo1 glycosylation and intramembrane proteolysis, resulting in the production of a transient, nuclear intracellular fragment (NeoICD). Partial rescue of Neo1a and Rgma knockdown embryos by overexpressing neoICD suggests that this proteolytic cleavage is essential for neurulation. Based on these observations, we propose that RGMA-induced NEO1 proteolysis orchestrates NT morphogenesis by promoting NEC elongation independently of the establishment of apical junctional complexes.SIGNIFICANCE STATEMENT The neural tube, the CNS precursor, is shaped during neurulation. Neural tube defects occur frequently, yet underlying genetic risk factors are poorly understood. Neuroepithelial cell (NEC) elongation is essential for proper completion of neurulation. Thus, connecting NEC elongation with the molecular pathways that control this process is expected to reveal novel neural tube defect risk factors and increase our understanding of NT development. Effectors of cell elongation include microtubules and microtubule-associated proteins; however, upstream regulators remain controversial due to the confounding interdependence of cell elongation and establishment of apico-basal polarity. Here, we reveal that Rgma-Neo1 signaling controls NEC elongation independently of the establishment of apical junctional complexes and identify Rgma-induced Neo1 proteolytic cleavage as a key upstream signaling event.

Keywords: Rgma; cell elongation; microtubules; neogenin; neural tube; regulated intramembrane proteolysis.


Figures

Figure 1.
Figure 1.
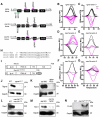
Rgma and Neo1 LOF tools. A, Schematic representation of rgma, neo1a and neo1b loci showing exons (Ex, black boxes) and 5′ and 3′ untranslated regions of the genes (5′UTR and 3′UTR) and target sites for MOs (green bars) and gRNAs (magenta bars). B–G, High-resolution melt analysis of indels in embryos co-injected with HF-nCas9 and gRNAs against rgma exons 2 (B) and 3 (C), neo1a exons 3 (D) and 8 (E), and neo1b exons 3 (F) and 8 (G). Each line indicates relative fluorescence units (RFUs) over a range of temperatures corresponding to individual uninjected (control) 24 h post-fertilization (hpf) embryos (black graph lines) or Cas9/gRNA-coinjected embryos that accumulate mosaic indels in somatic and germ line cells (magenta graph lines). H, Alignment of the neo1a MO2 target sequence to the neo1a and neo1b transcripts. The underlined residues indicate the translational start site. The nucleotides in bold are not conserved. I, Schematic of Neo1a (top) and predicted protein product of neo1aδ1133 mRNA lacking the NeoICD (bottom). S, Signal peptide; IgG, immunoglobulin domain; FN, fibronectin domain; TM, transmembrane domain. J, K, Western blot analysis of Rgma protein levels in embryos injected with multiplexed rgma gRNAs with Cas9 (J) and MO2 (K), compared with uninjected controls and std MO-injected embryos, respectively. L, M, Western blot analysis of Neo1 protein levels in embryos injected with multiplexed neo1a and neo1b gRNAs with Cas9 (L) and neo1a MO2 (L), compared with uninjected controls and std MO-injected embryos, respectively. N, Detection of the FLAG epitope by Western blot in control (uninjected) and neo1aδ1133-FLAG mRNA-injected embryos. Each lane was loaded with 5 μg of total protein with Gapdh used as a loading control (J–N).
Figure 2.
Figure 2.
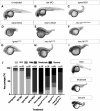
Morphological defects observed in Rgma and Neo1 LOF embryos. A–I, Bright field images of 32 hpf larvae that were uninjected (A) or injected with the following molecular tools: std MO (B), rgma MO1 (C), rgma MO2 (D), neo1a MO2 (E), neo1aδ1133-FLAG (F), rgma gRNA exon 2 + 3 and HF-nCas9 (rgmaex2+3) (G), neo1a gRNA exon 3 + 8 and HF-nCas9 (neo1aex3+8) (H), and neo1b gRNA exon 3 + 8 and HF-nCas9 (neo1bex3+8) (I). Scale bar, 250 μm. J, Distribution of WT and LOF phenotypes in 32 hpf embryos treated as in A–I, with the exception of the last dataset (far right column) showing phenotypic distribution for multiplexed neo1aex3+8 and neo1bex3+8. WT, mild, moderate, and severe phenotypes exhibited 0, 1, 2–3, and 4 or more of the following features, respectively: a shortened anterior–posterior axis, poorly defined brain morphological landmarks, misshaped somites, small eyes, and decreased pigmentation (the latter is indicative of developmental delay). Uninjected: WT = 87%, mild = 6%, moderate = 6%, severe = 0%, n = 63; std MO: WT = 88%, mild = 8%, moderate = 4%, severe = 0%, n = 48; rgma MO1: WT = 58, mild = 9%, moderate = 33%, severe = 0%, n = 99; rgma MO2: WT = 5%, mild = 4%, moderate = 84%, severe = 7%, n = 57; neo1a MO2: WT = 0%, mild = 2%, moderate = 7%, severe = 91%, n = 56; neo1aδ1133-FLAG: WT = 15%, mild = 10%, moderate = 44%, severe = 31%, n = 39; rgmaex2+3: WT = 26%, mild = 17%, moderate = 29%, severe = 28%, n = 69; neo1aex3+8/neo1bex3+8: WT = 7%, mild = 10%, moderate = 67%, severe = 17%, n = 42. Data represent pooled results from 3 independent experiments.
Figure 3.
Figure 3.
Rgma and Neo1a are required for NEC elongation during infolding. A–E, Mosaic mGFP signal (cyan) was detected by immunofluorescence using anti-GFP antibodies along with DAPI counterstain of nuclei (red) on hindbrain transverse sections of 4–5 som embryos that were uninjected (A), injected with neo1a MO2 (B), rgma MO2 (C), neo1a/b gRNA exon 3 + 8 and HF-nCas9 (D), or rgma gRNA exon 2 + 3 and HF-nCas9 (E). Scale bar, 50 μm. A′–E′, Insets, Higher magnification of NEC morphology within the selected regions in A–E. Scale bar, 50 μm. F, Quantification of LWRs of labeled NECs in 5–10 embryos from each group treated as in A–E. G, H, Selected frames from time-lapse imaging of live NECs in control (top) and neo1a MO2-injected (bottom) embryos mosaically labeled with mRFP DNA and imaged in the hindbrain region from a dorsal view, beginning at ∼1–2 som and extending through 5–6 som. I, J, Representative traces of individual labeled cells from control (G) and neo1a MO-injected (H) embryos as in G and H. Colored traces represent changes in shape and position of individual NECs over time. Green trace represents time 0. Yellow trace represents last time point. Red dotted line indicates midline. K, L, The 30° radial grid (rose plot) showing the average cell shape change over time of control, uninjected, and Neo1a-depleted NECs, where 0° and 180° are medial and lateral extremes along the mediolateral axis of the neural keel, respectively.
Figure 4.
Figure 4.
Spatial distribution of zebrafish rgma and neo1a transcripts during NT development. Cross sections at the hindbrain level of zebrafish embryos at the NP (tailbud; A, D,G, J), neural keel (4–5 som; B, E, H, K), and neural rod (8–10 som; C, F, I, L) stages labeled by WISH using an antisense neo1a riboprobe (A–C), a sense neo1a riboprobe (D–F), an rgma antisense riboprobe (G–I), and a sense rgma riboprobe (J–L). Scale bar, 50 μm.
Figure 5.
Figure 5.
Neo1a functions cell autonomously in the neuroepithelium. A, Schematic representation of transplantation to produce chimeras. Cells were taken from the animal pole of shield stage donor embryos labeled with mRFP RNA and transplanted into the animal pole of host embryos at the same developmental stage that were mosaically labeled with mGFP DNA. Red arrows indicate the direction of donor cell movement through the transplantation needle. The host embryos were fixed at 4–5 som and analyzed for NEC morphology. B, C, Transverse sections through the hindbrain of 4–5 som chimeric embryos. mGFP and mRFP-expressing cells were immunolabeled with anti-GFP (yellow) and anti-RFP (cyan) antibodies, respectively. Nuclei were counterstained with DAPI (red). Scale bar, 50 μm. B′–C′, Insets, Higher magnifications of the selected regions in B and C. Scale bar, 25 μm. D, Quantification of the LWR of donor cells from uninjected controls (3.54 ± 0.1 μm, n = 100 cells from 18 embryos) and Neo1a-depleted embryos (1.54 ± 0.1, n = 92 cells from 9 embryos) and that of their control hosts (3.70 ± 0.2, n = 67 cells from 14 embryos and 3.18 ± 0.1, n = 94 cells from 10 embryos, respectively). Data are mean ± SEM.
Figure 6.
Figure 6.
Perturbation of Rgma/Neo1 signaling impairs NP infolding. A, B, WISH using dlx3 and krox20 probes on 4–5 som embryos that underwent timely (A) or delayed development (B). Arrow indicates lateral edge of krox20-positive rhombomere 5, which coincides with the position of the dlx3b-positive otic placode. Dotted line indicates NP width measured at the level of rhombomere 5/otic placode. Scale bar, ∼75 μm. C, Measurements of NP width (as indicated in A, B) of uninjected controls and embryos injected with std MO, rgma MO1, rgma MO2, neo1a MO2, neo1aδ1133-FLAG, rgma gRNA exon 2 + 3 and HF-nCas9 (rgmaex2+3), and neo1a/b gRNA exon 3 + 8 and HF-nCas9 (neo1aex3+8/neo1bex3+8).
Figure 7.
Figure 7.
Rgma depletion disrupts C divisions. A, B, Transverse sections through the hindbrain of 8–10 som control (uninjected, A) and rgma MO2-injected (B) embryos immunolabeled with anti-tubulin (MTs, cyan) and counterstained with DAPI (nuclei, red). Scale bar, 50 μm. A′–B′, Insets, Higher magnification of the boxed regions in A and B showing daughter cells (1 and 2) with the estimated position of the midbody (*). Scale bar, 10 μm. C, Percentage of cell divisions occurring at each azimuthal angle (θ). Control, n = 20 cell divisions from 4 embryos; rgma MO2, n = 26 cell divisions from 6 embryos.
Figure 8.
Figure 8.
Rgma/Neo1a signaling is not required for junctional polarity establishment or maintenance. A–J, Transverse sections through the hindbrain of 1 dpf (A–E, H–J) and 12 som (F, G) embryos that were untreated (A, F, H) or injected with rgma MO2-injected (B, G, I), rgma gRNA exon 2 + 3 and HF-nCas9 (rgmaex2+3), or neo1aδ1133-FLAG (E). Embryos were labeled with phalloidin (F-actin, A–E, syan) or anti-ZO1 (tight junctions, F–J, cyan) and counterstained with DAPI (nuclei, F–J, red). Arrows indicate the formation of ventricles. nc, Visible notochord. Scale bars, 50 μm.
Figure 9.
Figure 9.
Abnormal MT organization in Neo1a- and Rgma-depleted embryos. A–C, Immunofluorescent detection of MTs in transverse hindbrain sections of 4–5 som control (A), neo1a MO2-injected (B), and rgma MO2-injected (C) embryos labeled using anti-β-tubulin antibodies. Nuclei were counterstained with DAPI (red). Double arrow indicates axis of NEC elongation and radial intercalation. Scale bar, 50 μm. A′–C′, Insets, Higher magnification of boxed areas in A–C. Arrows indicate elongated MTs. Arrowheads indicate bundled and short MTs. Scale bar, 25 μm.
Figure 10.
Figure 10.
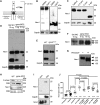
Rgma promotes intramembrane proteolysis of Neo1. A, Diagram of Neo1 embedded in the plasma membrane. Ig, 4 immunoglobulin domains; FN, 6 fibronectin Type III domains; TM, transmembrane domain. *α-Secretase/ADAM17 cleavage site. **γ-Secretase cleavage site. B, Western blot analysis of Neo1 (Neo1a and Neo1b) protein from embryos treated with DMSO vehicle, 100 μm of the α-secretase/ADAM17 inhibitor TAPI-1, 8 ng/μl of the γ-secretase inhibitor DAPT in the presence (first two lanes) or absence (last two lanes) of the proteasome and nuclear export inhibitors MG132 and LMB, respectively. C, Western blot analysis of low-molecular weight Neo1 products (55 and 40 kDa) produced at the tailbud, 4–5 som, 6 som, and 5 dpf stages. Gapdh is shown as a loading control. D, Western blot analysis of endogenous Neo1 levels in protein extract from 24 hpf embryos injected at the 1 cell stage with std MO (10 ng per embryo, left lane) or rgma MO2 (5 and 10 ng per embryo, middle and right lanes, respectively). E, Western blot analysis of endogenous Neo1 levels in protein extract from 32 hpf uninjected embryos (left lane) or embryos injected at the 1 cell stage with rgma gRNA exon 2 + 3 and HF-nCas9 (rgmaex2+3; right lane). F, Overnight exposure of the Western blot shown in D revealing the 225 kDa band (top arrowhead) and a second lower molecular weight band (lower arrowhead, ∼200 kDa) in rgma MO2 lanes (center and right lanes) but only faintly in the control std MO-injected lane (left lane). The signal intensity of both bands is increased in the rgma MO2 lanes. G, Western blot analysis of Neo1 in the absence (left lane) and presence (right lane) of PNGaseF. H, Oxidized glycans, total protein, and Neo1 in rgma MO2-injected embryos relative to std MO-injected controls detected using in-gel periodic acid Schiff assay, Coomassie staining (CBB), and Western blotting, respectively (see Materials and Methods). I, A fractionated lysate was analyzed by immunoblot using Neo1 antibodies. The purified nuclear fraction (Nuc.) and supernatant (Sup.) are shown in left and right lanes, respectively. J, Width of the NP measured at 4–5 som in embryos that were uninjected (123.5 ± 3.60 μm, n = 17), injected at the 1 cell stage with 50 pg of neoICD mRNA (151.8 ± 7.89, n = 17), 50 pg of neoICDmut (231.40 ± 15.58 μm, n = 10), 5 ng neo1a MO2 (414.7 ± 28.81 μm, n = 8), 5 ng neo1a MO2 + 50 pg of neoICD mRNA (322.6 ± 15.68 μm, n = 9), 5 ng neo1a MO2 + 50 pg of neoICDmut (390.90 ± 21.07 μm, n = 9), 5 ng of rgma MO2 (368.90 ± 17.83 μm, n = 10), and 5 ng rgma MO2 + 50 pg of neoICD mRNA (274.60 ± 20.08 μm, n = 5). Data are mean ± SEM. Statistical significance was determined using Tukey's test.

References

    1. Almagro-Moreno S, Kim TK, Skorupski K, Taylor RK (2015) Proteolysis of virulence regulator ToxR is associated with entry of Vibrio cholerae into a dormant state. PLoS Genet 11:e1005145. 10.1371/journal.pgen.1005145 - DOI - PMC - PubMed
    1. Anderson JL, Mulligan TS, Shen MC, Wang H, Scahill CM, Tan FJ, Du SJ, Busch-Nentwich EM, Farber SA (2017) mRNA processing in mutant zebrafish lines generated by chemical and CRISPR-mediated mutagenesis produces unexpected transcripts that escape nonsense-mediated decay. PLOS Genet 13:e1007105. 10.1371/journal.pgen.1007105 - DOI - PMC - PubMed
    1. Andersson M, Turesson H, Olsson N, Fält AS, Ohlsson P, Gonzalez MN, Samuelsson M, Hofvander P (2018) Genome editing in potato via CRISPR-Cas9 ribonucleoprotein delivery. Physiol Plant 164:378–384. 10.1111/ppl.12731 - DOI - PubMed
    1. Avila J, Domínguez J, Díaz-Nido J (1994) Regulation of microtubule dynamics by microtubule-associated protein expression and phosphorylation during neuronal development. Int J Dev Biol 38:13–25. - PubMed
    1. Babitt JL, Zhang Y, Samad TA, Xia Y, Tang J, Campagna JA, Schneyer AL, Woolf CJ, Lin HY (2005) Repulsive guidance molecule (RGMa), a DRAGON homologue, is a bone morphogenetic protein co-receptor. J Biol Chem 280:29820–29827. 10.1074/jbc.M503511200 - DOI - PubMed

Publication types