. 2019 Aug 9;10(1):3626.
doi: 10.1038/s41467-019-11518-w.

The Hsp90 isoforms from S. cerevisiae differ in structure, function and client range

Affiliations

The Hsp90 isoforms from S. cerevisiae differ in structure, function and client range

Hannah Girstmair et al. Nat Commun. .

Abstract

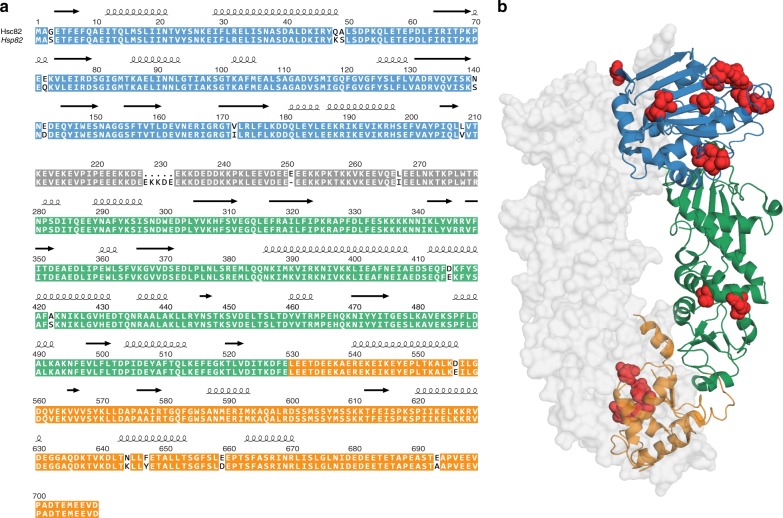
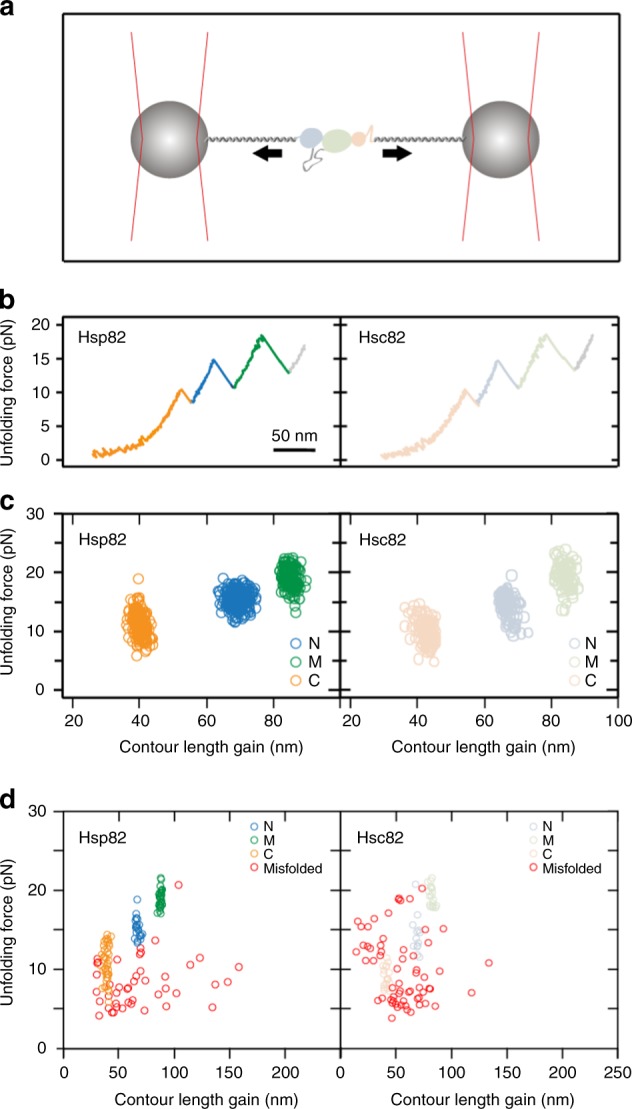
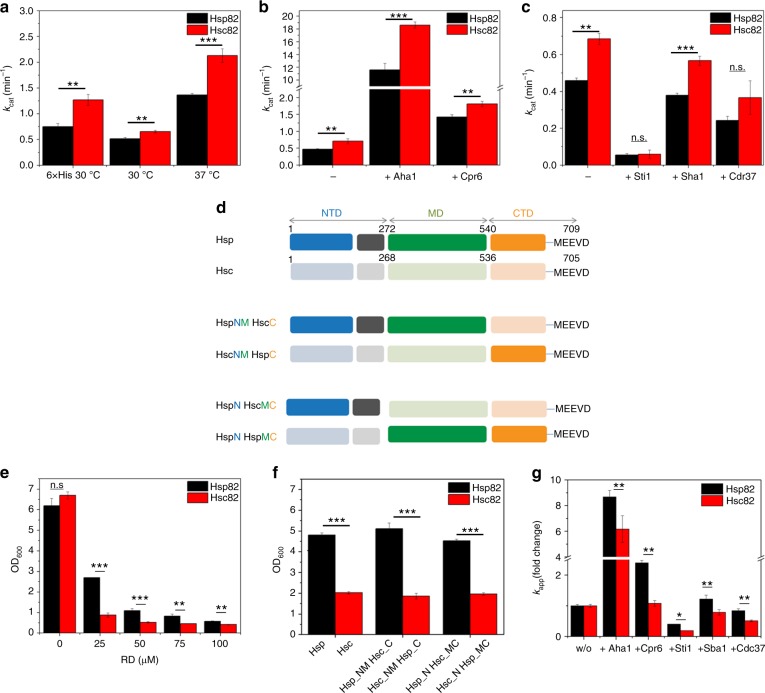
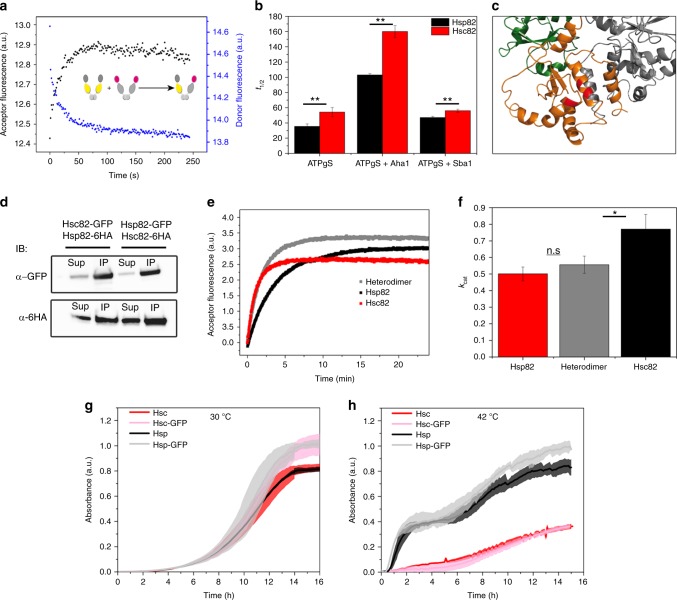
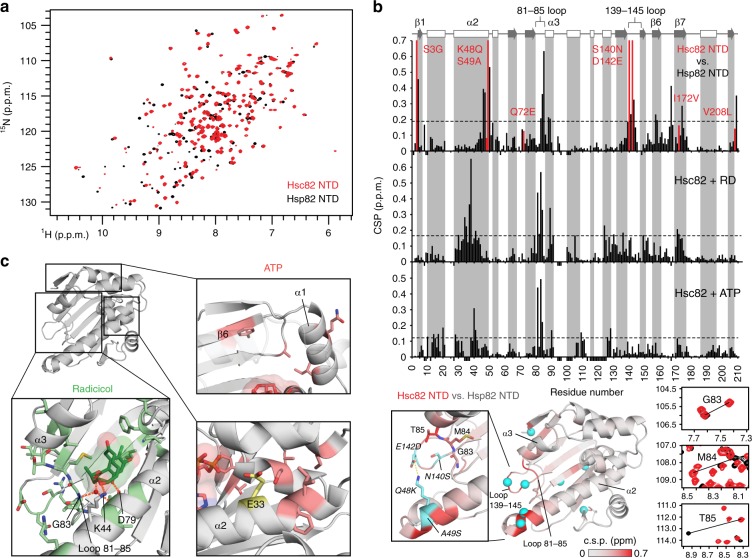
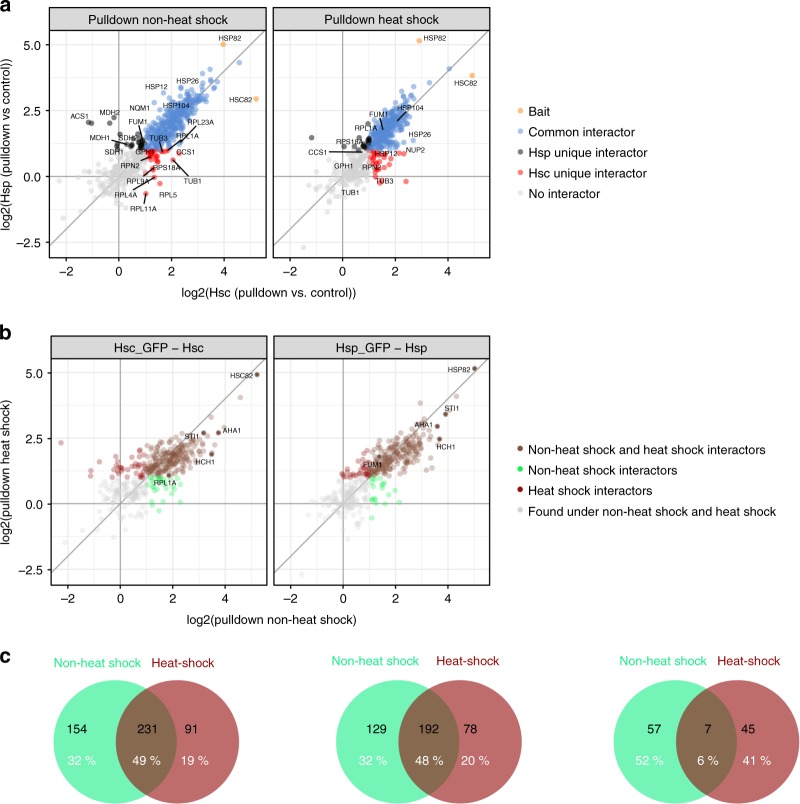
The molecular chaperone Hsp90 is an important regulator of proteostasis. It has remained unclear why S. cerevisiae possesses two Hsp90 isoforms, the constitutively expressed Hsc82 and the stress-inducible Hsp82. Here, we report distinct differences despite a sequence identity of 97%. Consistent with its function under stress conditions, Hsp82 is more stable and refolds more efficiently than Hsc82. The two isoforms also differ in their ATPases and conformational cycles. Hsc82 is more processive and populates closed states to a greater extent. Variations in the N-terminal ATP-binding domain modulate its dynamics and conformational cycle. Despite these differences, the client interactomes are largely identical, but isoform-specific interactors exist both under physiological and heat shock conditions. Taken together, changes mainly in the N-domain create a stress-specific, more resilient protein with a shifted activity profile. Thus, the precise tuning of the Hsp90 isoforms preserves the basic mechanism but adapts it to specific needs.


Conflict of interest statement

The authors declare no competing interests.

Figures

Fig. 1
Fig. 1
Comparison of amino acid sequence and structure of the yeast Hsp90 isoforms. a Sequence alignment of Hsc82 and Hsp82. The NTD of the isoforms is depicted in blue, the charged linker in gray, the MD in green, and the CTD in orange. The differences in amino acid sequence are highlighted in red. b Hsp82 structure in the closed state (PDB ID: 2CG9). Sequence differences between Hsp82 and Hsc82 are highlighted in red
Fig. 2
Fig. 2
Unfolding of Hsp82 and Hsc82. a Schematic depicting how force is applied across the monomer of Hsc82 or Hsp82 using optical trapping (see Methods for details). b Example unfolding traces of Hsp82 (left) and Hsc82 (right) pulled at a constant velocity of 500 nm/s. The traces are colored according to domain. In both these example traces, the CTD is seen to unfold first (shown in orange), followed by the NTD (blue) and finally, the middle domain (green). c Performing repeated force-extension cycles and recording the unfolding forces and contour length gains for each domain results in the scatter plots shown here. The average unfolding forces and contour length gains for Hsp82 and Hsc82 are the same within error (see Table 1). d Repeated force-extension cycles at 500 nm/s with no waiting time at zero force result in large numbers of force-extension traces that do not show the native unfolding pattern. This occurs as a result of inter- and intra-domain misfolds in the monomers of Hsc82 and Hsp82, which is why misfolds with contour length gains longer than those of natively folded domains are common. Here, native mechanical signatures of individual domains are colored according to the domain (blue for the NTD, green for the middle domain, orange for the CTD), and events which did not match the native unfolding signatures for any domains are shown in red. Hsp82 data (left-hand side) is from 38 force-extension cycles for a single molecule, and Hsp82 data (right-hand side) is from 55 force-extension cycles for a single molecule
Fig. 3
Fig. 3
ATPases, RD sensitivity, and closing kinetics of yeast Hsp90 isoforms. For all measurements three technical replicates were used to determine standard deviations. Statistical significance was assessed using a two-sample t-test. The level of significance is indicated (ns: p > 0.05, *p < 0.05, **p < 0.01, ***p < 0.001. a Comparison of the ATPase activity of tagged (6×His) and untagged Hsp82 and Hsc82 at indicated temperatures. ATPase assays were performed in a standard buffer containing 2 mM ATP and a final concentration of 3 µM Hsp90. b The isoforms’ ATPase stimulation by Aha1 or Cpr6 was measured in a low salt buffer containing 40 mM HEPES, pH 7.5, 50 mM KCl, 5 mM MgCl2, 2 mM ATP and a final concentration of 1 µM Hsp82/Hsc82 or 3 µM Hsp82/Hsc82 in the presence of 30 µM Aha1 or 15 µM Cpr6, respectively. c The isoforms’ ATPase inhibition by Sti1, Sba1, and Cdc37 was measured in the low salt buffer containing a final concentration of 3 µM Hsc82/Hsp82 in absence of co-chaperone and in presence of 7.5 µM Sti1, 10 µM Sba1, and 20 µM Cdc37. d Scheme depicting Hsp90 chimeras used for RD assay shown in e. e Yeast expressing either Hsc82 or Hsp82 as the sole Hsp90 source was grown in the absence or presence of indicated concentration of the Hsp90 inhibitor RD. Yeast cell growth was measured after 20 h at OD600. f RD sensitivity of chimera of Hsp82 and Hsc82. The assay was performed as described in e. g Nucleotide-induced closing kinetics of Hsp82 and Hsc82 were recorded by FRET in the presence 2 mM ATPγS, in the absence of co-chaperone, or in the presence of the co-chaperone Aha1, Cpr6, Sti1, Sba1, Cdc37. The fold change (fc) in the closing kinetics constant (kapp) in the presence of co-chaperones compared kapp in the absence of co-chaperones is shown for both isoforms
Fig. 4
Fig. 4
Subunit exchange, closed state stability, and heterodimerization. a Scheme depicting FRET experiment in the absence of a nucleotide used to determine the subunit exchange rate kse. b NTD stability of Hsp82 and Hsc82 was investigated by FRET chase experiments. The chase was induced by adding a tenfold excess of unlabeled Hsp90 to closed Hsp90 FRET complexes that were performed in the presence of 2 mM ATPγS. The apparent half-lives of the complexes were determined in the absence of co-chaperones or in the presence of Aha1 or Sba1. Three technical replicates were used to determine standard deviations. Statistical significance was assessed using a two-sample t-test. The level of significance is indicated (ns: p > 0.05, *p < 0.05, **p < 0.01, ***p < 0.001. c Cartoon representation of the dimerized CTD of Hsp82. Differences in amino acid sequence between the yeast Hsp90 isoforms are highlighted in red. d Yeast strains in which one Hsp90 isoform was GFP-tagged and the other isoform was HA-tagged were used to investigate heterodimerization. Co-immunoprecipitations were performed with an anti-GFP antibody. Western blots were developed with anti-GFP and anti-HA antibodies to determine the fraction of the HA-tagged isoform that co-immunoprecipitates with the GFP-tagged isoform. The supernatant fraction and the co-immunoprecipitated fraction are indicated. e Nucleotide-induced kinetics of Hsp82, Hsc82, and a heterodimer between Hsp82 and Hsc82 followed by FRET in the presence of ATPγS. The increase in acceptor fluorescence signal was followed and fitted to a mono-exponential function to obtain the apparent rate constants kapp. f Comparison of the ATPase activities of Hsp90 isoforms and the heterodimer. Experiments were performed as described in Fig. 3a. Three technical replicates were used to determine standard deviations. The kcat of the heterodimer was compared with the kcat of Hsc82 and Hsp82 using a two-sample t-test. The level of significance is indicated (ns: p > 0.05, *p < 0.05, **p < 0.01, ***p < 0.001). g, h Yeast expressing plasmid-encoded Hsp90 isoforms (from p423GFP plasmids) or their GFP-tagged counterparts (from p425GPD plasmids) were compared in their growth at 30 or 42 °C in rich medium. Standard deviations are derived from three biological replicates
Fig. 5
Fig. 5
Comparison of the NTDs of yeast Hsp90 isoforms by NMR. a Overlay of 1H-15N HSQC spectra of Hsc82 (red) and Hsp82 (black). b Chemical shift perturbation (CSP) of apo-Hsc82 vs. apo-Hsp82 (top), Hsc82+RD (middle), and Hsc82+ATP (bottom). Red bars indicate residues that differ between the two isoforms, negative bars represent residues that are missing. Secondary structure elements derived from NMR secondary chemical shifts using TALOS+ are shown on top (arrow: β-strand: rectangles: α-helix). The CSP comparing isoforms are mapped onto the crystal structure of Hsp82 NTD (PDB id 1AH6, bottom), with isoform-specific residues shown as cyan spheres. Inset shows a close-up view of the C-end of helix α2 and surrounding loops (bold), together with the salt bridge between Lys48 and Asp142 (italic). Panels at the right are zoomed views of the spectra in a showing peak shifts from residues of the 81–85 loop. c Mapping of differential CSPs of the two isoforms upon binding of RD (green sticks) and ATP (red sticks). For RD, regions with higher deviations correspond to loop 81–85, helixes α2, and α3 (bold), while for ATP to strand β6 and helix α1, together with residues surrounding the catalytic residue Glu33
Fig. 6
Fig. 6
Interactors of the yeast Hsp90 isoforms. a Correlation plot of enrichments ratios (pulldown against control) of Hsc-GFP versus Hsp-GFP. Proteins that were significantly enriched (log2 FC ≥ 1, fdr ≤ 0.05) in the pulldowns of both isoforms are categorized as “common interactors”. Proteins that were only significantly enriched (same criteria for enrichment as above) in the pulldown of a single isoform were categorized as Hsp unique or Hsc unique, respectively. b Correlation of interactors under non-heat shock and heat shock conditions. Proteins that were only significantly enriched in the non-heat shock sample (termed non-heat shock interactors) or the heat shock sample (heat-shock interactors) and those that were significantly enriched in both samples are displayed in different colors. Criteria for significant enrichment were the same as in Fig. 6a. c Venn diagrams displaying the overlap of the interactors described in Fig. 6a, b in numbers

Similar articles

Cited by

References

    1. Schopf FH, Biebl MM, Buchner J. The HSP90 chaperone machinery. Nat. Rev. Mol. Cell Biol. 2017;18:345–360. doi: 10.1038/nrm.2017.20. - DOI - PubMed
    1. Zierer BK, et al. Importance of cycle timing for the function of the molecular chaperone Hsp90. Nat. Struct. Mol. Biol. 2016;23:1020–1028. doi: 10.1038/nsmb.3305. - DOI - PMC - PubMed
    1. Jahn M, et al. The charged linker of the molecular chaperone Hsp90 modulates domain contacts and biological function. Proc. Natl Acad. Sci. USA. 2014;111:17881–17886. doi: 10.1073/pnas.1414073111. - DOI - PMC - PubMed
    1. Hessling M, Richter K, Buchner J. Dissection of the ATP-induced conformational cycle of the molecular chaperone Hsp90. Nat. Struct. Mol. Biol. 2009;16:287–293. doi: 10.1038/nsmb.1565. - DOI - PubMed
    1. Rohl A, Rohrberg J, Buchner J. The chaperone Hsp90: changing partners for demanding clients. Trends Biochem. Sci. 2013;38:253–262. doi: 10.1016/j.tibs.2013.02.003. - DOI - PubMed

Publication types

MeSH terms