. 2019 Aug 9;10(1):3623.
doi: 10.1038/s41467-019-11568-0.

MYC competes with MiT/TFE in regulating lysosomal biogenesis and autophagy through an epigenetic rheostat

Affiliations

MYC competes with MiT/TFE in regulating lysosomal biogenesis and autophagy through an epigenetic rheostat

Ida Annunziata et al. Nat Commun. .

Abstract

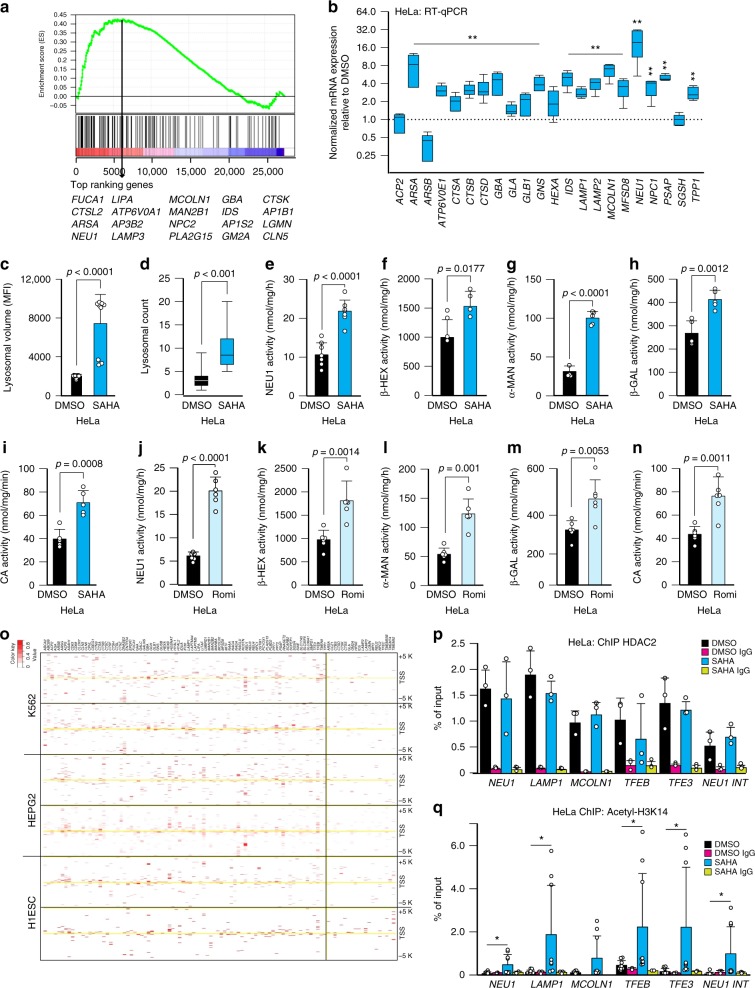
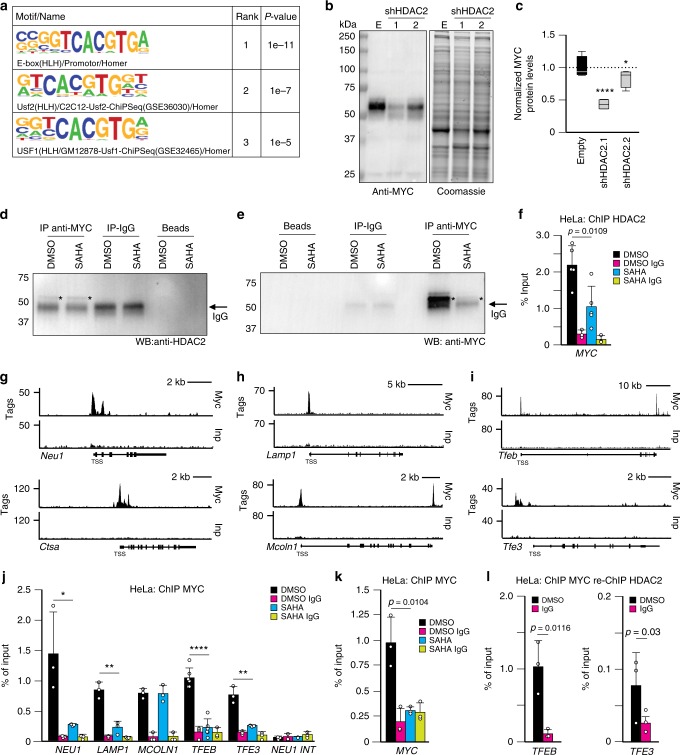
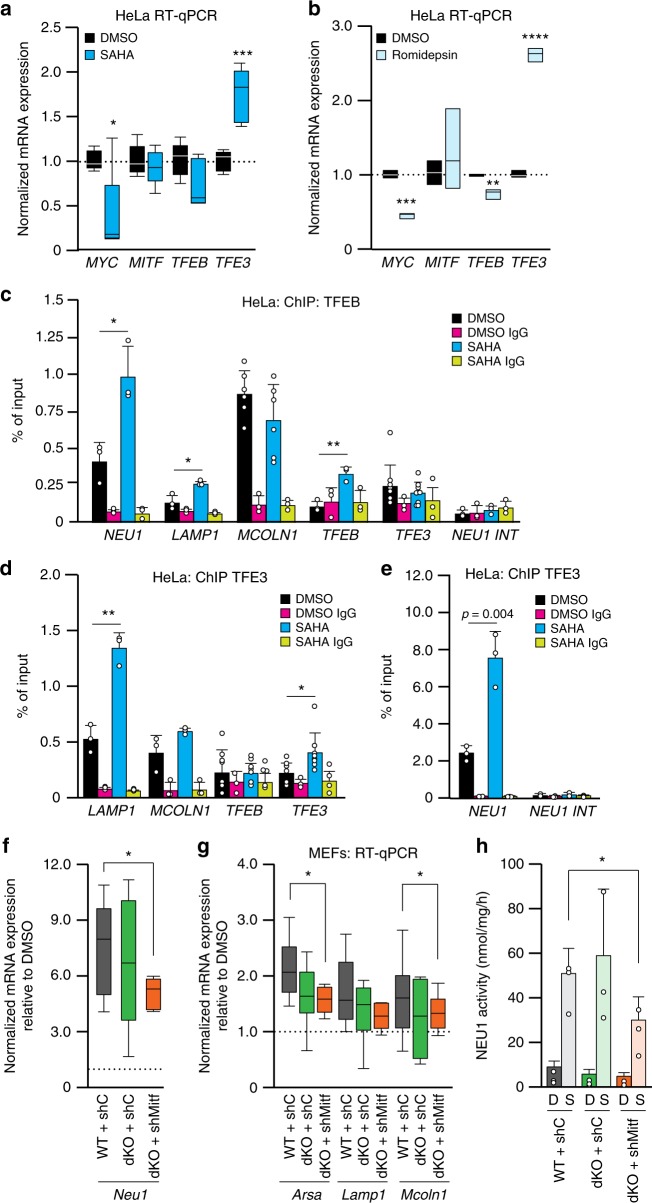
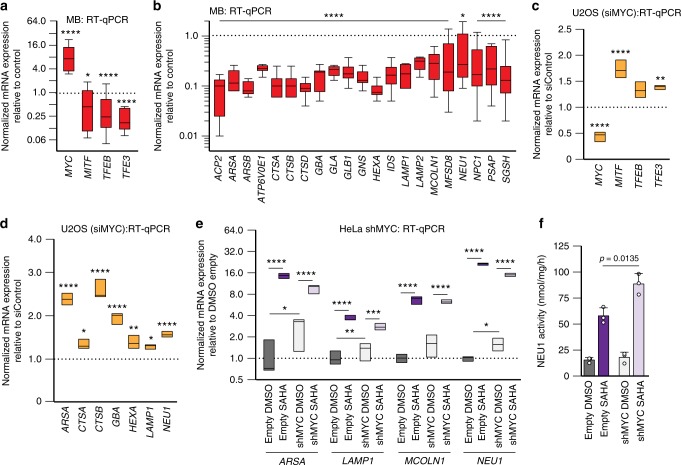
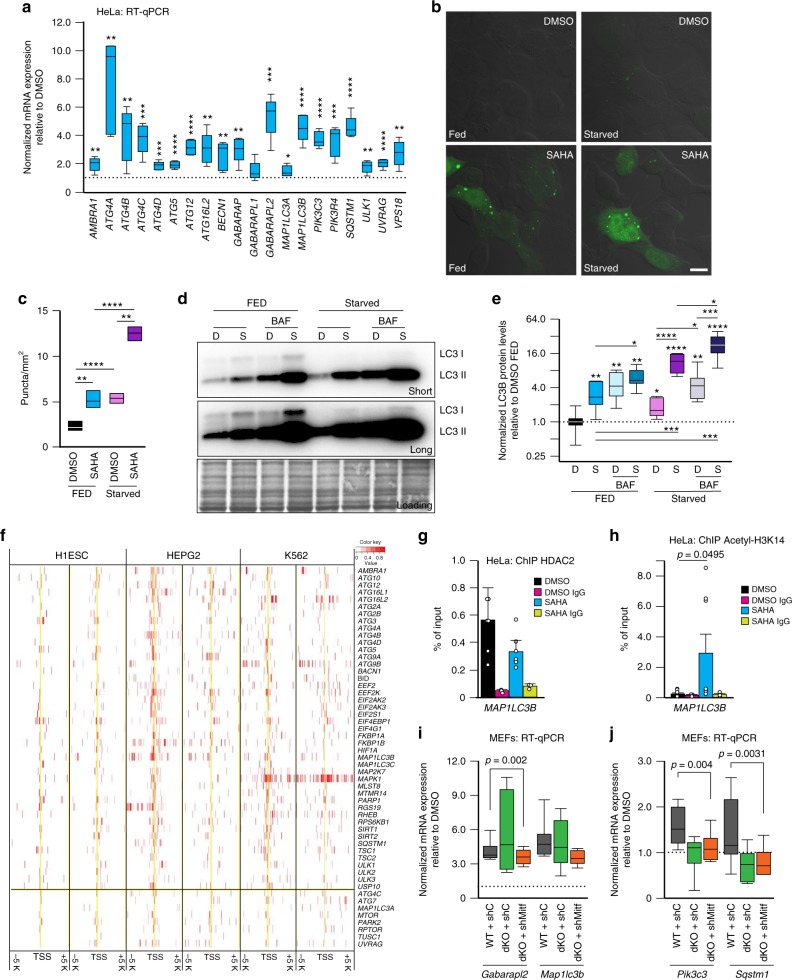
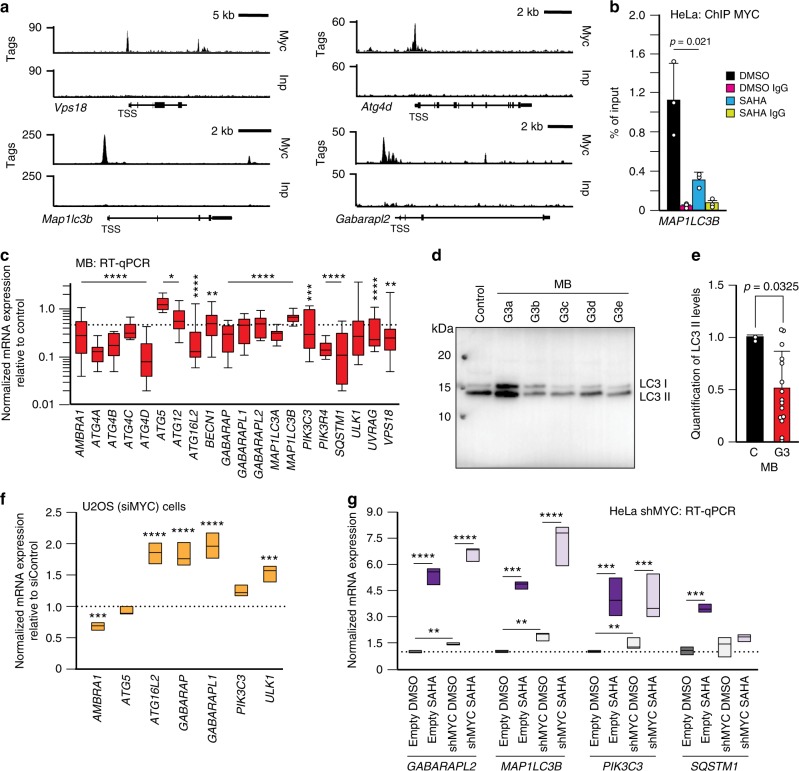
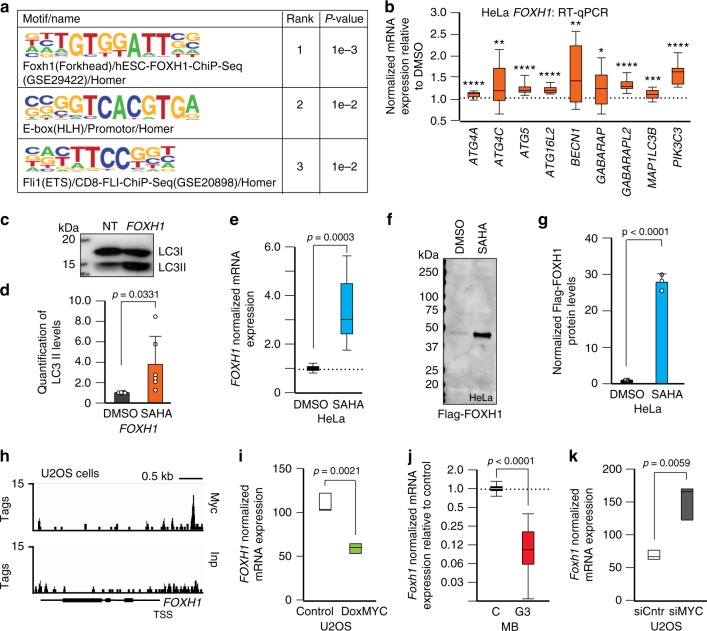
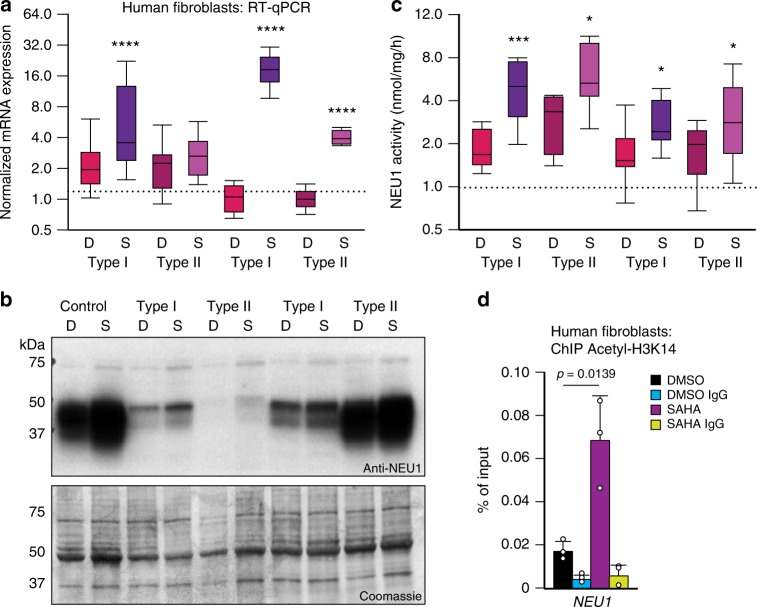
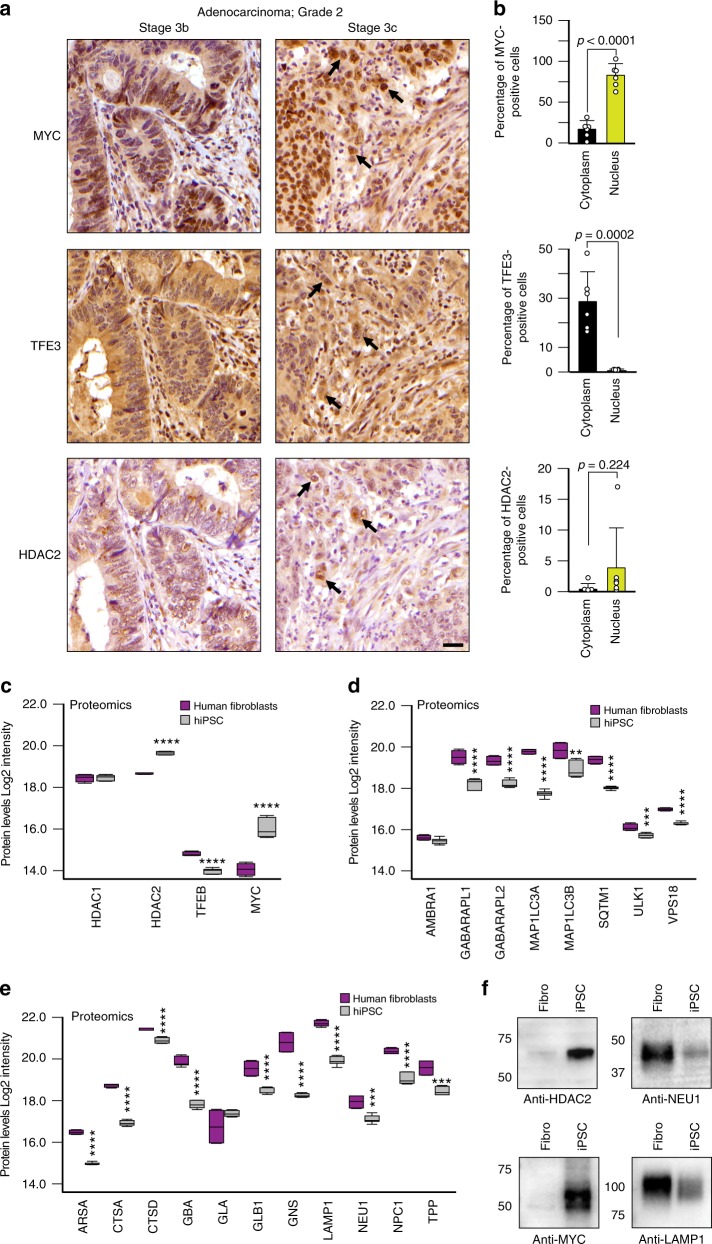
Coordinated regulation of the lysosomal and autophagic systems ensures basal catabolism and normal cell physiology, and failure of either system causes disease. Here we describe an epigenetic rheostat orchestrated by c-MYC and histone deacetylases that inhibits lysosomal and autophagic biogenesis by concomitantly repressing the expression of the transcription factors MiT/TFE and FOXH1, and that of lysosomal and autophagy genes. Inhibition of histone deacetylases abates c-MYC binding to the promoters of lysosomal and autophagy genes, granting promoter occupancy to the MiT/TFE members, TFEB and TFE3, and/or the autophagy regulator FOXH1. In pluripotent stem cells and cancer, suppression of lysosomal and autophagic function is directly downstream of c-MYC overexpression and may represent a hallmark of malignant transformation. We propose that, by determining the fate of these catabolic systems, this hierarchical switch regulates the adaptive response of cells to pathological and physiological cues that could be exploited therapeutically.


Conflict of interest statement

The authors declare no competing interests.

Figures

Fig. 1
Fig. 1
HDACs epigenetically regulate the expression of lysosomal genes. a GSEA demonstrated significant activation of the lysosomal pathway in HeLa cells treated with SAHA (20 μM for 24 h). The top 20 upregulated genes are shown at the bottom of the plot. b Expression analysis of lysosomal genes after SAHA treatment (20 μM for 24 h). The box and whisker plot show normalized expression of the lysosomal mRNAs in SAHA-treated HeLa cells relative to that in DMSO-treated cells. n = 5 biologically independent samples. c Lysosomal volume was measured by FACS analysis as mean fluorescence intensity (MFI) after lysotracker staining of HeLa cells treated with SAHA (20 μM for 24 h) and compared to cells treated with DMSO, n = 9 biologically independent samples. d Lysosomal count of transmission electron microscopy images n = 20 images. en Activity assays for NEU1 (n = 7 biologically independent samples), β-hexosaminidase (β-HEX) (n = 4 biologically independent samples), α-mannosidase (α-MAN) (n = 5 biologically independent samples), β-galactosidase (β-GAL) (n = 5 biologically independent samples) and cathepsin A (CA) (n = 5 biologically independent samples) in HeLa cells treated with DMSO or SAHA (ei) (20 μM for 24 h), or in HeLa cells treated with DMSO or romidepsin (j-n) (romidepsin, Romi, 10 nM for 24 h; n = 6 biologically independent samples). o HDAC2 occupancy was analyzed using ChIP-seq datasets available at the ENCODE/Haib project. Genes shown on the left of the vertical black line are occupied by HDAC2. p = 4.65e-11, odds ratio = 4.4, Fisher’s exact test. p ChIP analysis of the promoters of NEU1, LAMP1, MCOLN1, TFEB, and TFE3 using anti-HDAC2 antibody in HeLa cells treated with SAHA (20 μM for 24 h) or DMSO (n = 3 biologically independent samples). Oligos encompassing a genomic region at +5 Kb from the TSS of NEU1 (NEU1 INT) were used as control for non-specic antibody binding (n = 3 biologically independent samples); IgG control n = 3 biologically independent samples. q ChIP analysis of the promoters of NEU1, LAMP1, MCOLN1, TFEB, and TFE3 and NEU1 INT using acetyl histone H3 Lys 14 antibody (Acetyl-H3K14) in HeLa cells treated with SAHA (20 μM for 24 h) or DMSO (n = 8 biologically independent samples); IgG control n = 3 biologically independent samples. Boxes represent the mean value and bar inside the box represents median value; upper bar represents maximum of distribution; lower bar represents minimum of distribution (95% confidence level). Graphs shown in (cn) and (p, q) are presented as mean ±SD. Statistical analysis was performed using Student t-test
Fig. 2
Fig. 2
MYC occupies the promoters of lysosomal genes and that of TFEB and TFE3. a Motif analysis using HDAC2-binding sites present in lysosomal genes. b Left, silencing of HDAC2 downregulated MYC protein expression in HeLa cells. Right, Coomassie stained immunoblot used as the loading control. c Quantification of MYC levels in HDAC2 silenced HeLa cells normalized to loading control (n = 3 independent experiments). d Co-immunoprecipitation of MYC with HDAC2 from lysates obtained from HeLa cells. HDAC2 band is labeled with an asterisk. Heavy chain IgG is labeled with an arrow. e Immunoprecipitation of MYC followed by immunoblot of MYC protein. MYC band is labeled with an asterisk. Heavy chain IgG is labeled with an arrow. f Graph represents HDAC2 binding to the promoter of MYC (n = 5 biologically independent samples) in HeLa cells treated with DMSO and SAHA (20 μM for 24 h); IgG control (n = 3 biologically independent samples). gi Myc binding to the promoters of (g) Neu1, Ctsa, (h) Lamp1, Mcoln1 and i Tfeb and Tfe3 was analyzed in ChIP-seq datasets performed with anti-Myc antibody in mouse group 3 medulloblastoma cells overexpressing Myc (Trp53–/– overexpressing Myc). Input DNA (Inp) serves as reference. j, k Histograms represent MYC binding to the promoters of (j) NEU1 (n = 3 biologically independent samples), LAMP1 (n = 3 biologically independent samples), MCOLN1 (n = 3 biologically independent samples), TFEB (n = 6 biologically independent samples), TFE3 (n = 3 biologically independent samples) and (k) MYC (n = 3 biologically independent samples) in HeLa cells treated with SAHA (20 μM for 24 h) or DMSO. NEU1 INT oligos were used as negative control for non-specific antibody binding (n = 3 biologically independent samples); IgG control (n = 3 biologically independent samples). l Sequential ChIP experiments were performed from HeLa cells with anti-MYC antibody followed by anti-HDAC2 antibody and analyzed by RT-qPCR at the promoter region of TFEB and TFE3 (n = 3 biologically independent samples); IgG control (n = 3 biologically independent samples). All the graphs are presented as mean ± SD. Statistical analysis was performed using the Student t-test. *p < 0.05, **p < 0.01, ****p < 0.0001
Fig. 3
Fig. 3
MYC antagonizes MiT/TFE members. a, b RT-qPCR of MYC, MITF, TFEB, and TFE3 in (a) SAHA-treated (20μM for 24 h; n = 5 biologically independent samples) or b romidepsin-treated (10 nM for 24 h) HeLa cells (n = 3 biologically independent samples) and compared to DMSO-treated cells. c ChIP analyses of NEU1 (n = 3 biologically independent samples), LAMP1 (n = 3 biologically independent samples), MCOLN1 (n = 6 biologically independent samples), TFEB (n = 3 biologically independent samples), and TFE3 (n = 9 biologically independent samples) promoters using anti-TFEB antibody in HeLa cells treated with SAHA (20 μM for 24 h) or DMSO. NEU1 INT oligos were used as negative control for non-specific antibody binding (n = 3 biologically independent samples); IgG control (n = 3 biologically independent samples). d, e ChIP analyses of the promoters of (d) LAMP1 (n = 3 biologically independent samples), MCOLN1 (n = 3 biologically independent samples), TFEB (n = 7 biologically independent samples), TFE3 (n = 6 biologically independent samples) and (e) NEU1 (n = 3 biologically independent samples) using an anti-TFE3 antibody in HeLa cells treated with SAHA (20 μM for 24 h) or DMSO. NEU1 INT oligos were used as negative control for non-specific antibody binding (n = 3 biologically independent samples); IgG control (n = 3 biologically independent samples). f, g RT-qPCR of (fNeu1 (gArsa, Lamp1, and Mcoln1 was performed in mouse embryonic fibroblasts (MEFs), in which Tfeb and Tfe3 were knocked out via CRISPR-technology (dKO) and in dKO with Mitf silencing (dKO + shMitf) (n ≥ 6 biologically independent samples) and treated with SAHA (20μM for 24 h) or DMSO. shC refers to cells transduced with shRNA control lentivirus. Statistical analysis was performed comparing the normalized expression of the lysosomal genes in MEFs WT + shC versus dKO + shC and MEFs WT + shC versus dKO + shMitf. h Activity assay for NEU1, in MEFs WT, Tfeb and Tfe3 dKO transduced with a sh lentivirus control (ShC) or with a lentiviral vector targeting Mitf (dKO + shMitf) (n = 3 biologically independent samples). MEFs of different genotypes were treated with DMSO and SAHA (20 μM for 24 h). Statistical analysis was performed comparing the activity of NEU1 after SAHA treatment in MEFs WT + shC to dKO + shC and dKO + shMitf. Boxes represent the mean value and bar inside the box represents median value; upper bar represents maximum of distribution; lower bar represents minimum of distribution (95% confidence level). Graphs are presented as mean ± SD. Statistical analysis was performed using the Student t-test. *p < 0.05, **p < 0.01, ****p < 0.0001
Fig. 4
Fig. 4
MYC represses lysosomal gene expression. a, b RT-qPCR of (a) Myc, Mitf, Tfeb, Tfe3 and (b) lysosomal genes was performed in mouse group 3 medulloblastoma (MB) tumorspheres overexpressing Myc (Trp53–/– overexpressing Myc) and values compared to Trp53–/– controls (n = 10 biologically independent samples). c, d RT-qPCR of (c) MYC, MITF, TFEB, TFE3 and (d) lysosomal genes in U2OS osteosarcoma cells with silenced MYC expression. e RT-qPCR of ARSA, LAMP1, MCOLN1 and NEU1 was performed in HeLa cells silenced for MYC (shMYC), (n = 6 biologically independent samples) and treated with SAHA (8 μM for 24 h). f Activity assays for NEU1 in HeLa cells silenced for MYC (shMYC) or infected with a lentiviral empty vector control (Empty) (n = 3 biologically independent samples) treated with DMSO and SAHA (8 μM for 24 h). All graphs are presented as mean ± SD. Statistical analysis was performed using the Student t-test. *p < 0.05, **p < 0.01, ***p < 0.001, ****p < 0.0001
Fig. 5
Fig. 5
HDACs epigenetically regulate autophagy. a RT-qPCR of autophagy genes in SAHA-treated (20 μM for 24 h) HeLa (n = 5 biologically independent samples). b EGFP-LC3 expression in HeLa treated with DMSO or SAHA (20μM for 24 h) under fed or starved conditions (EBSS). Scale bar, 20 μm. c Quantification of EGFP-LC3 (n = 12 images). d Top, representative image of anti-LC3 immunoblot of HeLa treated with DMSO (D) or SAHA (S) (20 μM for 24 h) under fed or starved conditions (EBSS) with or without Bafilomycin A1 (BAF) to assess the autophagic flux; short and long exposure. Bottom, Coomassie stained immunoblot used as loading control e Quantification of LC3II/LC3I ratio (n = 5 independent experiments) normalized to the loading control and relative to DMSO FED values; D = DMSO, S = SAHA, starved = EBSS treatment. f HDAC2 occupancy of autophagy gene promoters analyzed using ChIP-seq datasets from the ENCODE/Haib project. Genes on the left of the vertical black line are occupied by HDAC2. p = 4.656e-08, odds ratio = 6.0, Fisher’s exact test. g ChIP analyses of the MAP1LC3B promoter using anti-HDAC2 antibody was performed in HeLa treated with SAHA (20μM for 24 h) or DMSO (n = 6 biologically independent samples); IgG control (n = 3 biologically independent samples). h ChIP analysis of the promoter of MAP1LC3B using acetyl histone H3 Lys 14 antibody (Acetyl-H3K14) in HeLa treated with SAHA (20 μM for 24 h) or DMSO (n = 6 biologically independent samples); IgG control (n = 3 biologically independent samples). i, j RT-qPCR of (i) Gabarapl2, Map1lc3b and (j) Pik3c3 and Sqstm1 was performed after SAHA treatment (20μM for 24 h) in WT MEFs, in MEFs with CRISPR-mediated knockout of Tfeb and Tfe3 (dKO) and in MEFs dKO silenced for Mitf (dKO + shMitf) (n ≥ 6 biologically independent samples). shC refers to cells transduced with shRNA control lentivirus. Statistical analysis was performed comparing the normalized expression of the autophagy genes in MEFs WT + shC versus dKO + shC and in MEFs WT + shC versus dKO + shMitf. Boxes represent the mean value and bar inside the box represents median value; upper bar represents maximum of distribution; lower bar represents minimum of distribution (95% confidence level). Graphs are presented as mean ± SD. Statistical analysis was performed using the Student t-test. *p < 0.05, **p < 0.01, ****p < 0.0001
Fig. 6
Fig. 6
MYC represses autophagy. a ChIP-seq analysis for Myc binding to the promoters of Vps18, Map1lc3b, Atg4d, and Gaparapl2 performed in mouse group 3 medulloblastoma tumorspheres overexpressing Myc, MB (Trp53−/− overexpressing Myc) (n = 3 independent experiments). b ChIP analyses of the MAP1LC3B promoter using anti-MYC antibody performed in HeLa cells treated with SAHA (20 μM for 24 h) or DMSO (n = 3 biologically independent samples). c RT-qPCR of autophagy genes in tumorspheres Trp53−/− overexpressing Myc (MB), (n = 10 biologically independent samples). d Comparative LC3 immunoblots of tumorspheres Trp53−/− overexpressing Myc and control Trp53−/− cells. e Quantification of the LC3II/LC3I ratio normalized to Coomassie stained immunoblots, used as loading control. C = Control (Trp53−/−) cells (n = 3 biologically independent samples); G3 = tumorspheres Trp53−/− overexpressing Myc (n = 15 biologically independent samples). f Expression levels of several autophagic genes in U2OS cells with silenced MYC expression. g RT-qPCR of GABARAPL2, MAP1LC3B, PIK3C3 and SQSTM1 was performed in HeLa cells silenced for MYC (shMYC) (n = 3 biologically independent samples) and treated with SAHA (8 μM for 24 h). Boxes represent the mean value and bar inside the box represents median value; upper bar represents maximum of distribution; lower bar represents minimum of distribution (95% confidence level). Graphs are presented as mean ± SD. Statistical analysis was performed using the Student t-test. *p < 0.05, **p < 0.01, ***p < 0.001, ****p < 0.0001
Fig. 7
Fig. 7
FOXH1 is an additional activator of autophagy and responds to the HDACs/MYC axis. a Motif analysis using HDAC2-binding sites for autophagy genes identified the FOXH1 motif. b RT-qPCR of autophagy genes in FOXH1-overexpressing HeLa cells (n = 6 biologically independent samples) p < 0.01. c Representative LC3 immunoblot from FOXH1-overexpressing cells. d Quantification of the LC3II/LC3I ratio normalized to Coomassie stained immunoblots, used as loading control (n = 6 independent experiments). e FOXH1 RT-qPCR in SAHA-treated HeLa cells (20 μM for 24 h; n = 7 biologically independent samples). f Representative immunoblot of FOXH1 overexpression in HeLa cells treated with DMSO or SAHA (20 μM for 24 h). g Quantification of f (n = 3 independent experiments) normalized to Coomassie stained immunoblots, used as loading control. h MYC binding to the FOXH1 locus obtained from ChIP-seq datasets for U2OS cells overexpressing MYC. i Expression of the FOXH1 gene in U2OS cells with MYC overexpression, data obtained from Walz et al. j RT-qPCR of Foxh1 in tumorpheresTrp53−/− overexpressing Myc. Values are relative to those obtained in control Trp53−/− cells (n = 5 biologically independent samples). k RT-qPCR of FOXH1 in U2OS cells in which MYC was silenced by shRNA. Boxes represent the mean value and bar inside the box represents median value; upper bar represents maximum of distribution; lower bar represents minimum of distribution (95% confidence level). Graphs are presented as mean ± SD. Statistical analysis was performed using the Student t-test
Fig. 8
Fig. 8
HDAC inhibition in LSD. a RT-qPCR of NEU1 in SAHA- or DMSO-treated sialidosis fibroblasts, (SAHA 20 μM for 24 h; n = 8 biologically independent samples). Type I = attenuated form of sialidosis; Type II = severe form of sialidosis. b Top, representative immunoblot of fibroblasts isolated from two patients with sialidosis type I and two patients with sialidosis type II were treated with SAHA (S) (20 μM for 24 h) or DMSO (D) and probed with anti-NEU1 antibody; bottom, Coomassie stained immunoblot used as loading control. c NEU1 activity in fibroblasts isolated from two patients with sialidosis type I and two patients with sialidosis type II treated with SAHA (S)- or DMSO (D)-treated (SAHA, 20 μM for 24 h; n = 7 biologically independent samples). d ChIP analysis of the promoter of NEU1 performed with acetyl histone H3 Lys 14 antibody (Acetyl-H3K14) in fibroblasts from one type I sialidosis fibroblasts treated with SAHA (20 μM for 24 h) or DMSO (n = 3 biologically independent samples). Boxes represent the mean value and bar inside the box represents median value; upper bar represents maximum of distribution; lower bar represents minimum of distribution (95% confidence level). Graphs are presented as mean ± SD. Statistical analysis was performed using the Student t-test. *p < 0.05, ***p < 0.001, ****p < 0.0001
Fig. 9
Fig. 9
HDACs/MYC–MiT/TFE axis in cancer and pluripotent stem cells. a Immunohistochemical analysis of MYC, TFE3, and HDAC2 in colon carcinoma samples. Regions marked by thick black arrows show that the nuclear expression of MYC and HDAC2 are common in subpopulations of neoplastic adenocarcinoma cells, especially at the invasive edges of the tumors. TFE3 appears to be more frequently localized to the cytoplasm in these same cells. Scale bar 25 μm. b MYC, TFE3, and HDAC2 expression levels in the cytoplasm and the nucleus of neoplastic cells were scored separately (n = 6 independent tumors). ce Protein levels of (c) HDAC1, HDAC2, TFEB, and MYC, (d) of lysosomal enzymes and lysosomal membrane components and (e) of autophagy effectors detected in proteomics of human fibroblasts (n = 4 biologically independent samples) and reprogrammed hiPSCs, (n = 7 biologically independent samples). f Representative immunoblots of hiPSCs and their parental fibroblasts probed with anti-MYC, anti-HDAC2, anti-NEU1 and anti-LAMP1 antibodies. Boxes represent the mean value and bar inside the box represents median value; upper bar represents maximum of distribution; lower bar represents minimum of distribution (95% confidence level). Graphs are shown as mean ± SD. Statistical analysis was performed using the Student t-test. **p < 0.01, ***p < 0.001, ****p < 0.0001

Similar articles

Cited by

References

    1. Jaenisch R, Bird A. Epigenetic regulation of gene expression: how the genome integrates intrinsic and environmental signals. Nat. Genet. 2003;33(Suppl):245–254. doi: 10.1038/ng1089. - DOI - PubMed
    1. Li G, Reinberg D. Chromatin higher-order structures and gene regulation. Curr. Opin. Genet Dev. 2011;21:175–186. doi: 10.1016/j.gde.2011.01.022. - DOI - PMC - PubMed
    1. Eberharter A, Becker PB. Histone acetylation: a switch between repressive and permissive chromatin. Second in review series on chromatin dynamics. EMBO Rep. 2002;3:224–229. doi: 10.1093/embo-reports/kvf053. - DOI - PMC - PubMed
    1. Seto E, Yoshida M. Erasers of histone acetylation: the histone deacetylase enzymes. Cold Spring Harb. Perspect. Biol. 2014;6:a018713. doi: 10.1101/cshperspect.a018713. - DOI - PMC - PubMed
    1. Lin HY, Chen CS, Lin SP, Weng JR, Chen CS. Targeting histone deacetylase in cancer therapy. Med. Res. Rev. 2006;26:397–413. doi: 10.1002/med.20056. - DOI - PubMed

Publication types

MeSH terms