. 2019 Aug 9;10(1):3601.
doi: 10.1038/s41467-019-11614-x.

A STAT3-based gene signature stratifies glioma patients for targeted therapy

Affiliations

A STAT3-based gene signature stratifies glioma patients for targeted therapy

Melanie Si Yan Tan et al. Nat Commun. .

Abstract

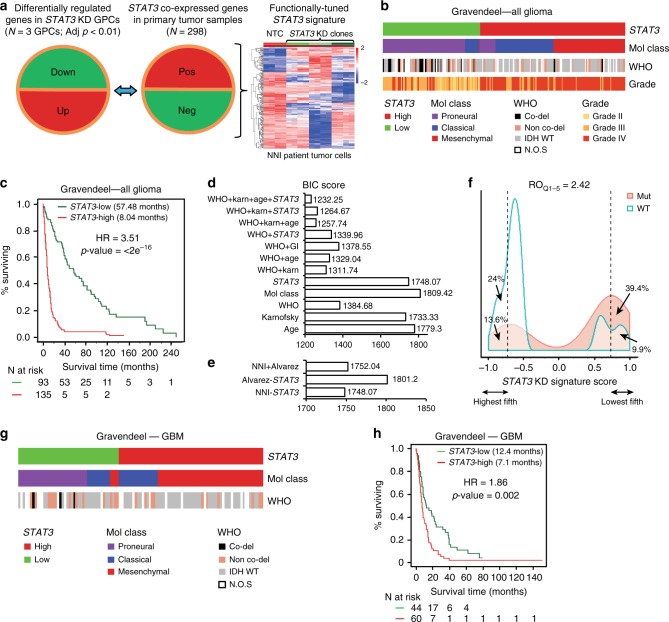
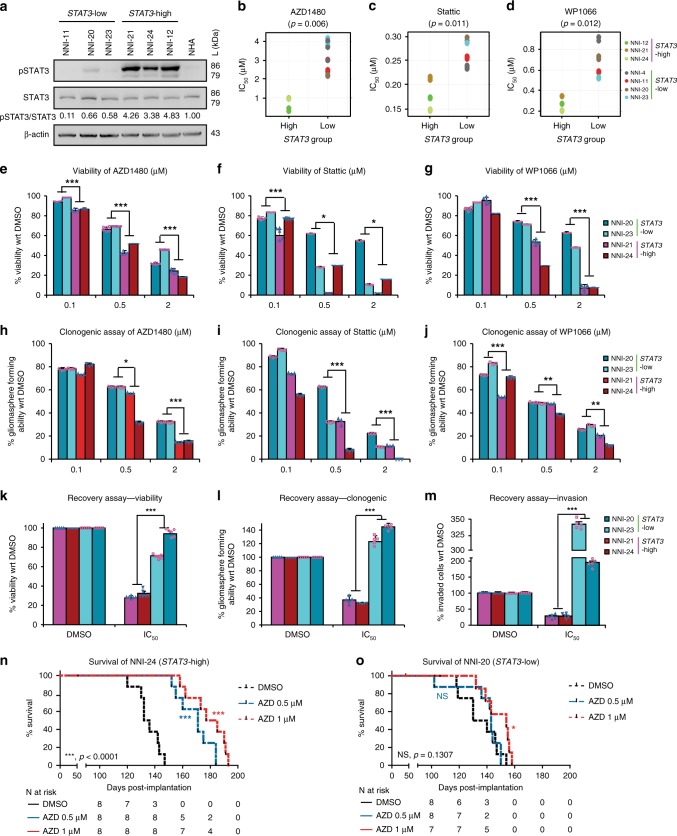
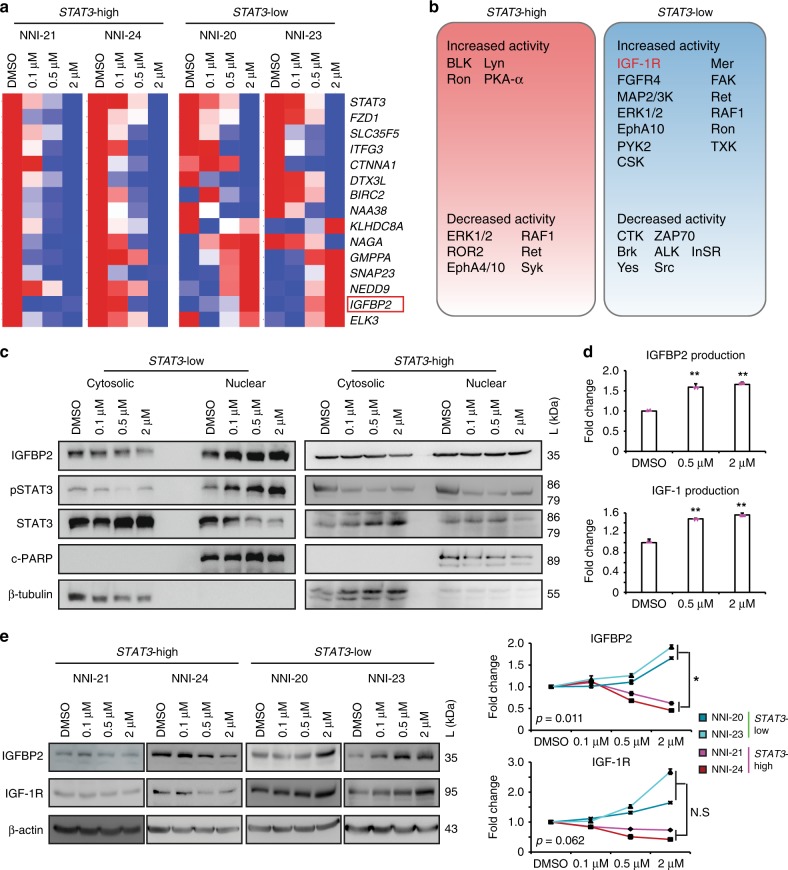
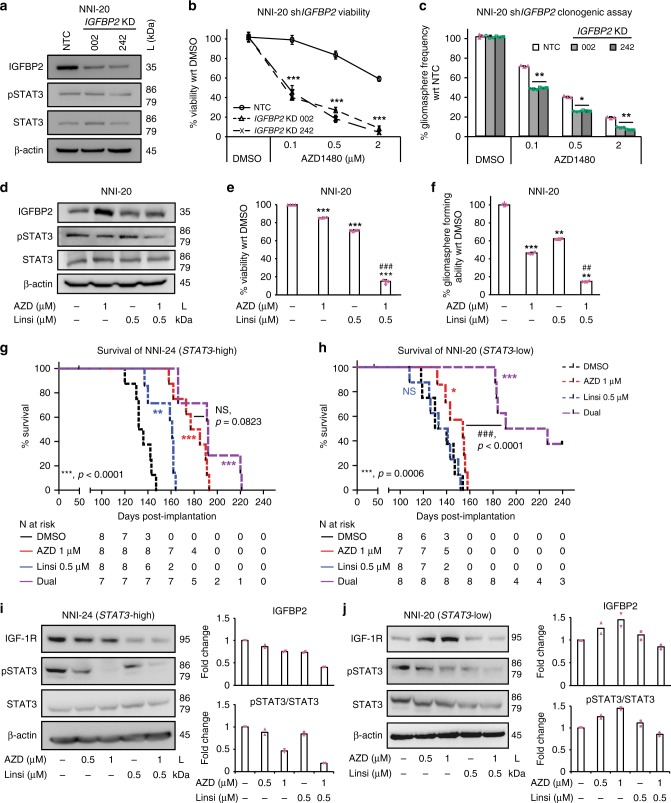
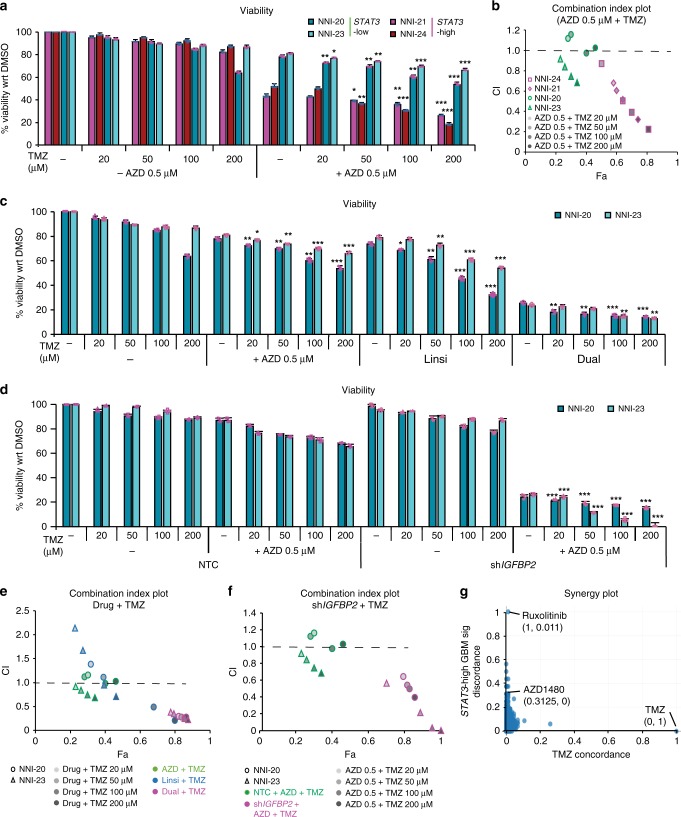
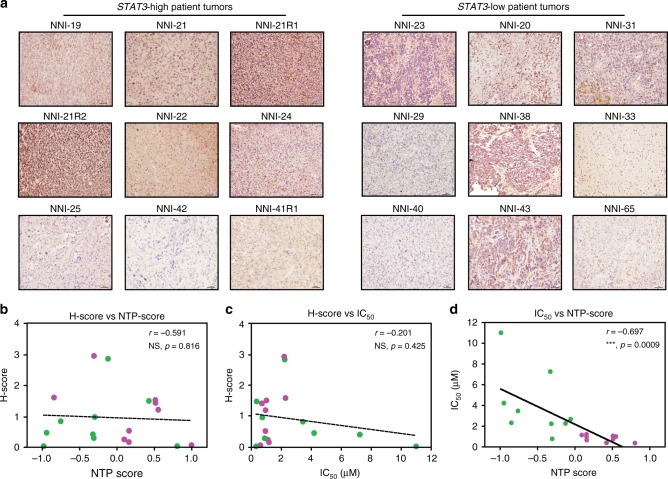
Intratumoral heterogeneity is a hallmark of glioblastoma (GBM) tumors, thought to negatively influence therapeutic outcome. Previous studies showed that mesenchymal tumors have a worse outcome than the proneural subtype. Here we focus on STAT3 as its activation precedes the proneural-mesenchymal transition. We first establish a STAT3 gene signature that stratifies GBM patients into STAT3-high and -low cohorts. STAT3 inhibitor treatment selectively mitigates STAT3-high cell viability and tumorigenicity in orthotopic mouse xenograft models. We show the mechanism underlying resistance in STAT3-low cells by combining STAT3 signature analysis with kinome screen data on STAT3 inhibitor-treated cells. This allows us to draw connections between kinases affected by STAT3 inhibitors, their associated transcription factors and target genes. We demonstrate that dual inhibition of IGF-1R and STAT3 sensitizes STAT3-low cells and improves survival in mice. Our study underscores the importance of serially profiling tumors so as to accurately target individuals who may demonstrate molecular subtype switching.


Conflict of interest statement

The authors declare no competing interests.

Figures

Fig. 1
Fig. 1
NNI-STAT3 functionally tuned gene signature stratifies patient survival independent of current clinical indicators. a STAT3 co-expressed genes from Rembrandt patient database (middle panel) that displayed inverse expression upon STAT3 knockdown (KD) (left panel) were identified to form the NNI-STAT3 functionally tuned gene signature (right panel). b In Gravendeel clinical database, STAT3-high patient all glioma cohort was enriched in mesenchymal and classical molecular subtypes, with predominantly isocitrate dehydrogenase 1 (IDH)-wild-type status. STAT3-low tumors, in contrast, comprised mostly low-grade gliomas (LGGs), IDH-mutant (1p/19q co-deleted and non-co-deleted), and proneural molecular subtypes. c NNI-STAT3 signature stratified all glioma patient survival in Gravendeel clinical database. An enrichment of STAT3 pathway activation defined the poor prognosis patients (STAT3-high, 8.04 months), while patients of STAT3-low survived significantly longer (57.48 months). d A combination of NNI-STAT3 gene signature, World Health Organization status, Karnofsky (Karn) score, and age presented the best statistical model to account for the variability in patient survival, using the Bayesian Information Criterion (BIC) method. e NNI-STAT3 signature performed better than the existing Alvarez STAT3 signature for glioma patient prognosis. f The relative odds of correlation between STAT3 signature and IDH mutation is 2.42 in a diagnostic metrics test. Patients with a negative signature score (STAT3-high) are 2.42 times more likely to be IDH-wild-type than those with a positive signature score (STAT3-low). g STAT3-high GBM patient cohort was enriched in mesenchymal and classical molecular subtypes. STAT3-low tumors, in contrast, comprised mostly the proneural molecular subtype. h NNI-STAT3 signature stratified glioblastoma patient survival. An enrichment of STAT3 pathway activation defined the poor prognosis patients (STAT3-high, 7.1 months) while patients of STAT3-low survived significantly longer (12.4 months)
Fig. 2
Fig. 2
NNI patient-derived glioblastoma (GBM) cells stratified by their STAT3 status show variable response to signal transducers and activators of transcription 3 (STAT3) inhibitors. a Immunoblot analysis of patient GPCs. STAT3-high cell lines showed elevated phospho-STAT3, compared to STAT3-low cell lines. bd Patient GBM cells were treated with b AZD1480, c Stattic, and d WP1066, and their IC50 values were determined (results are mean of triplicate experiments). Consistent with bioinformatical prediction, STAT3-high cell lines showed sensitivity to STAT3 inhibitors as demonstrated by lower IC50 values. STAT3-high and -low cell lines were validated by eg cell viability and hj clonogenic capacity after treatment with STAT3 inhibitors. STAT3-low cells demonstrated greater viability and gliomasphere-forming capability after treatment with e, h AZD1480, f, i Stattic, and g, j WP1066. Conversely, STAT3-high lines displayed greater sensitivity to STAT3 inhibitors, resulting in reduced cell viability and gliomasphere-forming capability. km Recovery assay after 5-day AZD1480 treatment, and the k viability and l clonogenic capacity of STAT3-high GPCs were significantly mitigated. In contrast, STAT3-low GPCs developed resistance and m demonstrated greater ability to invade. *p < 0.05; **p < 0.01; ***p < 0.001; STAT3-high versus STAT3-low. For statistical analysis, two-sided Student’s t test was used. Error bars represent standard deviation of the mean. All results are mean of triplicate experiments. n Orthotopic tumors established from STAT3-high, AZD1480-pretreated cells resulted in mice with prolonged survival. STAT3-high (47 days) patient-derived xenograft demonstrated greater median survival difference of ~2.5-fold for AZD1480 arm compared to o NNI-20 (19 days) animal groups. *p < 0.05; ***p < 0.001 versus dimethyl sulfoxide. For statistical analysis, logrank test was used
Fig. 3
Fig. 3
Mechanistic gene candidates identified by NNI-STAT3 gene signature. a Winnowed gene list across patient tumors identified candidates uniquely upregulated in STAT3-high tumors. A dose-dependent differential gene expression after signal transducers and activators of transcription 3 (STAT3) inhibitor AZD1480 treatment distinguished cooperative genes responsible in the STAT3-resistant profile. Results are mean of triplicate experiments. b Graphical illustration of responsive and resistant protein tyrosine kinase candidates in STAT3-high and -low cell lines treated with AZD1480 using computational workflow described in Supplementary Fig. 4c. c Treatment of cells with STAT3 inhibitor (AZD1480) demonstrated an increase in pSTAT3 and insulin-like growth factor binding protein 2 (IGFBP2) expression levels in the nuclear fraction of STAT3-low cells but not in STAT3-high. d Fold change differences in secreted proteins demonstrated increased IGFBP2 and insulin-like growth factor 1 receptor (IGF-1R) in resistant cells post-treatment with STAT3 inhibitor. Results are mean of triplicate experiments. e STAT3-high glioblastoma (GBM) cells displayed modest reduction in IGF-1R and IGFBP2 expression levels. In contrast, IGF-1R and IGFBP2 protein expression in STAT3-low cells increased dose-dependently upon AZD1480 treatment, albeit IGF-1R was marginally insignificant. Fold change differences in protein expression of IGFBP2 and IGF-1R were compared between STAT3-high and -low GBM cells. *p < 0.05; **p < 0.01; STAT3-high versus STAT3-low. For statistical analysis, two-sided Student’s t test was used. Error bars represent standard deviation of the mean
Fig. 4
Fig. 4
Sensitization of chemoresistant STAT3-low glioma cells by IGFBP2 knockdown (KD) and dual drug inhibition. a Depletion of mechanistic gene IGFBP2. Compared to the non-targeting control (NTC), shIGFBP2 clones displayed increased sensitivity to AZD1480, observed by b decreased viability and c reduced gliomasphere-forming frequency in STAT3-low cell line, NNI-20 (additional cell line NNI-23 provided in Supplementary Fig. 5a–c). **p < 0.01; ***p < 0.001; KD versus NTC. For statistical analysis, two-sided Student’s t test was used. Error bars represent standard deviation of the mean. df Using a dual drug treatment strategy (AZD1480 against signal transducers and activators of transcription 3 (STAT3), and Linsitinib against insulin-like growth factor 1 receptor (IGF-1R)), NNI-20 demonstrated a reduction of IGF-1R and pSTAT3 as observed in d immunoblot analysis, e viability, and f gliomasphere-forming frequency assays. Additional cell line, NNI-23, is provided in Supplementary Fig. 5d–f. **p < 0.01; ***p < 0.001; treatment groups versus dimethyl sulfoxide (DMSO) control. ##p < 0.01; ###p < 0.001; dual inhibitors versus individual inhibitor (AZD1480 or Linsitinib). The combination index value for the combined drugs 1 μM AZD1480 and 0.5 μM Linsitinib is 0.2092, calculated using CompuSyn. g NNI-24 STAT3-high xenograft model established from AZD1480-pretreated glioblastoma (GBM) cells displayed prolonged survival, while h NNI-20 STAT3-low xenograft model received marginal, albeit significant (for AZD1480 only) survival benefit with single agent alone. In contrast, dual treatment targeting both STAT3 and IGF-1R significantly prolonged survival and extended tumor latency of STAT3-low patient-derived xenograft (PDX) mice. *p < 0.05; **p < 0.01; ***p < 0.001; treatment group versus DMSO; ##p < 0.01; ###p < 0.001 dual inhibitors versus single inhibitor (logrank test). Censored points are indicated by the black tick mark, where mice death was not attributed to tumor formation. Immunoblot analysis of PDX tumors demonstrated that mice implanted with i NNI-24 (STAT3-high) treated with AZD1480, demonstrated a reduction in pSTAT3 expression, while j NNI-20 (STAT3-low) showed a stark increase in IGF-1R expression. This supports that dual inhibition of STAT3 and IGF-1R serves as a possible therapeutic strategy for STAT3-low GBM patients. Bar chart indicates quantified average fold change from immunoblots of two mice per treatment. This was limited by retrieval of sizeable tumors from dual treatment animal arm. Duplicate data are shown in Supplementary Fig. 5k–l
Fig. 5
Fig. 5
Chemosensitization of patient-derived glioblastoma propagating cells (GPCs) with standard-of-care temozolomide treatment. Patient cell lines were treated with increasing doses of temozolomide. a The addition of signal transducers and activators of transcription 3 (STAT3) inhibitor AZD1480 to temozolomide treatment demonstrated enhanced chemosensitivity as observed in tumor cell viability. Consistent with bioinformatics prediction, STAT3-high cell lines (NNI-21 and NNI-24) displayed enhanced chemosensitivity to AZD1480 treatment with temozolomide, when compared to STAT3-low cell lines (NNI-20 and NNI-23). *p < 0.05; **p < 0.01; ***p < 0.001 compared to absence of temozolomide. b Combination index (CI)-fraction affected (Fa, indicating fraction of cell viability affected) plots of glioblastoma (GBM) cell lines treated with increasing doses of temozolomide in the presence of 0.5 μM AZD1480. STAT3-high cell lines (NNI-21 and NNI-24) displayed a synergistic, cytotoxic effect (CI < 1) with larger Fa, while STAT3-low cell lines (NNI-20 and NNI-23) showed marginally reduced Fa values. cf Chemosensitization of STAT3-low cell lines (NNI-20 and NNI-23) was observed with temozolomide as demonstrated in the c, d viability and e, f CI plot with e dual treatment (AZD1480 and Linsitinib) or f upon mechanistic gene IGFBP2 knockdown in combination with 0.5 μM AZD1480. ***p < 0.001 shIGFBP2 compared to non-targeting control (NTC). In the CI plots, dashed line at CI = 1 indicates an additive effect between two compounds; values above and below indicate antagonism or synergism, respectively. Error bars represent standard deviation of the mean. For statistical analysis, two-sided Student’s t test was used. g Ranking of LINCS compounds (N = 1679) based on their concordance with temozolomide consensus signature. Compounds with a high x axis value have a signature concordant with temozolomide, and compounds with a high y axis value have a signature discordant with the STAT3-high GBM disease signature. STAT3 inhibitors, Ruxolitinib and AZD1480, demonstrated low concordance with temozolomide (0.011 and 0, respectively) and high discordance with the STAT3-high GBM disease signature (1 and 0.3125, respectively). List of top ranked synergistic compounds able to reverse the STAT3-high GBM disease signature is provided in Supplementary Table 4
Fig. 6
Fig. 6
NNI-STAT3 transcriptomic signature better identifies responsive patient cohort. a Immunohistochemical (IHC) staining of NNI patient tumors with phospho-signal transducers and activators of transcription 3 (phospho-STAT3). Representative images are shown, scale bar denotes 50 μm. Based on IHC staining, glioblastoma patient tumors (N = 18) were not accurately stratified by their STAT3 status. bd Using three different analyses, there was no significant correlation of b H-score versus Nearest Template Prediction (NTP) score derived from NNI-STAT3 signature or c H-score versus IC50, while d significant negative correlation was only established when IC50 was plotted against the NTP score. ***p < 0.001. This indicates that our STAT3 composite signature accurately identifies the responsive cohort. Magenta dots represent STAT3-high values, and green dots represent STAT3-low values. For statistical analysis, Pearson correlation coefficient was used

References

    1. Louis DN, et al. The 2016 World Health Organization Classification of Tumors of the Central Nervous System: a summary. Acta Neuropathol. 2016;131:803–820. doi: 10.1007/s00401-016-1545-1. - DOI - PubMed
    1. Alcantara Llaguno S, et al. Malignant astrocytomas originate from neural stem/progenitor cells in a somatic tumor suppressor mouse model. Cancer Cell. 2009;15:45–56. doi: 10.1016/j.ccr.2008.12.006. - DOI - PMC - PubMed
    1. Verhaak RG, et al. Integrated genomic analysis identifies clinically relevant subtypes of glioblastoma characterized by abnormalities in PDGFRA, IDH1, EGFR, and NF1. Cancer Cell. 2010;17:98–110. doi: 10.1016/j.ccr.2009.12.020. - DOI - PMC - PubMed
    1. Wang Q, et al. Tumor evolution of glioma-intrinsic gene expression subtypes associates with immunological changes in the microenvironment. Cancer Cell. 2018;33:152. doi: 10.1016/j.ccell.2017.12.012. - DOI - PMC - PubMed
    1. Zheng H, et al. p53 and Pten control neural and glioma stem/progenitor cell renewal and differentiation. Nature. 2008;455:1129–1133. doi: 10.1038/nature07443. - DOI - PMC - PubMed

Publication types

MeSH terms

LinkOut - more resources