. 2019 Aug 9;10(1):3594.
doi: 10.1038/s41467-019-11604-z.

Virus lasers for biological detection

Affiliations

Virus lasers for biological detection

John E Hales et al. Nat Commun. .

Abstract

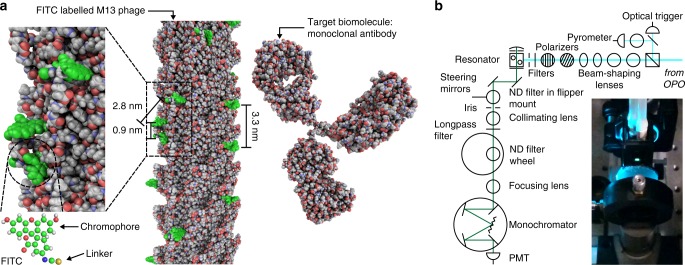
The selective amplification of DNA in the polymerase chain reaction is used to exponentially increase the signal in molecular diagnostics for nucleic acids, but there are no analogous techniques for signal enhancement in clinical tests for proteins or cells. Instead, the signal from affinity-based measurements of these biomolecules depends linearly on the probe concentration. Substituting antibody-based probes tagged for fluorescent quantification with lasing detection probes would create a new platform for biomarker quantification based on optical rather than enzymatic amplification. Here, we construct a virus laser which bridges synthetic biology and laser physics, and demonstrate virus-lasing probes for biosensing. Our virus-lasing probes display an unprecedented > 10,000 times increase in signal from only a 50% increase in probe concentration, using fluorimeter-compatible optics, and can detect biomolecules at sub-100 fmol mL-1 concentrations.


Conflict of interest statement

Research was partially funded by UCL Business, who have a financial interest in the commercial success of virus lasers. J.E.H., J.M.W. and G.A. are co-authors on a patent application (WO 2013/093499) and J.E.H., G.M., P.A.D. and G.A. are co-authors on a second patent application whose respective values could increase if the methods and ideas described in this paper find widespread application.

Figures

Fig. 1
Fig. 1
Design of the virus laser. a Model of the atomic structure of a lasing detection probe composed of M13 bacteriophage (PDB: 2MJZ) covalently modified with fluorescein isothiocyanate isomer 1 (FITC) dyes (PubChem CID: 18730, green).,, There are ~540 rings of gene 8 coat proteins per M13, but only 13 are shown here. The target biomolecule is a IgG2a monoclonal antibody (mAb) that can be bound by the gene 3 coat proteins and is represented in the figure by the structure of an intact IgG2a mAb (PDB: 1IGT) which should have a homologous structure. Rectangular zoomed area, image of the surface of M13 showing the close proximity of the attached dyes. Circular zoomed area, chemical structure of fluorescein isothiocyanate. Fluorescein has shorter moieties bonded to the aromatic ring system than other xanthene dyes, such as rhodamine 6G, reducing the likelihood of contact quenching between neighbouring dyes. b Optical configuration for experiments conducted using resonant cavity R2 (Supplementary Fig. 1). The excitation source was an optical parametric oscillator (OPO), the detector was a photomultiplier tube (PMT) and the emission was attenuated by neutral density (ND) filters. Inset, photograph of the emission from the gain medium of the virus laser (green light) as viewed from along the axis of the resonator
Fig. 2
Fig. 2
Virus lasers. a Threshold behaviour in R1 for 146 nmol mL−1 fluorescein (F1, dark orange) and for virus-lasing probes (V1) diluted from 413 pmol mL−1 (purple) to 351 pmol mL−1 (dark blue, equivalent to 135 nmol mL−1 fluorescein), 270 pmol mL−1 (green), 219 pmol mL−1 (light purple), 185 pmol mL−1 (cyan), 140 pmol mL−1 (light green), 103 pmol mL−1 (blue), and 72 pmol mL−1 (grey). The fitted curves represent a global fit of all of the sets of threshold data to a theoretical model (Supplementary Fig. 5; Methods). Errors in the concentration described in Methods. b Emission spectra of V1 at 413 pmol mL−1 as pumping increased from 5.5 × 1014 photons pulse−1 ± 10.1% (cyan) to 9.1 × 1014 photons pulse−1 ± 6.6% (dark blue). Inset, bathochromic shift in the spectrum of V1 (purple, pumping of 1.5 × 1015 photons pulse−1 ± 10.9%) relative to 72 nmol mL−1 fluorescein (orange, 1.7 × 1016 photons pulse−1 ± 11.4%). Curves are fits to the sum of two Gaussian peak functions. The intensity was not calibrated but was proportional to the number of photons entering the spectrometer (see Methods). Source data are provided as a Source Data file
Fig. 3
Fig. 3
Quantification of virus-lasing probes. a Response of the threshold point to variations in probe concentration. Scatter points represent the threshold point calculated by fitting individual sets of threshold data of either V1 (dark blue) or fluorescein (dark orange) using equation (26). The line is the expected dependence of the threshold point on the probe concentration calculated from the global fit in Fig. 2a. The error bars are standard errors and the error bar that extends beyond the upper limit of the y-axis extends to infinity. b The intensity at different probe concentrations has been plotted at pump energies of 1.0 × 1016 photons pulse−1 ± 5.7% (dark blue), 5.4 × 1015 photons pulse−1 ± 7.6% (green), 1.8 × 1015 photons pulse−1 ± 6.2% (purple), 1.4 × 1015 photons pulse−1 ± 5.3% (cyan), 5.5 × 1014 photons pulse−1 ± 4.8% (light green), 2.5 × 1014 photons pulse−1 ± 6.3% (blue), 9.6 × 1013 photons pulse−1 ± 5.8 % (light purple). The lines are simulations from the same global fit for the intensity against probe concentration at the same pump energies. Source data are provided as a Source Data file
Fig. 4
Fig. 4
Response of the virus laser to ligand-binding. a Spectra of V2 before (cyan) the addition of cp-mAb at 1.3 × 1016 photons pulse−1 and after (light green) the addition of the antibody at 1.4 × 1016 photons pulse−1. Each scatter point is the mean of four measurements at each wavelength and the curves are fits to the sum of two Voigt peak functions (dark blue) and a Lorentzian peak function (green). b Threshold behaviour of V2 before and after the addition of cp-mAb, same colours as (a). Lines represent individual fits of the data to equation (26). c Time-dependence of the intensity at 523.5 nm at pump energies initially above threshold at 1.3 × 1016 photons pulse−1 ± 4.7% (purple) and below threshold at 1.6 × 1015 photons pulse−1 ± 4.4% (green). The concentration of cp-mAb, which is a ligand bound by M13, in the gain medium after mixing increases in steps from 0 fmol mL−1 to 9 fmol mL−1, 29 fmol mL−1 and then 90 fmol mL−1. The arrows indicate when cp-mAb was added to the reservoir, and the lengths of the arrows are proportional to the amount added to the reservoir at each step. The squares and error bars represent the mean and standard deviation, respectively, of 7 measurements taken at each point in the time series. The variation in intensity at each time point is caused by small fluctuations in the pump energy and random variations in the response of the intensity to pumping. See Supplementary Figs. 7, 8 and 9 for all of the collected data. Source data are provided as a Source Data file
Fig. 5
Fig. 5
Step-changes in the threshold point in response to ligand-binding. In two further experiments in R2, the threshold behaviour of dye-labelled M13 was monitored as a function of time and the addition of cp-mAb or a non-binding antibody. For each experiment, the data were fit globally using equation (26) with parameters χ0 and χ1 shared between each set of threshold measurements. For further experiment 2, 20 pmol mL−1 V2 contained no antibody (blue), before 4.5 pmol mL−1 cp-mAb was added (green). For further experiment 1, 23 pmol mL−1 V2 initially contained no antibody (blue), 91 fmol mL−1 mouse IgG2a isotype control was added (black) and then cp-mAb was added in two steps so that the concentration of cp-mAb was initially 91 fmol mL−1 (purple) and then increased to 1.9 pmol mL−1 (green). See Methods for more details. The threshold points derived from the fitted models have been plotted against time for, a further experiment 2 and for, b further experiment 1. Measurements have been represented by an arrow if the fitting implied that the sample could no longer sustain lasing. The error bars represent standard errors and the error bars that extend beyond the upper limit of the y-axis extend to infinity. See Supplementary Fig. 10 for an expanded version of this figure with the intensity against pump energy data for different points in the time series. Source data are provided as a Source Data file

References

    1. Coons AH, Creech HJ, Jones RN. Immunological properties of an antibody containing a fluorescent group. P. Soc. Exp. Biol. Med. 1941;47:200–202. doi: 10.3181/00379727-47-13084P. - DOI
    1. Sorokin PP, Lankard JR. Stimulated emission observed from an organic dye, chloro-aluminum phthalocyanine. IBM J. Res. Dev. 1966;10:162–163. doi: 10.1147/rd.102.0162. - DOI
    1. Sorokin PP, Lankard JR. Flashlamp excitation of organic dye lasers: a short communication. IBM J. Res. Dev. 1967;11:148–148. doi: 10.1147/rd.112.0148. - DOI
    1. Peterson OG, Webb JP, McColgin WC, Eberly JH. Organic dye laser threshold. J. Appl. Phys. 1971;42:1917–1928. doi: 10.1063/1.1660468. - DOI
    1. Zhen B, et al. Enabling enhanced emission and low-threshold lasing of organic molecules using special Fano resonances of macroscopic photonic crystals. Proc. Natl Acad. Sci. USA. 2013;110:13711–13716. doi: 10.1073/pnas.1311866110. - DOI - PMC - PubMed

Publication types