. 2019 Aug 9;10(1):3605.
doi: 10.1038/s41467-019-11583-1.

Synthetic molecular recognition nanosensor paint for microalbuminuria

Affiliations

Synthetic molecular recognition nanosensor paint for microalbuminuria

Januka Budhathoki-Uprety et al. Nat Commun. .

Abstract

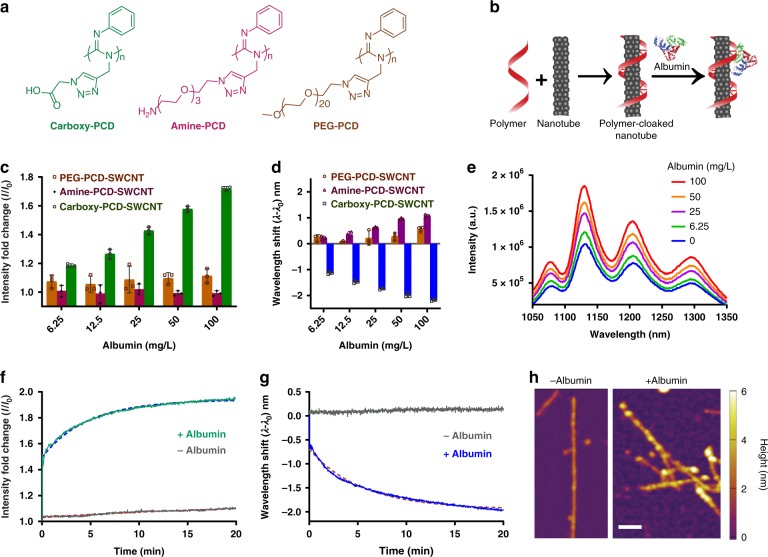
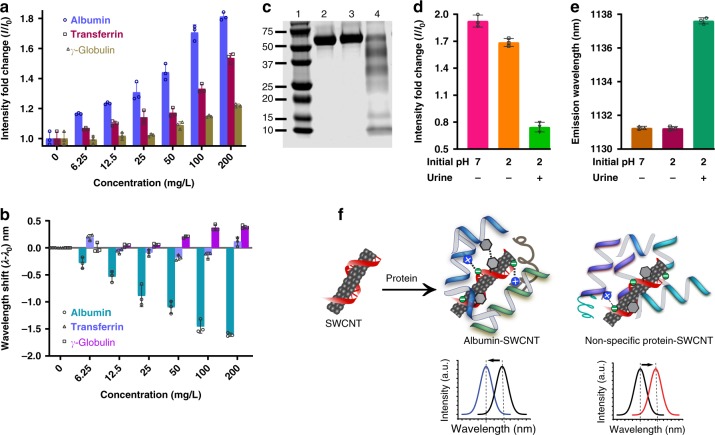
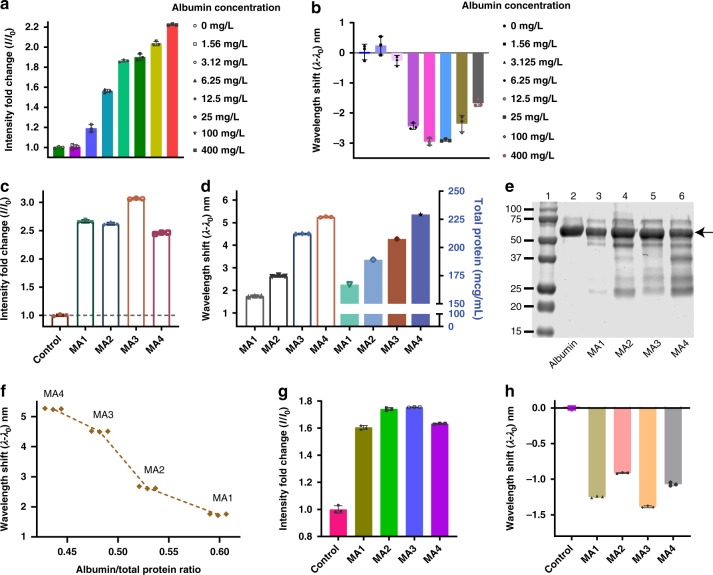
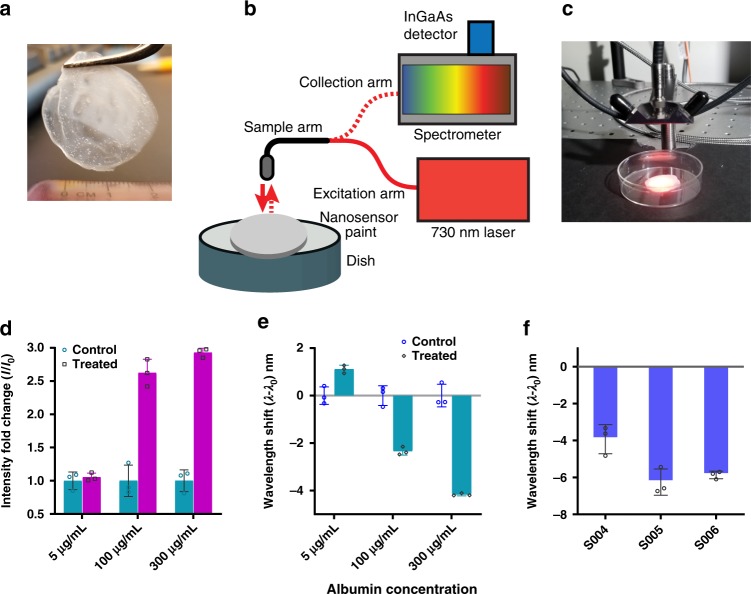
Microalbuminuria is an important clinical marker of several cardiovascular, metabolic, and other diseases such as diabetes, hypertension, atherosclerosis, and cancer. The accurate detection of microalbuminuria relies on albumin quantification in the urine, usually via an immunoturbidity assay; however, like many antibody-based assessments, this method may not be robust enough to function in global health applications, point-of-care assays, or wearable devices. Here, we develop an antibody-free approach using synthetic molecular recognition by constructing a polymer to mimic fatty acid binding to the albumin, informed by the albumin crystal structure. A single-walled carbon nanotube, encapsulated by the polymer, as the transduction element produces a hypsochromic (blue) shift in photoluminescence upon the binding of albumin in clinical urine samples. This complex, incorporated into an acrylic material, results in a nanosensor paint that enables the detection of microalbuminuria in patient samples and comprises a rapid point-of-care sensor robust enough to be deployed in resource-limited settings.


Conflict of interest statement

D.H. and J.B. are named on a patent application filed by MSKCC related to this work (Application No. US 62/038, 235, title: Helical Polycarbodiimide Polymers and Associated Imaging, Diagnostic, and Therapeutic Methods) D.H. and P.V.J. are cofounders and officers of LipidSense, Inc., D.H. is also a cofounder and officer with equity interest in Goldilocks Therapeutics Inc., as well as a member of the scientific advisory board of Oncorus, Inc. The remaining authors declare no competing interests.

Figures

Fig. 1
Fig. 1
Optical nanosensor for albumin detection. a Schematic showing PCD structures. b PCD-SWCNT complex formation and its interaction with albumin protein. c Emission intensity response of the PCD-SWCNT complexes ((9, 4) chirality) to albumin. d Emission wavelength response of the PCD-SWCNT complexes to albumin ((9, 4) chirality). e Photoluminescence emission spectra of carboxy-PCD-SWCNT complexes upon addition of albumin (concentration increasing from bottom to top). f Response curve of emission intensity of carboxy-PCD-SWCNT complexes ((9, 4) chirality) to albumin. g Response curve of emission intensity of carboxy-PCD-SWCNT complexes to albumin ((9, 4) chirality). h Atomic fore microscopy height profile images of carboxy-PCD-SWCNT complexes and the same complexes upon exposing to albumin. Scale bar indicates 50 nm. Error bars represent standard deviation for n = 3 technical replicates
Fig. 2
Fig. 2
Sensor response to interferents, and sensor mechanism. a Emission intensity response of the nanosensor to various proteins. b Emission wavelength response of the nanosensor to protein interferents. c SDS-PAGE gel where: lane 2 contains albumin at pH 7 incubated at room temperature for 30 min; lane 3 contains albumin incubated at pH 2 in PBS at room temperature for 30 min followed by neutralization; lane 4 contains albumin incubated in urine at pH 2 for 30 min followed by neutralization. d Emission intensity response of the nanosensor to intact albumin (bars 1–2, corresponding to lanes 2–3, respectively, in panel c) and degraded albumin (bar 3, corresponding to lane 4 in panel c). e Emission wavelength response of the nanosensor to intact albumin (bars 1–2, corresponding to lanes 2–3 in panel c) and degraded albumin (bar 3, corresponding to lane 4 in panel C). f A proposed model of albumin interaction with the carboxy-PCD-SWCNT nanosensor. Data in panels a, b and d, e present the (9, 4) nanotube chirality. Error bars represent standard deviation for n = 3 technical replicates
Fig. 3
Fig. 3
Sensor response in healthy and microalbuminuria patient samples. a Nanosensor emission intensity response to albumin spiked into human urine. b Emission wavelength response of the nanosensor to albumin in human urine. c Emission intensity response of the nanosensor to microalbuminuria patient samples. d Emission wavelength response of the nanosensor to microalbuminuria patient samples (left) and total protein determined via turbidimetry assay (right). e SDS-PAGE gel showing protein bands on microalbuminuria patient urine samples: (lane 1) molecular weight marker, (lane 2) albumin control, (lanes 3–6) microalbuminuria urine samples; arrow indicates albumin band. f Wavelength shift response from the nanosensor to total protein ratio in microalbuminuria urine samples. g Emission intensity response of the nanosensor to microalbuminuria urine samples after removal of interfering proteins. h Wavelength response of the nanosensor to microalbuminuria urine samples after removal of interfering proteins. The data presented in Fig 3a–h show the response of the (9,4) nanotube chirality. Error bars represent standard deviation for n = 3 technical replicates
Fig. 4
Fig. 4
Albumin detection using free-standing nanosensor paint. a Nanotube blended with acrylic-based paint forming a free-standing film. b Schematic showing probe-based system used to excite nanotubes and collect NIR emission. c Photograph showing data acquisition using the probe-based system. d Emission intensity response of the nanosensor paint to albumin. e Emission wavelength response of the nanosensor paint to albumin. f Nanosensor paint response from microalbuminuria patient’s urine samples (S004, S005, and S006). The data in panels df show the response of the (9, 4) nanotube chirality. Error bars represent standard deviation for n = 3 technical replicates

Similar articles

Cited by

References

    1. van der Vusse GJ. Albumin as fatty acid transporter. Drug Metab. Pharmacokinet. 2009;24:300–307. doi: 10.2133/dmpk.24.300. - DOI - PubMed
    1. Pardridge WM, Mietus LJ. Transport of steroid hormones through the rat blood-brain barrier. Primary role of albumin-bound hormone. J. Clin. Investig. 1979;64:145–154. doi: 10.1172/JCI109433. - DOI - PMC - PubMed
    1. Ghuman J, et al. Structural basis of the drug-binding specificity of human serum albumin. J. Mol. Biol. 2005;353:38–52. doi: 10.1016/j.jmb.2005.07.075. - DOI - PubMed
    1. Jorge LG, et al. Diabetic nephropathy: diagnosis, prevention, and treatment. Diabetes Care. 2005;28:164–176. doi: 10.2337/diacare.28.1.164. - DOI - PubMed
    1. Weir MR. Microalbuminuria and cardiovascular disease. Clin. J. Am. Soc. Nephrol. 2007;2:581–590. doi: 10.2215/CJN.03190906. - DOI - PubMed

Publication types