

Particulate matter-attributable mortality and relationships with carbon dioxide in 250 urban areas worldwide
- PMID: 31399636
- PMCID: PMC6689059
- DOI: 10.1038/s41598-019-48057-9
Particulate matter-attributable mortality and relationships with carbon dioxide in 250 urban areas worldwide
Abstract
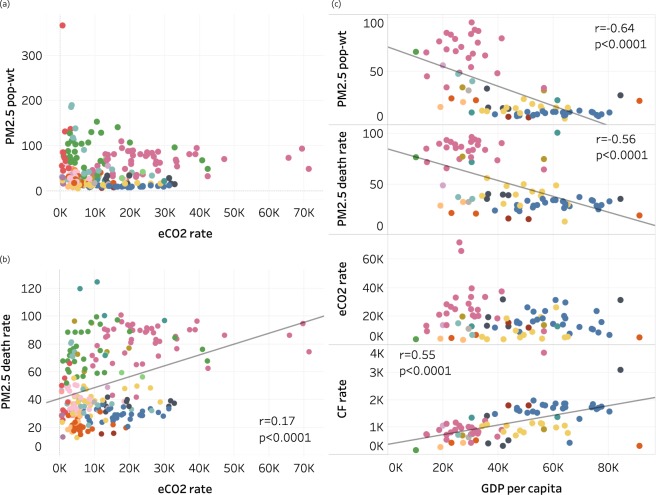
Urban air pollution is high on global health and sustainability agendas, but information is limited on associated city-level disease burdens. We estimated fine particulate matter (PM2.5) mortality in the 250 most populous cities worldwide using PM2.5 concentrations, population, disease rates, and concentration-response relationships from the Global Burden of Disease 2016 Study. Only 8% of these cities had population-weighted mean concentrations below the World Health Organization guideline for annual average PM2.5. City-level PM2.5-attributable mortality rates ranged from 13-125 deaths per 100,000 people. PM2.5 mortality rates and carbon dioxide (CO2) emission rates were weakly positively correlated, with regional influences apparent from clustering of cities within each region. Across 82 cities globally, PM2.5 concentrations and mortality rates were negatively associated with city gross domestic product (GDP) per capita, but we found no relationship between GDP per capita and CO2 emissions rates. While results provide only a cross-sectional snapshot of cities worldwide, they point to opportunities for cities to realize climate, air quality, and health co-benefits through low-carbon development. Future work should examine drivers of the relationships (e.g. development stage, fuel mix for electricity generation and transportation, sector-specific PM2.5 and CO2 emissions) uncovered here and explore uncertainties to test the robustness of our conclusions.
Conflict of interest statement
The authors declare no competing interests.
Figures

References
-
- United Nations General Assembly. Resolution adopted by the General Assembly on 25 September 2015: 70/1. Transforming our world: the 2030 Agenda for Sustainable Development (2015). Available at: https://www.un.org/en/development/desa/population/migration/generalassem... (accessed August 1, 2019).
-
- World Health Organization. Health and the Environment: Addressing the health impact of air pollution (2015). Available at: https://apps.who.int/iris/handle/10665/253206 (accessed August 1, 2019).
-
- United Nations. New Urban Agenda. (2016). Available at: http://habitat3.org/the-new-urban-agenda/ (accessed August 1, 2019).
-
- United Nations. World Urbanization Prospects: The 2014 Revision (2014). Available at: https://population.un.org/wup/Publications/Files/WUP2014-Report.pdf (accessed August 1, 2019).
