. 2019 Nov;132(11):3115-3128.
doi: 10.1007/s00122-019-03410-4. Epub 2019 Aug 9.

Dissecting genetic loci affecting grain morphological traits to improve grain weight via nested association mapping

Affiliations

Dissecting genetic loci affecting grain morphological traits to improve grain weight via nested association mapping

Xiaoqian Wang et al. Theor Appl Genet. 2019 Nov.

Abstract

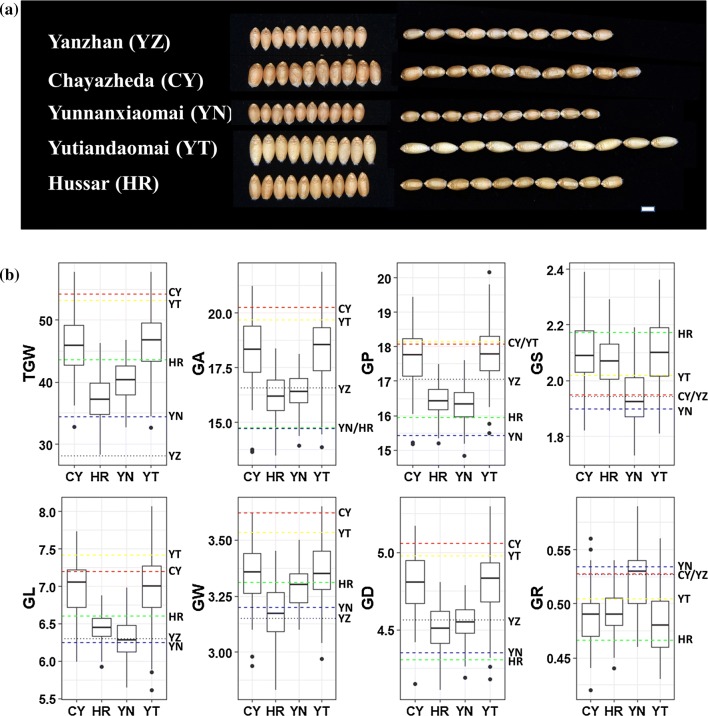
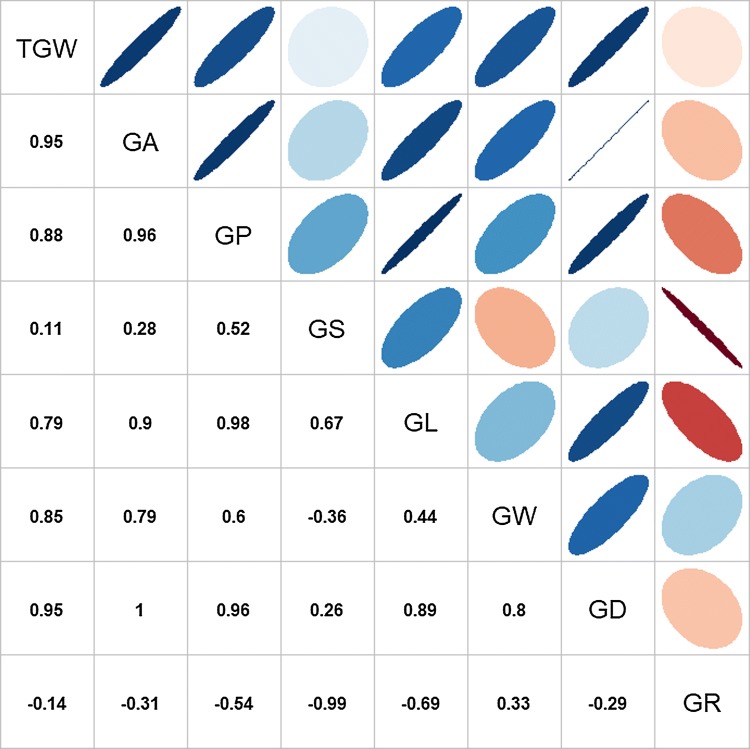
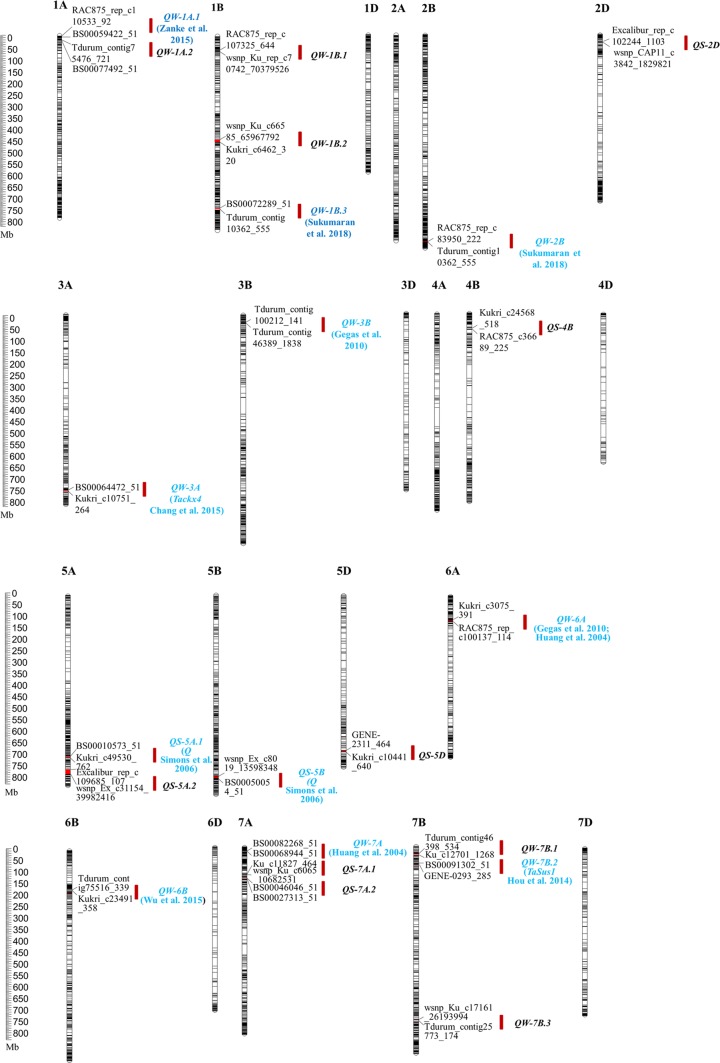
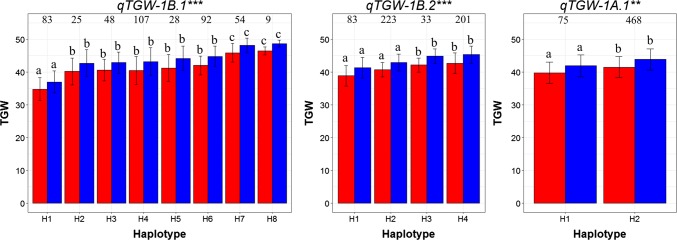
The quantitative trait loci (QTLs) for grain morphological traits were identified via nested association mapping and validated in a natural wheat population via haplotype analysis. Grain weight, one of the three most important components of crop yield, is largely determined by grain morphological traits. Dissecting the genetic bases of grain morphology could facilitate the improvement of grain weight and yield production. In this study, four wheat recombinant inbred line populations constructed by crossing the modern variety Yanzhan 1 with three semi-wild wheat varieties (i.e., Chayazheda, Yutiandaomai, and Yunnanxiaomai from Xinjiang, Tibet, and Yunnan, respectively) and one exotic accession Hussar from Great Britain were investigated for grain weight and eight morphological traits in seven environments. Eighty-eight QTLs for all measured traits were totally identified through nested association mapping utilizing 14,643 high-quality polymorphic single nucleotide polymorphism (SNP) markers generated by 90 K SNP array. Among them, 64 (72.7%) QTLs have the most favorable alleles donated by semi-wild wheat varieties. For 14 QTL clusters affecting at least two grain morphological traits, nine QTL clusters were located in similar position with known genes/QTL, and the other five were novel. Three important novel QTLs (i.e., qTGW-1B.1, qTGW-1B.2, and qTGW-1A.1) were further validated in a natural wheat population via haplotype analysis. The favorable haplotypes for these three QTLs might be used in marker-assisted selection for the improvement of wheat yield by modifying morphological traits.

Keywords: Grain morphology; Grain weight; Nested association mapping; QTL; Wheat.


Conflict of interest statement

The authors declare that they have no conflicts of interest.

Figures

Fig. 1
Fig. 1
a Grain morphology of five parents in Taian of 2017. The scale bar represents 3 mm. b Boxplots for eight wheat grain morphology traits and grain weight. CY, HR, YN, and YT represented the RIL populations coming from the cross of the common parent YZ and the corresponding male parent CY, HR, YN, and YT, respectively. TGW, thousand grain weight; GA, grain area; GP, grain perimeter; GS, grain shape; GL, grain length; GW, grain width; GD, grain diameter; GR, grain roundness. The black dotted line represented the common female parent YZ. The dashed line of red, green, blue, and yellow represented the male parent CY, HR, YN, and YT, respectively
Fig. 2
Fig. 2
Phenotypic correlations between eight evaluated traits using the BLUP value for each line. In the lower triangular, the values were correlation coefficients (r) multiplied by 100. In the upper triangular, the areas and colors of ellipses showed the absolute value of corresponding r. Right and left oblique ellipses indicated positive and negative correlations, respectively. The values without glyphs indicated insignificant at 0.01
Fig. 3
Fig. 3
QTL clusters for eight traits evaluated. The QTLs in green were mapped to a similar location with related cloned genes or mapped QTL reported previously
Fig. 4
Fig. 4
Haplotype analysis for three important QTL qTGW-1B.1, qTGW-1B.2, and qTGW-1A.1 using a natural wheat population containing 574 cultivars or lines. The ** and *** suggested significance of ANOVA at p < 0.01 and p < 0.001, respectively. The letter on histogram (a, b, and c) indicated multiple comparisons result at the significant level 0.01. The red and blue bars indicated the TGW in Taian of 2017 and 2018, respectively

References

    1. Alaux M, Letellier T, Alfama-Depauw F, Jamilloux V, Rogers J, Choulet F, Guerche C, Loaec M, Flores R-G, Michotey C (2016) IWGSC Sequence Repository: Moving towards tools to facilitate data integration for the reference sequence of wheat. In: PAG XXIV-Plant and Animal Genome Conference, San Diego, USA, 2016-01-09-2016-01-13
    1. Bradbury PJ, Zhang Z, Kroon DE, Casstevens TM, Ramdoss Y, Buckler ES. TASSEL: software for association mapping of complex traits in diverse samples. Bioinformatics. 2007;23:2633–2635. doi: 10.1093/bioinformatics/btm308. - DOI - PubMed
    1. Brown TA, Jones MK, Powell W, Allaby RG. The complex origins of domesticated crops in the fertile crescent. Trends Ecol Evol. 2009;24:103–109. doi: 10.1016/j.tree.2008.09.008. - DOI - PubMed
    1. Chang C, Lu J, Zhang HP, Ma CX, Sun G. Copy number variation of cytokinin oxidase gene Tackx4 associated with grain weight and chlorophyll content of flag leaf in common wheat. PLoS ONE. 2015;10:e0145970. doi: 10.1371/journal.pone.0145970. - DOI - PMC - PubMed
    1. Charmet G. Wheat domestication: lessons for the future. CR Biol. 2011;334:212. doi: 10.1016/j.crvi.2010.12.013. - DOI - PubMed

LinkOut - more resources