. 2020 Feb;83(2):462-478.
doi: 10.1002/mrm.27937. Epub 2019 Aug 9.

CEST MR-Fingerprinting: Practical considerations and insights for acquisition schedule design and improved reconstruction

Affiliations

CEST MR-Fingerprinting: Practical considerations and insights for acquisition schedule design and improved reconstruction

Or Perlman et al. Magn Reson Med. 2020 Feb.

Abstract

Purpose: To understand the influence of various acquisition parameters on the ability of CEST MR-Fingerprinting (MRF) to discriminate different chemical exchange parameters and to provide tools for optimal acquisition schedule design and parameter map reconstruction.

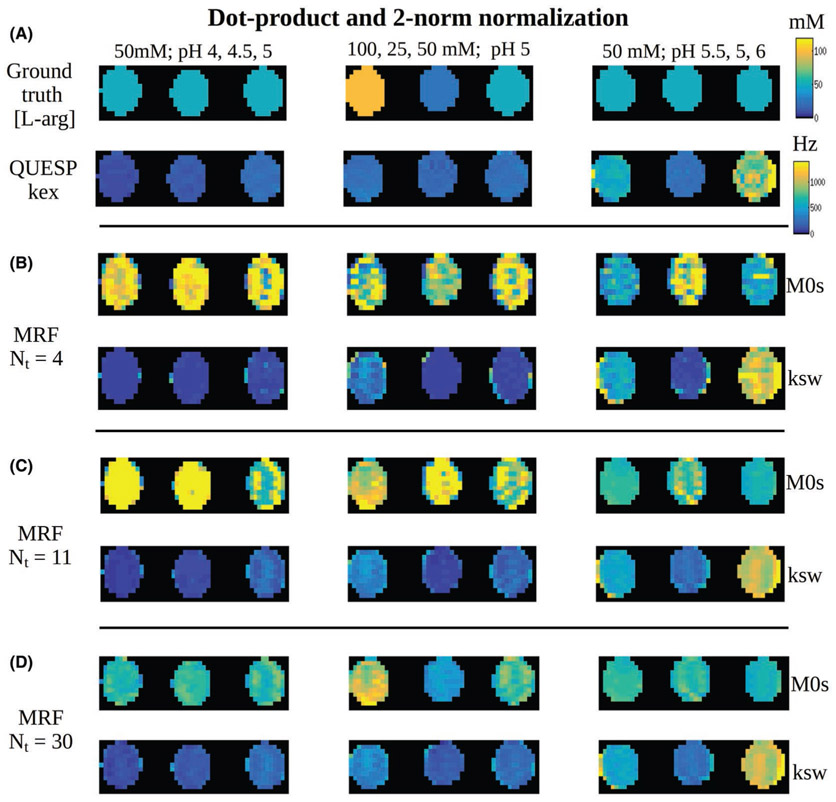
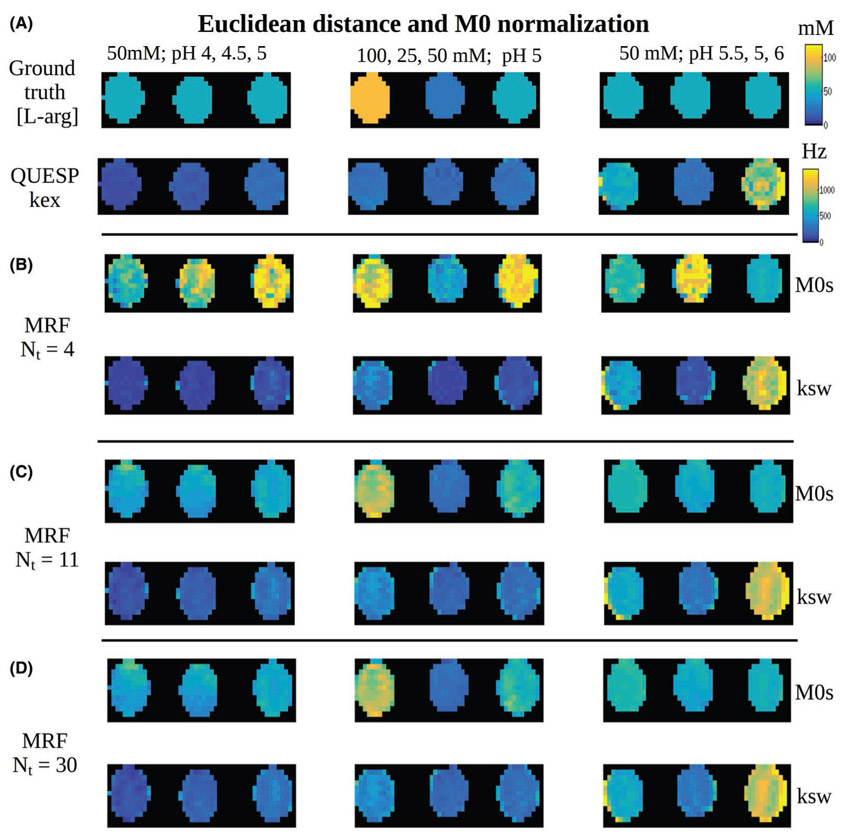
Methods: Numerical simulations were conducted using a parallel computing implementation of the Bloch-McConnell equations, examining the effect of TR, TE, flip-angle, water T1 and T2 , saturation-pulse duration, power, and frequency on the discrimination ability of CEST-MRF. A modified Euclidean distance matching metric was evaluated and compared to traditional dot product matching. L-Arginine phantoms of various concentrations and pH were scanned at 4.7T and the results compared to numerical findings.

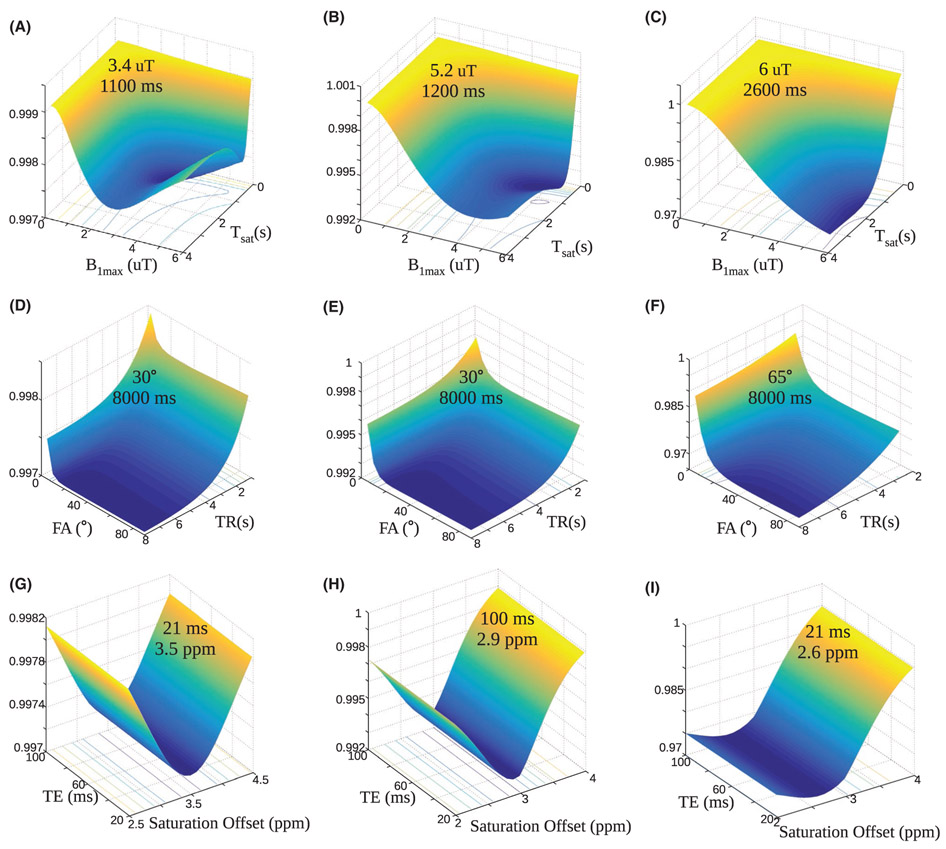
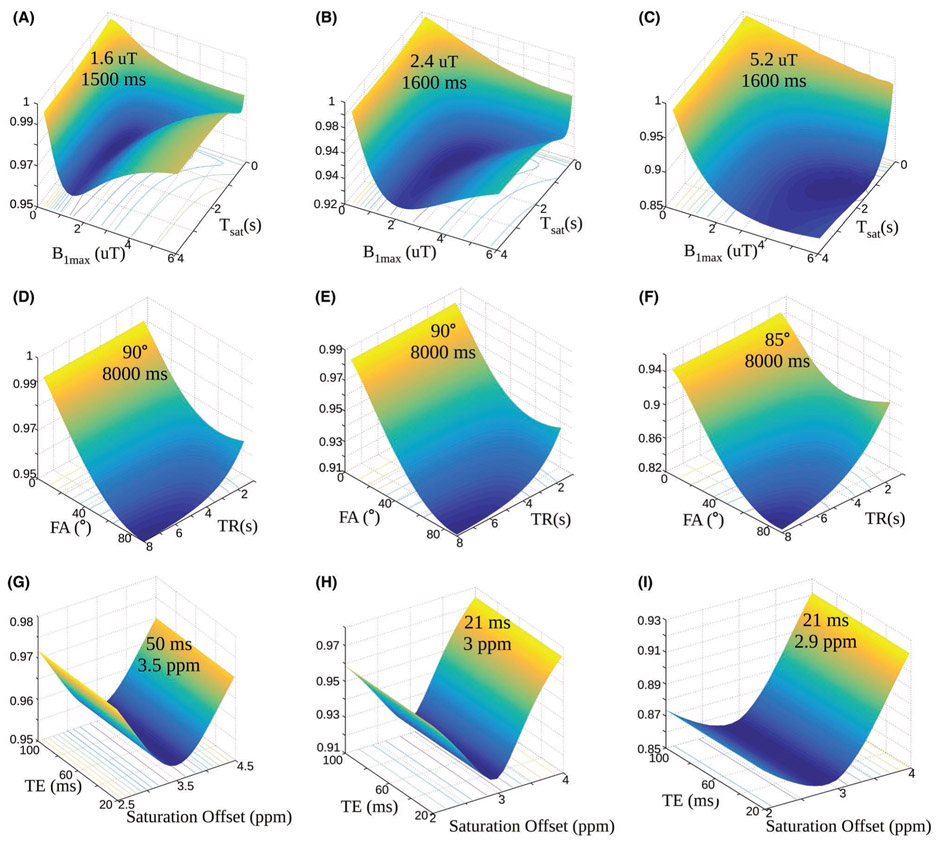
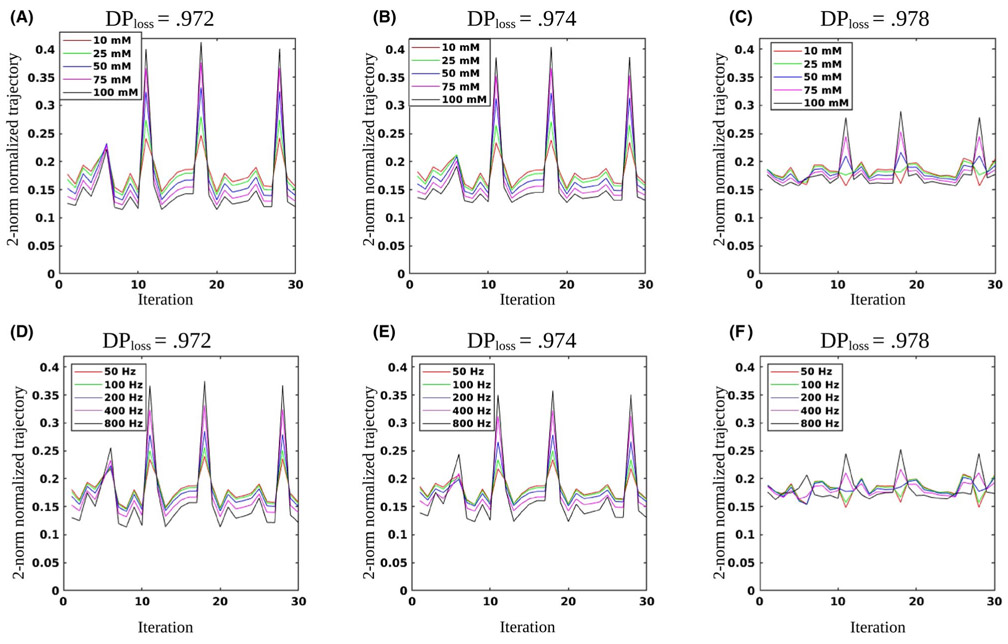
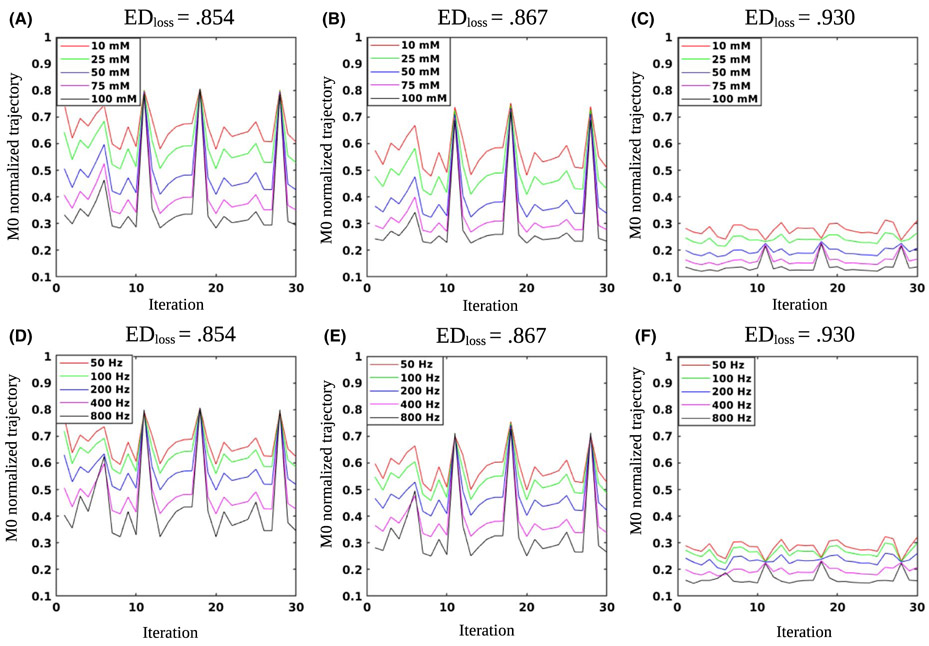
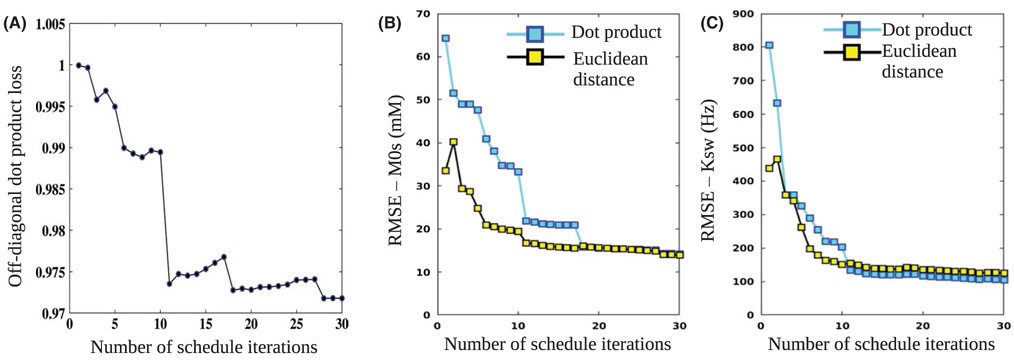
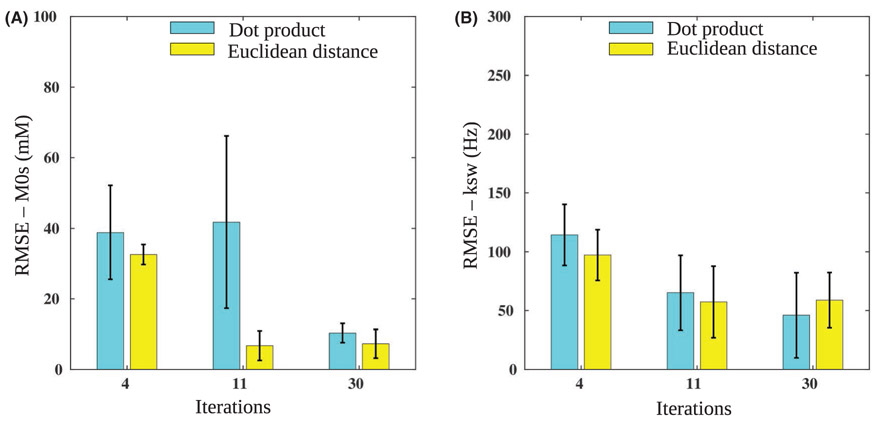
Results: Simulations for dot product matching demonstrated that the optimal flip-angle and saturation times are 30 and 1100 ms, respectively. The optimal maximal saturation power was 3.4 μT for concentrated solutes with a slow exchange rate, and 5.2 μT for dilute solutes with medium-to-fast exchange rates. Using the Euclidean distance matching metric, much lower maximum saturation powers were required (1.6 and 2.4 μT, respectively), with a slightly longer saturation time (1500 ms) and 90 flip-angle. For both matching metrics, the discrimination ability increased with the repetition time. The experimental results were in agreement with simulations, demonstrating that more than a 50% reduction in scan-time can be achieved by Euclidean distance-based matching.

Conclusions: Optimization of the CEST-MRF acquisition schedule is critical for obtaining the best exchange parameter accuracy. The use of Euclidean distance-based matching of signal trajectories simultaneously improved the discrimination ability and reduced the scan time and maximal saturation power required.

Keywords: chemical exchange rate; chemical exchange saturation transfer (CEST); magnetic resonance fingerprinting (MRF); optimization; pH; quantitative imaging.


Figures

FIGURE 1
FIGURE 1
Dependence of the dot product loss on the acquisition parameters. The surface plots with projected loss iso-contours describe the effect of the maximal saturation power and the saturation time (Tsat) (A-C), the flip angle (FA) and TR (D-F), and the TE and saturation frequency offset (G-I), on the DPloss, for scenarios A (left column), B (center column), and C (right column). In all images, the z-axis represents the DPloss, which is also color coded from blue to yellow. The optimal combination for each examined parameter pair is given in the surface plot
FIGURE 2
FIGURE 2
Dependence of the Euclidean distance loss on the acquisition parameters. The surface plots with projected loss iso-contours describe the effect of the maximal saturation power and the saturation time (Tsat) (A-C), the FA and TR (D-F), and the TE and saturation frequency offset (G-I), on the EDloss, for scenarios A (left column), B (center column), and C (right column). In all images, the z-axis represents the EDloss, which is also color coded from blue to yellow. The optimal combination for each examined parameter pair is given in the surface plot
FIGURE 3
FIGURE 3
Exemplary trajectories for different combinations of acquisition schedule parameters normalized by the 2-norm (for dot product matching). In (A-C), the exchange rate was fixed at 400 Hz, and the solute concentration varied from 10 to 100 mM. In (d-f), the solute concentration was fixed on 50 mM, and the exchange rate varied from 50 to 800 Hz. The left column represents a close to optimal acquisition parameters combination (TR was set to 4s instead of 8s for speed considerations), with saturation time (Tsat) = 2600 ms, FA = 60°, saturation offset = 2.6 ppm, TE = 21 ms, maximum saturation power = 6 μT. The center column represents the baseline acquisition schedule (Tsat = 3000 ms, saturation offset = 3 ppm, see Section 2.5), and the right column represents the same schedule, but with shorter saturation time and excitation flip angle (FA = 15°, and Tsat = 1500 ms). The same CEST properties of scenario “C” were used for all trajectories
FIGURE 4
FIGURE 4
Exemplary trajectories for different combinations of acquisition schedule parameters normalized by M0 (for Euclidean distance matching). In (A-C), the exchange rate was fixed at 400 Hz, and the solute concentration varied from 10 to 100 mM. In (D-F), the solute concentration was fixed on 50 mM, and the exchange rate varied from 50 to 800 Hz. The left column represents a close to optimal acquisition parameters combination (TR was set to 4s instead of 8s for speed considerations), with saturation time (Tsat) = 1600 ms, FA = 90°, saturation offset = 2.9 ppm, TE = 21 ms, maximum saturation power = 5.2 μT. The center column represents the baseline acquisition schedule (Tsat = 3000 ms, saturation offset = 3 ppm, see Section 2.5), and the right column represents the same schedule, but with shorter saturation time and excitation flip angle (FA = 15°, and Tsat = 1500 ms). The same CEST properties of scenario “C” were used for all trajectories
FIGURE 5
FIGURE 5
Optimization of the schedule length. A, DPloss values for the baseline schedule with varied lengths. Note the step-like shape, predicting noticeable performance improvement at Nt = 11, with further improvement when additional iterations are added. B, Solute concentration (M0s) RMSE, comparing the dot product and Euclidean distance-based matching. C, Proton exchange rate (ksw) RMSE for both matching metrics
FIGURE 6
FIGURE 6
Dot product matching of CEST-MRF phantom images. A, Reference of known solute concentration (top) and QUESP proton exchange rate images (bottom) for the 9 imaged vials. B-D, Dot product reconstructed CEST-MRF images for 4, 11, and 30 iterations, respectively. The same color map and dynamic range (top-right) were used for all images
FIGURE 7
FIGURE 7
Euclidean distance matching of CEST-MRF phantom images. A, Reference of known solute concentration (top) and QUESP proton exchange rate images (bottom) for the 9 imaged vials. B-D, Euclidean distance reconstructed CEST-MRF images for 4, 11, and 30 iterations, respectively. The same color map and dynamic range (top-right) were used for all images
FIGURE 8
FIGURE 8
Phantom study quantitative analysis. RMSE values for solute concentration (M0s) (A), and chemical exchange rate (ksw) (B), using the baseline schedule with varied lengths. Note the significant performance improvement at Nt = 11 for Euclidean distance M0s matching (A), significantly lower than the dot product respective values. No significant improvement occurs for the Euclidean distance at Nt = 30, suggesting the schedule can be shortened without harming performance

References

    1. Van Zijl PCM, Yadav Nirbhay N. Chemical exchange saturation transfer (CEST): what is in a name and what isn’t? Magn Reson Med. 2011;65:927–948. - PMC - PubMed
    1. Ward KM, Balaban RS. Determination of pH using water protons and chemical exchange dependent saturation transfer (CEST). Magn Reson Med. 2000;44:799–802. - PubMed
    1. Zaiss M, Bachert P. Chemical exchange saturation transfer (CEST) and MR Z-spectroscopy in vivo: a review of theoretical approaches and methods. Phys Med Biol. 2013;58:R221. - PubMed
    1. Liu G, Song X, Chan KW, McMahon MT. Nuts and bolts of chemical exchange saturation transfer MRI. NMR Biomed. 2013;26:810–828. - PMC - PubMed
    1. Zhou J, Tryggestad E, Wen Z, et al. Differentiation between glioma and radiation necrosis using molecular magnetic resonance imaging of endogenous proteins and peptides. Nat Med. 2011;17:130–144. - PMC - PubMed

Publication types