. 2019 Oct 10;47(18):e110.
doi: 10.1093/nar/gkz654.

A deep learning genome-mining strategy for biosynthetic gene cluster prediction

Affiliations

A deep learning genome-mining strategy for biosynthetic gene cluster prediction

Geoffrey D Hannigan et al. Nucleic Acids Res. .

Abstract

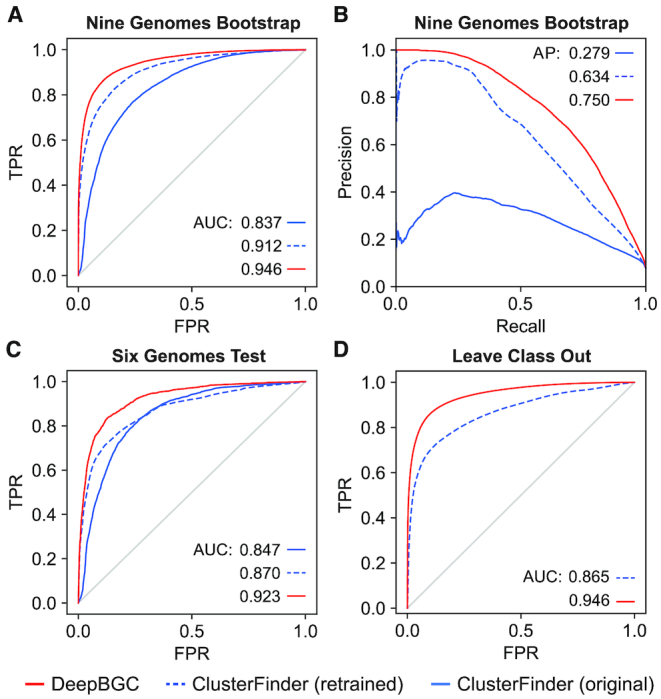
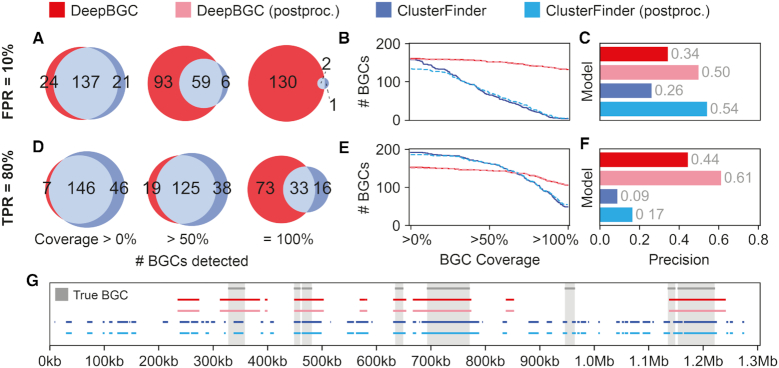
Natural products represent a rich reservoir of small molecule drug candidates utilized as antimicrobial drugs, anticancer therapies, and immunomodulatory agents. These molecules are microbial secondary metabolites synthesized by co-localized genes termed Biosynthetic Gene Clusters (BGCs). The increase in full microbial genomes and similar resources has led to development of BGC prediction algorithms, although their precision and ability to identify novel BGC classes could be improved. Here we present a deep learning strategy (DeepBGC) that offers reduced false positive rates in BGC identification and an improved ability to extrapolate and identify novel BGC classes compared to existing machine-learning tools. We supplemented this with random forest classifiers that accurately predicted BGC product classes and potential chemical activity. Application of DeepBGC to bacterial genomes uncovered previously undetectable putative BGCs that may code for natural products with novel biologic activities. The improved accuracy and classification ability of DeepBGC represents a major addition to in-silico BGC identification.


Figures

Figure 1.
Figure 1.
Overview of the deep learning strategy for detection of Biosynthetic Gene Clusters in bacterial genomes. (From top to bottom) raw genomic sequences (solid line) are used for gene (arrowhead structures) prediction by Prodigal (27). Pfam domains (circles, penta- and hexagons) are assigned to each ORF using hmmscan (17). The BiLSTM outputs classification score (blue bars) for each domain. Domain scores are summarized across genes, which are selected accordingly (blue arrowhead structures). Consecutive candidate BGC genes are assembled to putative BGCs (dashed rectangles). An optional post-processing step allowed merging of neighboring BGCs based on the presence of a known biosynthetic pathway, minimum cluster length, and gaps between adjacent BGCs (gray rectangles). BGCs were classified using random forest classifiers based on compound class and molecular activity (yellow rectangles).
Figure 2.
Figure 2.
Bidirectional Long-Short Term Memory (BiLSTM) neural network architecture (left to right blocks). The network consists of three layers: input, BiLSTM network, and output layer. (Top to bottom) Each row represents a time step where the BiLSTM model processes a single Pfam domain from the input sequence that is maintained in genomic order. Each Pfam domain is represented as a vector of precomputed 100-dimensional pfam2vec skip-gram embedding and two binary flags indicating whether the domain is found at the beginning or at the end of a given protein. Each LSTM memory cell receives the vector from input layer (full arrows) as well as the cell's internal state that represents all previously seen Pfam domains (dashed arrows). The backward LSTM layer processes the vectors in reverse order, hence bi-directional. In each timestep, output from both LSTM memory cells (boxes) is processed through a single fully-connected node with sigmoid activation function (circle) that outputs a single BGC classification score for the given Pfam domain.
Figure 3.
Figure 3.
Model validation and testing on Pfam domain level using the (A) Receiver Operating Characteristic (ROC) curves and (B) Precision (Y-axis) Recall (X-axis) Curve reflecting performance of: (blue) original ClusterFinder HMM model, (dashed blue) ClusterFinder HMM model retrained with latest training data and latest Pfam database, and (red) DeepBGC. A total of 291 BGCs in nine bacterial genomes were used for testing, none of them were included in the training set. The DeepBGC ROC represents combination of 5 test set predictions following bootstrap. AUC (Area Under the Curve) values are as indicated: FPR – False Positive Rate (X-axis); TPR – True positive rate (Y-axis). (C) ROC curves reflecting performance using a total of 65 experimentally validated BGCs that were used for testing, none of them were included in the training set. (D) ROC curves reflecting average performance in ‘Leave-Class-Out’ analysis. The mean AUC for all classes is given. For individual classes performance see Supplementary Figure S5.
Figure 4.
Figure 4.
Precision and coverage of DeepBGC and ClusterFinder algorithms. (A) Number of true BGCs detected by DeepBGC (red), ClusterFinder (blue) and both models (grey), based on three BGC coverage thresholds: any (>0%), majority (>50%), and full (100%). Coverage of each annotated true BGC is defined as the fraction of its nucleotide sequence overlapping with co-located predicted BGCs. The first bootstrap test split of seven out of nine genomes was used for comparison. Domains were retrieved based on a fixed False Positive Rate (FPR) of 10%. Genes containing candidate Pfam domains were summarized to produce putative BGCs that were compared to the actual BGCs in the split data. (B) Cumulative coverage plot of actual BGCs by predicted BGCs for DeepBGC (red) and ClusterFinder (blue) also following post-processing (dashed). (C) BGC level precision for DeepBGC (red) and ClusterFinder (blue) also following post-processing (light colors) at FPR 10%. Precision was calculated as follows: the number of true positives (any overlap between actual and predicted BGCs) divided by total number of predicted BGCs. (D–F) Same as ‘AC’ but at 80% TPR cutoff (G) A snapshot of contig view (X-axis genomic coordinates of Micromonospora sp.), manually confirmed BGCs (grey shade and bar), ClusterFinder raw and post-processed predictions (dark and light blue), DeepBGC raw and post-processed (dark and light red). For simplicity only part of the contig is shown and only at 80% TPR threshold. For all contigs, thresholds and models, see Supplementary Figures S7 and S8.
Figure 5.
Figure 5.
DeepBGC uncovers novel BGCs with antibacterial activity in bacterial genomes. (A) Comparison of BGC predictions between (left) ClusterFinder, (middle) antiSMASH and (right) DeepBGC. Default ClusterFinder settings from antiSMASH suite were used. For antiSMASH, rule-based predictions under default settings were considered. In DeepBGC, a 2% FPR at the domain level was applied with no further post-processing. CF – ClusterFinder; aS -antiSMASH. (B) t-Distributed Stochastic Neighbor Embedding (t-SNE) of all 1355 class labelled BGCs from the MIBiG database (circles) overlaid with the putative novel 227 BGCs that could be predicted solely by DeepBGC (plus signs). BGCs were represented by the mean value of their pfam2vec domain vectors and are colored by the respective known or predicted class as indicated. (C) A snapshot of contig view (X-axis genomic coordinates of Mycobacterium tuberculosis) of BGC predictions by (red) DeepBGC, (blue) ClusterFinder, and (orange) antiSMASH combined with ClusterFinder. A novel BGC candidate predicted only by DeepBGC is highlighted (light red shade). (D) The novel BGC structure is given, respective genes are colored based on the underlying domain type. For domain IDs see Supplementary Table S14.

References

    1. Newman D.J., Cragg G.M.. Natural products as sources of new drugs over the 30 years from 1981 to 2010. J. Nat. Prod. 2012; 75:311–335. - PMC - PubMed
    1. Milshteyn A., Schneider J.S., Brady S.F.. Mining the metabiome: identifying novel natural products from microbial communities. Chem. Biol. 2014; 21:1211–1223. - PMC - PubMed
    1. Ventola C.L. The antibiotic resistance crisis: part 1: causes and threats. P T. 2015; 40:277–283. - PMC - PubMed
    1. Pendleton J.N., Gorman S.P., Gilmore B.F.. Clinical relevance of the ESKAPE pathogens. Expert Rev. Anti. Infect. Ther. 2013; 11:297–308. - PubMed
    1. Zhang H., Chen J.. Current status and future directions of cancer immunotherapy. J. Cancer. 2018; 9:1773–1781. - PMC - PubMed

Publication types