Clinical Trial
. 2019 Dec;49(12):1587-1597.
doi: 10.1111/cea.13481. Epub 2019 Oct 31.

Rhinovirus-16 induced temporal interferon responses in nasal epithelium links with viral clearance and symptoms

Affiliations
Clinical Trial

Rhinovirus-16 induced temporal interferon responses in nasal epithelium links with viral clearance and symptoms

Abilash Ravi et al. Clin Exp Allergy. 2019 Dec.

Abstract

Background: The temporal in vivo response of epithelial cells to a viral challenge and its association with viral clearance and clinical outcomes has been largely unexplored in asthma.

Objective: To determine gene expression profiles over time in nasal epithelial cells (NECs) challenged in vivo with rhinovirus-16 (RV16) and compare to nasal symptoms and viral clearance.

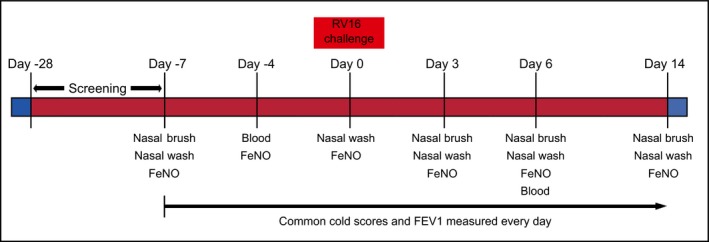
Methods: Patients with stable mild to moderate asthma (n = 20) were challenged intranasally with RV16. Nasal brush samples for RNA sequencing were taken 7 days prior to infection and 3, 6 and 14 days post-infection, and blood samples 4 days prior to infection and day 6 post-infection. Viral load was measured in nasal lavage fluid at day 3, 6 and 14.

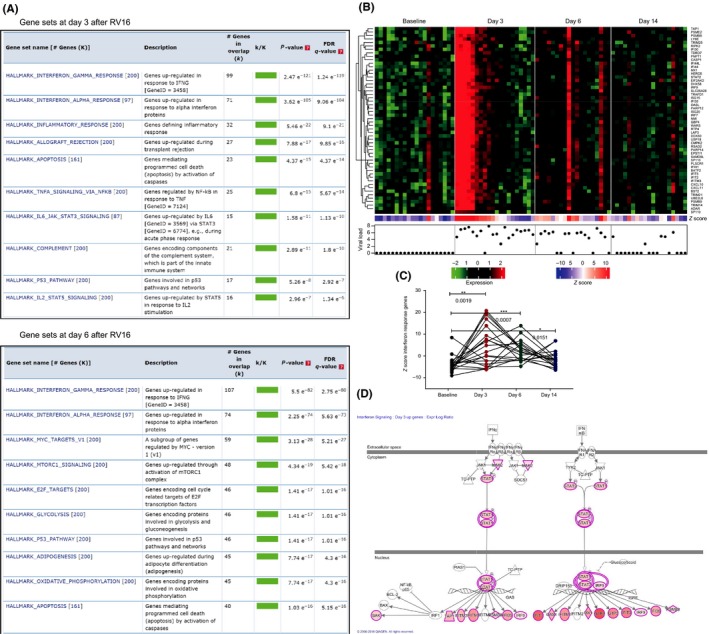
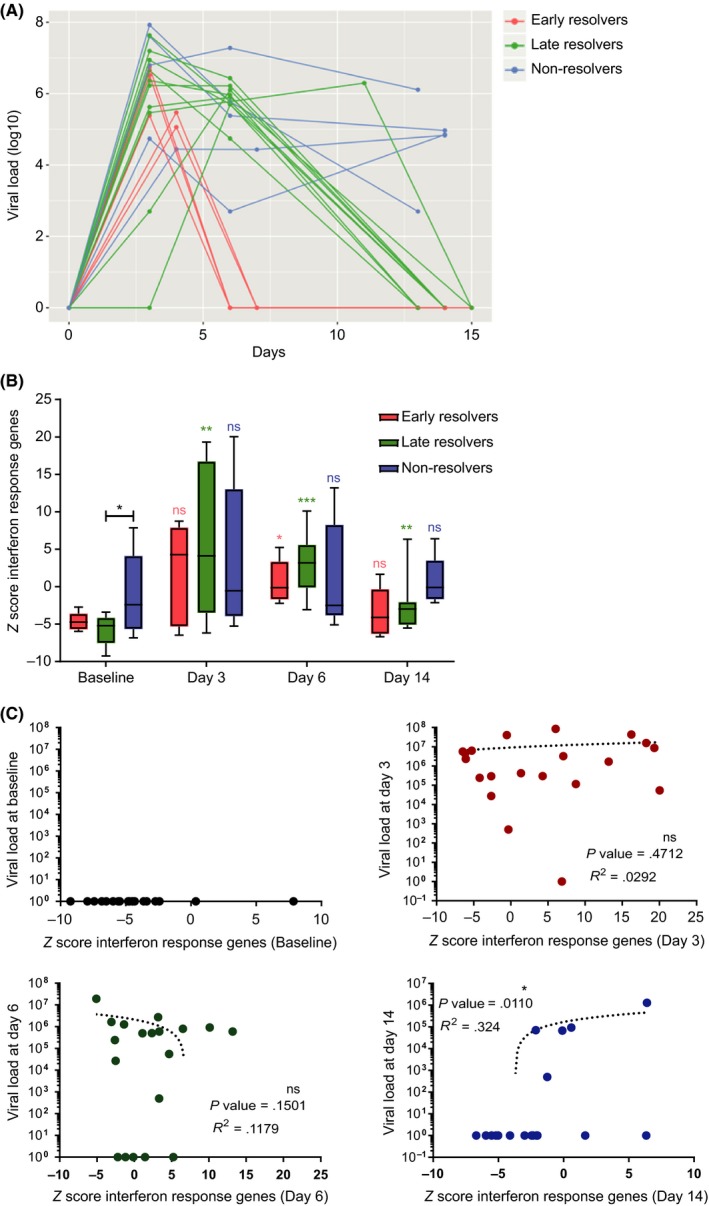
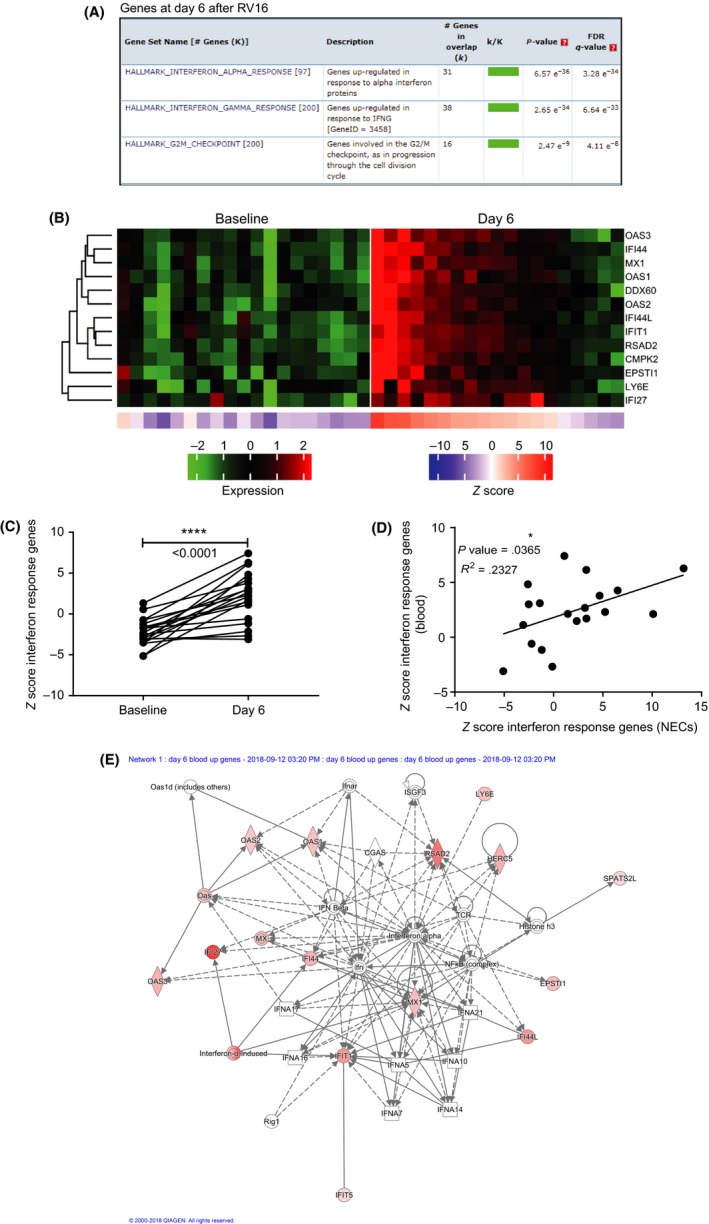
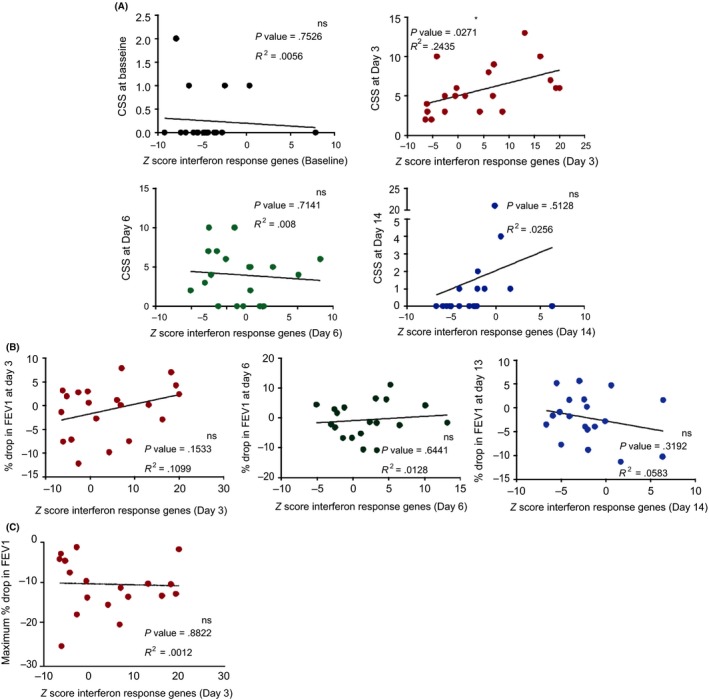
Results: Top differentially (>2.5-fold increase) expressed gene sets in NECs post-RV16 at days 3 and 6, compared with baseline, were interferon alpha and gamma response genes. Patients clearing the virus within 6 days (early resolvers) had a significantly increased interferon response at day 6, whereas those having cleared the virus by day 14 (late resolvers) had significantly increased responses at day 3, 6 and 14. Interestingly, patients not having cleared the virus by day 14 (non-resolvers) had no enhanced interferon responses at any of these days. The daily Cold Symptom Scores (CSS) peaked at days 3 to 5 and correlated positively with interferon response genes at day 3 (R = 0.48), but not at other time-points. Interferon response genes were also enhanced in blood at day 6 after RV16 challenge.

Conclusion and clinical relevance: This study shows that viral load and clearance varies markedly over time in mild to moderate asthma patients exposed to a fixed RV16 dose. The host's nasal interferon response to RV16 at day 3 is associated with upper respiratory tract symptoms. The temporal interferon response in nasal epithelium associates with viral clearance in the nasal compartment.

Keywords: asthma; epithelium; innate immunity; interferon response; nasal epithelium; rhinovirus; virus.


Conflict of interest statement

The research leading to these results has received support from the Innovative Medicines Initiative (IMI) Joint Undertaking, under grant agreement no. 115010, resources for which are composed of financial contribution from the European Union's Seventh Framework Programme (FP7/2007‐2013) and kind contributions from companies in the European Federation of Pharmaceutical Industries and Associations (EFPIA) (http://www.imi.europa.eu). The authors declare no other conflict of interests.

Figures

Figure 1
Figure 1
An overview of the study design. Screening was performed 28 d before experimental rhinovirus infection. Nasal washes, brushes and blood were collected on indicated days. Cold Symptom Scores and FEV1 were measured every d from 7 d before RV16 until 14 d after RV16 administration to asthma patients
Figure 2
Figure 2
Interferon alpha and gamma response gene sets are the most differentially expressed sets, relative to baseline, in nasal epithelium at days 3 and 6. A, Gene set enrichment analysis of all differentially expressed genes showed that interferon gamma and alpha response gene sets were up‐regulated at days 3 and 6 after RV16 in nasal epithelial cells of asthma patients. B, Heat maps of interferon response genes common for both interferon alpha and gamma were enhanced at day 3 (n = 20), day 6 (n = 19) and day 14 (n = 19) after RV16 challenge compared with baseline (7 d before RV16; n = 20). The heat maps for respective patients are shown in the same order for each day. The viral load represented as log10, measured in nasal brushes, is provided below the heat maps for respective days and corresponding asthma patients. C, Z scores of interferon response genes were plotted per patient and were significantly increased at day 3, day 6 and day 14 after RV16 compared with baseline (7 d before RV16); *< .05, **< .01, ***< .001, paired t tests. D, Ingenuity pathway analysis of all differentially expressed genes revealed that interferon signalling pathway is up‐regulated after RV16 at days 3 and 6 after RV16, but not at day 14. The coloured nodes represent differentially expressed genes, where the higher the intensity of the node colour, the higher the gene expression is. The genes in white nodes are not differentially expressed
Figure 3
Figure 3
Interferon response gene expression in nasal epithelium from asthma patients correlates with clearance of RV16. A, Asthma patients separated in three groups based on viral clearance. In early resolvers (red), virus was cleared by day 6, and in late resolvers (green), virus was cleared by day 14. In the non‐resolvers (blue), virus was not yet cleared at day 14. B, The Z scores of common interferon response genes for early (n = 5), late (n = 10) and non‐resolvers (n = 5); *< .05, **< .01, ***< .001, paired t tests (all comparisons of the respective groups to their baseline at different days). At baseline, non‐resolvers had higher interferon response gene expression compared with late resolvers; *< .05, unpaired t test. C, Viral load in nasal lavage did not correlate with Z scores of interferon response gene sets at any of the days in nasal epithelial cells from asthma patients (Pearson's correlation coefficient)
Figure 4
Figure 4
Systemic interferon response gene expression in blood is increased at day 6, as in the nasal compartment. A, In blood, gene set enrichment analysis showed that interferon response gene sets (both alpha and gamma) are up‐regulated at day 6. B, Heat maps of interferon response for respective patients (same order before and after RV16) are enhanced at day 6 after RV16 (n = 19). C, Z scores of blood interferon response genes of individual patients significantly increased 6 days after RV16 compared with baseline (day = −4); ****< .0001, paired t tests. D, The Z scores of interferon response genes at day 6 after RV16 in blood and nasal epithelium correlated significantly (Pearson's correlation analysis). E, Gene network identification by IPA representing the most influential interferon‐related genes. Genes are connected by solid lines (direct interaction) and dotted lines (indirect interaction)
Figure 5
Figure 5
Interferon response gene expression in nasal epithelium at day 3 correlates with peak of upper airway symptoms. A, Cold Symptom Score (CSS) correlated with Z scores of interferon response genes only at day 3 (red) at which there was the highest expression of interferon response genes. While at baseline (black), day 6 (green) and day 13 (blue), there was no correlation observed between CSS and interferon response genes at their respective time‐points (Pearson's correlation coefficient). B, The Z scores of interferon response genes did not correlate with the drop in % FEV1 measured at day 3 (n = 20), day 6 (n = 19) and day 13 (n = 19) and C, also the maximum drop in % FEV1 over 14 d after RV16 (n = 20). All correlations were performed using Pearson's correlation coefficient

References

    1. van der Sluijs KF, van de Pol MA, Kulik W, et al. Systemic tryptophan and kynurenine catabolite levels relate to severity of rhinovirus‐induced asthma exacerbation: a prospective study with a parallel‐group design. Thorax. 2013;68(12):1122‐1130. - PubMed
    1. Corne JM, Marshall C, Smith S, et al. Frequency, severity, and duration of rhinovirus infections in asthmatic and non‐asthmatic individuals: a longitudinal cohort study. Lancet. 2002;359(9309):831‐834. - PubMed
    1. Message SD, Laza‐Stanca V, Mallia P, et al. Rhinovirus‐induced lower respiratory illness is increased in asthma and related to virus load and Th1/2 cytokine and IL‐10 production. Proc Natl Acad Sci USA. 2008;105(36):13562‐13567. - PMC - PubMed
    1. Wark PAB, Johnston SL, Bucchieri F, et al. Asthmatic bronchial epithelial cells have a deficient innate immune response to infection with rhinovirus. J Exp Med. 2005;201(6):937‐947. - PMC - PubMed
    1. Edwards MR, Regamey N, Vareille M, et al. Impaired innate interferon induction in severe therapy resistant atopic asthmatic children. Mucosal Immunol. 2013;6(4):797‐806. - PMC - PubMed

Publication types