. 2019 Sep;21(9):921-931.
doi: 10.1016/j.neo.2019.07.004. Epub 2019 Aug 8.

The Adiponectin-AdipoR1 Axis Mediates Tumor Progression and Tyrosine Kinase Inhibitor Resistance in Metastatic Renal Cell Carcinoma

Affiliations

The Adiponectin-AdipoR1 Axis Mediates Tumor Progression and Tyrosine Kinase Inhibitor Resistance in Metastatic Renal Cell Carcinoma

Guangxi Sun et al. Neoplasia. 2019 Sep.

Abstract

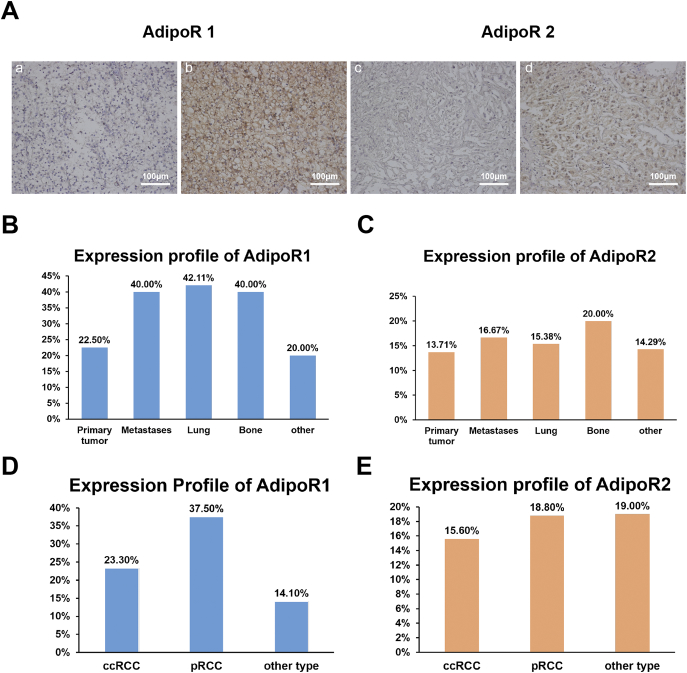
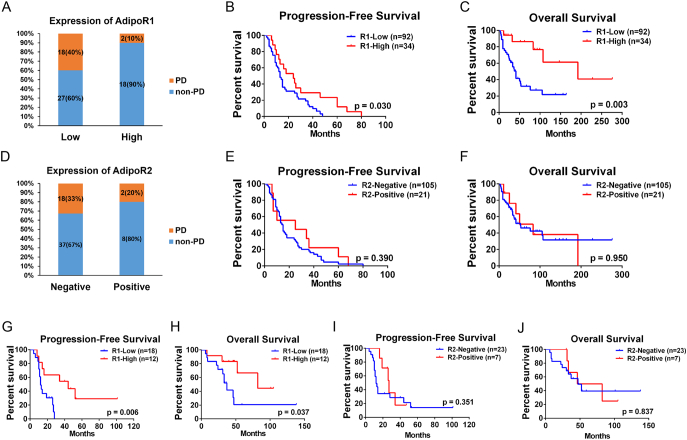
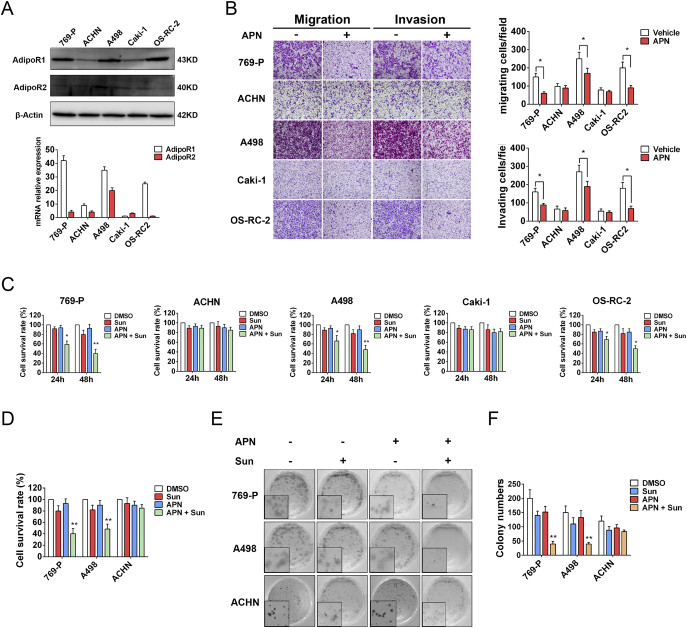
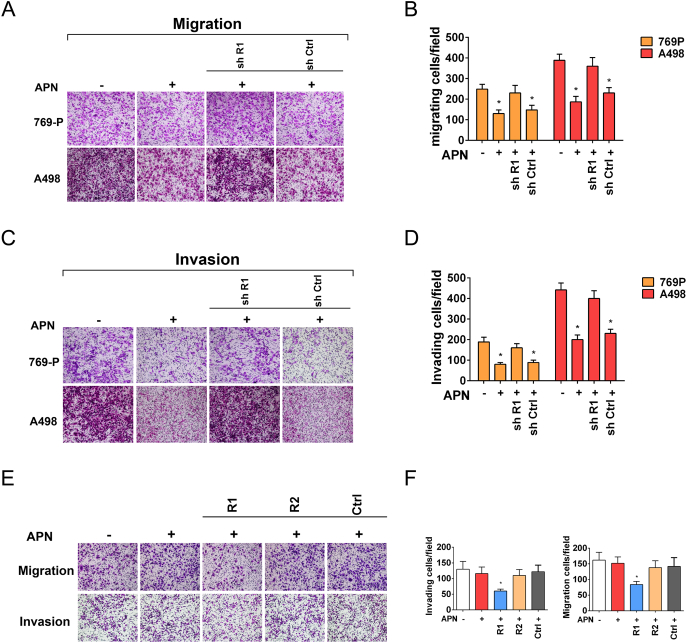
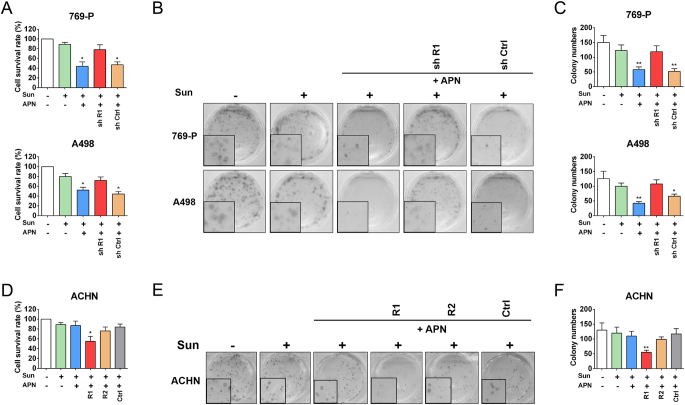
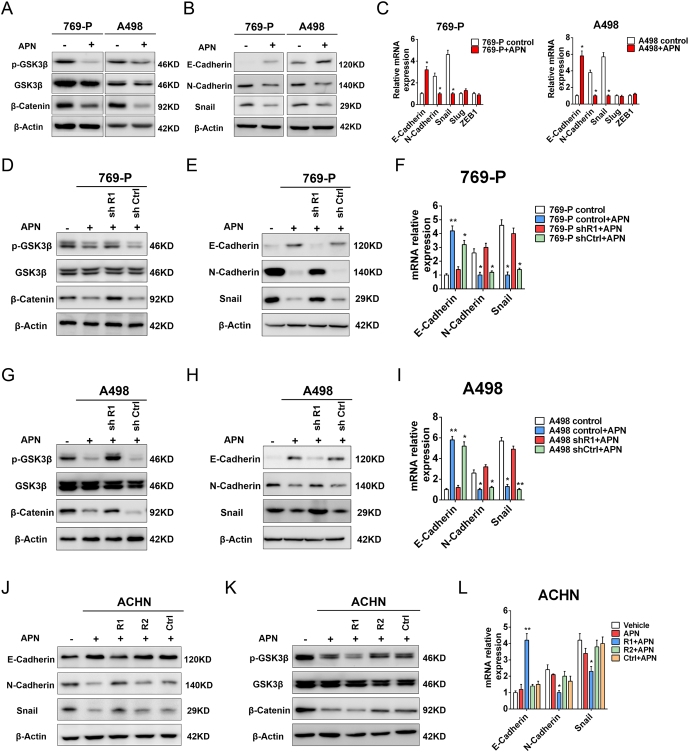
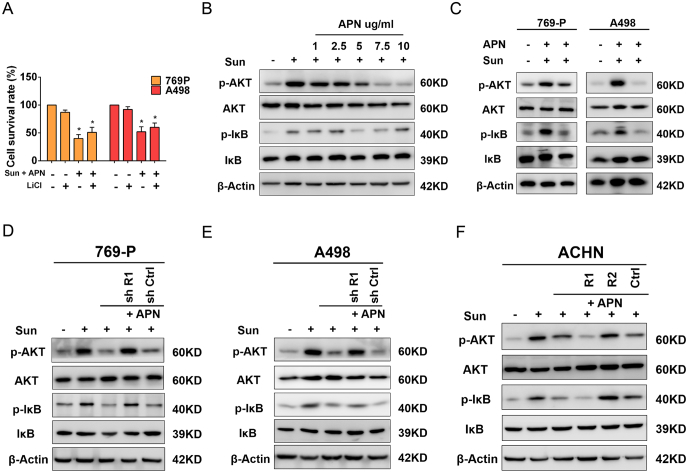
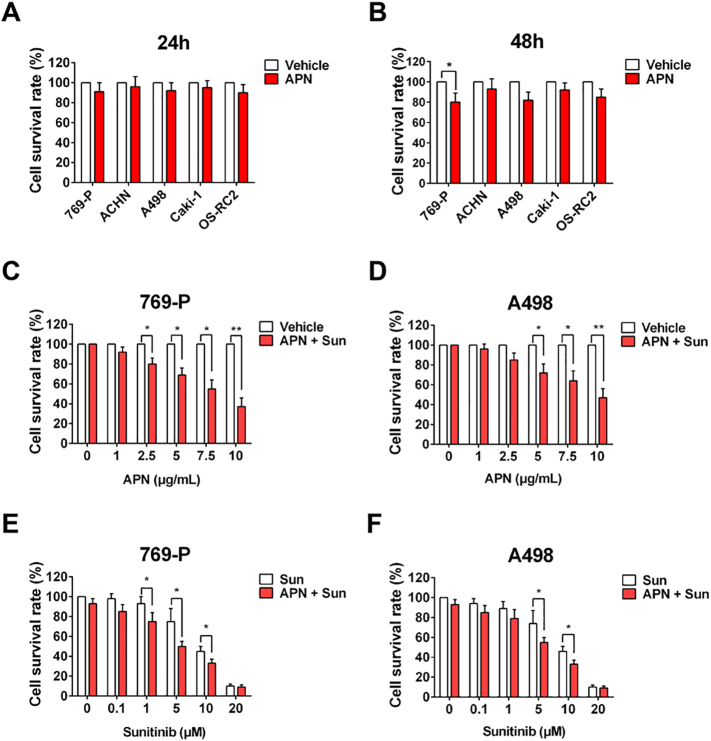
The survival of patients diagnosed with metastatic renal cell carcinoma (RCC) is still limited and the current targeted therapies are only partially effective. Herein, we investigated the clinical value and functions of adiponectin receptors (AdipoR1 and AdipoR2) in metastatic renal cell carcinoma (RCC) patients treated with tyrosine kinase inhibitors (TKIs). A total of 127 mRCC patients treated with first-line TKIs between 2008 and 2017 at a single institution were collected. AdipoR1 and AdipoR2 expression was assessed by immunohistochemistry. AdipoR1 was positively expressed in 87.4% (111/127) of tumors, especially, highly expressed in pulmonary and bone lesions. Patients with low-AdipoR1 expression in primary tumor tissues were more likely to suffer from progressive disease during TKIs treatment (40.0% vs. 11.1%, P = 0 .02), and with decreased progression-free survival (PFS: 19.5 vs. 37.8 mo, P = .001) and overall survival (OS: 62.3 vs 101.1 mo, P = .004) compared to those with high-AdipoR1 expression. Moreover, low-AdipoR1 expression in metastatic tissues was also associated with poor PFS (P = .006) and OS (P = .037). In contrast, AdipoR2 expression was neither associated with sunitinib response nor patient survival. In vitro, we found that adiponectin inhibited migration, invasion and sensitized RCC cells to sunitinib though interacting with AdipoR1, but not AdipoR2. Furthermore, we demonstrated that adiponentin-AdipoR1 axis inhibits tumor cells migration and invasion by blocking the GSK3β/β-Catenin pathway and enhances sunitinib sensitivity via abrogating PI3K/AKT/NF-κB signaling. Our results suggest that adiponentin-AdipoR1 axis may serve as a predictor of TKIs response and could be a potential therapeutic target in the future treatment for metastatic RCC.


Figures

Figure 1
Figure 1
Expression of AdipoR1 and AdipoR2 in mRCC specimens. (A) Representative images of immunohistochemical staining of AdipoR1 and AdipoR2 in mRCC specimens. (a) AdipoR1 with low staining. (b) AdipoR1 with high staining. (c) AdipoR2 with negative staining. (d) AdipoR2 with positive staining. Scale bars, 100 μm. (B) Expression profiles of AdipoR1 in different metastatic sites. (C) Expression profiles of AdipoR2 in different metastatic sites. (D) Expression profiles of AdipoR1 in different pathological subtypes. (E) Expression profiles of AdipoR2 in different pathological subtypes.
Figure 2
Figure 2
The relationship between AdipoR1/R2 expression in tumor tissues and sunitinib response and patient survival in mRCC. (A) The expression levels of AdipoR1 in mRCC patients with PD (n = 20) or non-PD (n = 45) during sunitinib therapy (P = .020). (B) Kaplan–Meier curves of the progression-free survival of mRCC patients (n = 127), with regard to the expression levels of AdipoR1. (C) Kaplan–Meier curves of the overall survival of mRCC patients, with regard to the expression levels of AdipoR1. (D) The expression levels of AdipoR2 (n = 127) in mRCC patients with PD or non-PD during sunitinib therapy (P = .711). (E) Kaplan–Meier curves of the progression-free survival of mRCC patients, with regard to the expression levels of AdipoR2. (F) Kaplan–Meier curves of the overall survival of mRCC patients, with regard to the expression levels of AdipoR2. (G) Kaplan–Meier curves of the progression-free survival of mRCC patients (n = 30), with regard to the expression levels of AdipoR1 in metastatic lesions. (H) Kaplan–Meier curves of the overall survival of mRCC patients, with regard to the expression levels of AdipoR1 in metastatic lesions. (I) Kaplan–Meier curves of the progression-free survival of mRCC patients (n = 30), with regard to the expression levels of AdipoR2 in metastatic lesions. (J) Kaplan–Meier curves of the overall survival of mRCC patients, with regard to the expression levels of AdipoR2 in metastatic lesions.
Figure 3
Figure 3
APN inhibits migration, invasion and sensitizes RCC cells to sunitinib. (A) AdipoR1 and AdipoR2 expression in indicated cell lines was evaluated by western blot (up) and qRT-PCR (down). (B) Invasion and migration of 769-P, ACHN, A498, Caki-1, OS-RC-2 cells were evaluated by Transwell assay after treatment with or without 10 μg/ml recombinant full-length APN for 72 h. Graphs show the relative number of migratory and invasive cells (n = 4). (C) Proliferation of indicated cells was evaluated by MTT assay after treatment with 2 μM Sunitinib and/or 10 μg/ml APN for 24 h or 48 h (n = 3). (D) Proliferation of 769-P, A498 and ACHN cells was evaluated by cell growth assay after treatment with Sunitinib (2 μM) and/or APN (10 μg/ml) for 48 h (n = 3). (E) Clonogenic ability of 769-P, A498 and ACHN cells was evaluated after treatment with Sunitinib (0.5 μM) and/or APN (10 μg/ml). (F) Graphs show relative colony numbers (n = 2).
Figure 4
Figure 4
Interaction of AdipoR1 confers migration and invasion inhibitory effect of APN in RCC cells. (A) Migration of AdipoR1-knockdown and control cells was evaluated by Transwell assay after treatment with APN (10 μg/m) for 72 h. (B) Graphs show the relative number of migratory cells (n = 4). (C) Invasion of AdipoR1-knockdown and control cells were evaluated by Transwell assay after treatment with APN (10 μg/ml) for 72 h. (D) Graphs show the relative number of invasive cells (n = 4). (E) Invasion and migration of AdipoR1-overexpression, AdipoR2-overexpression and control ACHN cells were evaluated by Transwell assay after treatment with or without 10 μg/ml APN for 72 h. (F) Graphs show the relative number of migratory and invasive cells (n = 4). Results are presented as mean ± SD. *P < .05, **P < .001 compared with untreated cells.
Figure 5
Figure 5
Interaction of AdipoR1 confers sunitinib sensitization effect of APN in RCC cells. (A) Proliferation of AdipoR1-knockdown and control cells was evaluated by cell growth assay after treatment with Sunitinib (2 μM) and/or APN (10 μg/ml) for 48 h (n = 3). (B) Clonogenic ability of AdipoR1-knockdown and control cells was evaluated after treatment with Sunitinib (0.5 μM) and/or APN (10 μg/ml). (C) Graphs show relative colony numbers (n = 2). (D) Proliferation of AdipoR1-overexpression, AdipoR2-overexpression and control ACHN cells was evaluated by cell growth assay after treatment with Sunitinib (2 μM) and/or APN (10 μg/ml) for 48 h (n = 3). (E) Clonogenic ability of AdipoR1-overexpression, AdipoR2-overexpression and control ACHN cells was evaluated after treatment with Sunitinib (0.5 μM) and/or APN (10 μg/ml). (F) Graphs show relative colony numbers (n = 2). Results are presented as mean ± SD. *P < .05, **P < .001.
Figure 6
Figure 6
Interaction of AdipoR1 with APN impeded migration and invasion though blockade phosphorylation of GSK-3β (A-B) Western blot analysis of indicated proteins of 769-P and A498 cells treated with or without APN (10 μg/ml) for 48 h. (C) qRT-PCR analysis of indicated genes of 769-P and A498 cells treated with or without APN (10 μg/ml) for 48 h (n = 3). (D-E) Western blot analysis of indicated proteins of AdipoR1-knockdown and control 769-P cells treated with or without APN (10 μg/ml) for 48 h. (F) qRT-PCR analysis of indicated genes of AdipoR1-knockdown and control 769-P cells treated with or without APN (10 μg/ml) for 48 h (n = 3). (G-H) Western blot analysis of indicated proteins of AdipoR1-knockdown and control A498 cells treated with or without APN (10 μg/ml) for 48 h. (I) qRT-PCR analysis of indicated genes of AdipoR1-knockdown and control A498 cells treated with or without APN (10 μg/ml) for 48 h (n = 3). (J-K) Western blot analysis of indicated proteins of AdipoR1-overexpression, AdipoR2-overexpression and control ACHN cells treated with or without APN (10 μg/ml) for 48 h. (L) qRT-PCR analysis of indicated genes of AdipoR1-overexpression, AdipoR2-overexpression and control ACHN cells treated with or without APN (10 μg/ml) for 48 h (n = 3). Results are presented as mean ± SD. *P < .05 compared with untreated cells.
Figure 7
Figure 7
Interaction of AdipoR1 with APN sensitizes RCC cell to sunitinib through inhibition of the PI3K/AKT/NF-κB pathway (A) Proliferation of 769-P and A498 cells was evaluated by MTT assay after treatment with Sunitinib (2 μM) and APN (10 μg/ml) with or without 20 mM LiCl for 48 h (n = 3). (B) Western blot analysis of indicated proteins of 769-P cells treated with Sunitinib (2 μM) and increasing concentrations of APN (0-10 μg/ml) for 48 h. (C) Western blot analysis of indicated proteins of 769-P and A498 cells treated with Sunitinib (2 μM) with or without APN (10 μg/ml) for 48 h. (D) Western blot analysis of indicated proteins of AdipoR1-knockdown and control 769 cells treated with Sunitinib (2 μM) with or without APN (10 μg/ml) for 48 h. (E) Western blot analysis of indicated proteins of AdipoR1-knockdown and control A498 cells treated with Sunitinib (2 μM) with or without APN (10 μg/ml) for 48 h. (F) Western blot analysis of indicated proteins of AdipoR1-overexpression, AdipoR2-overexpression and control ACHN cells treated with Sunitinib (2 μM) with or without APN (10 μg/ml) for 48 h. Results are presented as mean ± SD. *P < .05 compared with untreated cells.
Supplementary Figure S1

References

    1. Siegel RL, Miller KD. Jemal A (2018). Cancer statistics. CA Cancer J Clin. 2018;68:7–30. - PubMed
    1. Sun M, Shariat SF, Cheng C, Ficarra V, Murai M, Oudard S, Pantuck AJ, Zigeuner R, Karakiewicz PI. Prognostic factors and predictive models in renal cell carcinoma: a contemporary review. Eur Urol. 2011;60:644–661. - PubMed
    1. Rini BI, Atkins MB. Resistance to targeted therapy in renal-cell carcinoma. Lancet Oncol. 2009;10:992–1000. - PubMed
    1. Molina A, Lin X, Korytowsky B, Matczak E, Lechuga M, Wiltshire R, Motzer R. Sunitinib objective response in metastatic renal cell carcinoma: analysis of 1059 patients treated on clinical trials. Eur J Cancer. 2014;50:351–358. - PubMed
    1. Hebbard L, Ranscht B. Multifaceted roles of adiponectin in cancer. Best Pract Res Clin Endocrinol Metab. 2014;28:59–69. - PMC - PubMed

Publication types

MeSH terms