Case Reports
. 2019 Oct;130(10):1798-1803.
doi: 10.1016/j.clinph.2019.07.020. Epub 2019 Jul 27.

Stability of a chronic implanted brain-computer interface in late-stage amyotrophic lateral sclerosis

Affiliations
Case Reports

Stability of a chronic implanted brain-computer interface in late-stage amyotrophic lateral sclerosis

Elmar G M Pels et al. Clin Neurophysiol. 2019 Oct.

Abstract

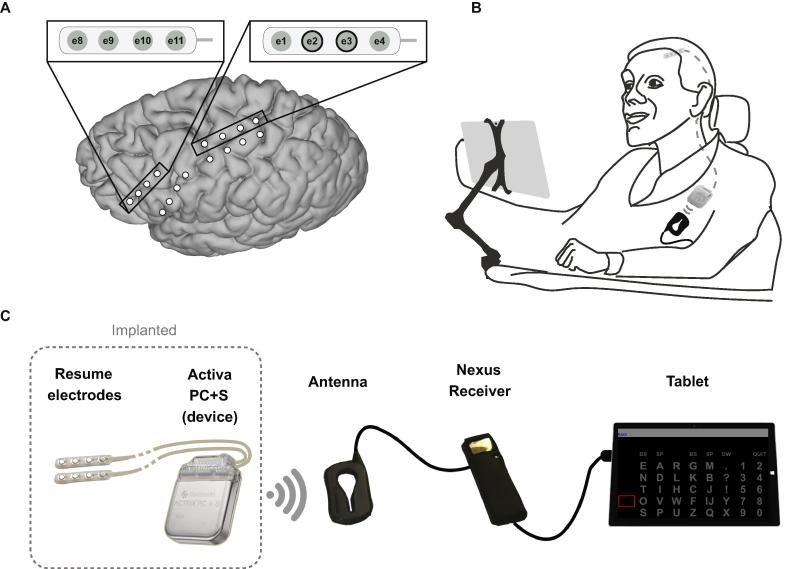
Objective: We investigated the long-term functional stability and home use of a fully implanted electrocorticography (ECoG)-based brain-computer interface (BCI) for communication by an individual with late-stage Amyotrophic Lateral Sclerosis (ALS).

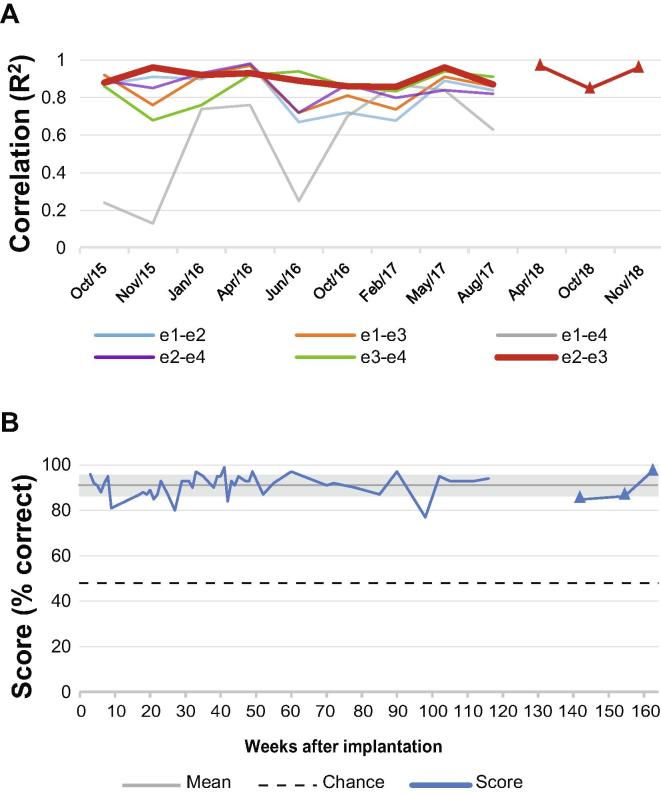
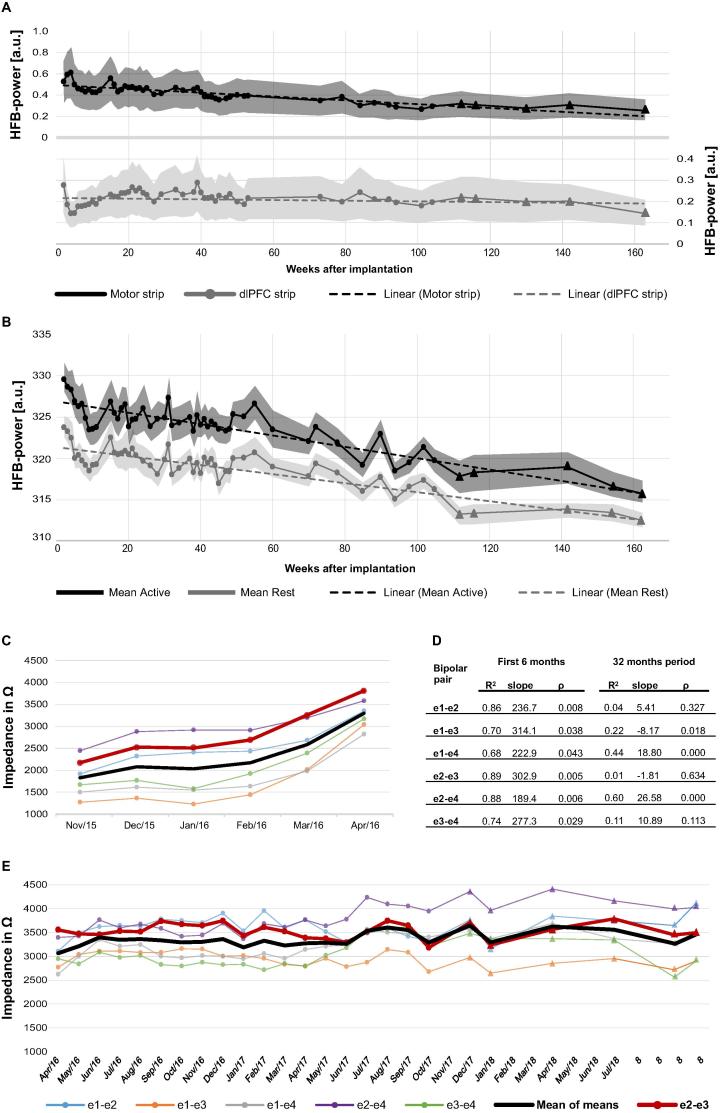
Methods: Data recorded from the cortical surface of the motor and prefrontal cortex with an implanted brain-computer interface device was evaluated for 36 months after implantation of the system in an individual with late-stage ALS. In addition, electrode impedance and BCI control accuracy were assessed. Key measures included frequency of use of the system for communication, user and system performance, and electrical signal characteristics.

Results: User performance was high consistently over the three years. Power in the high frequency band, used for the control signal, declined slowly in the motor cortex, but control over the signal remained unaffected by time. Impedance increased until month 5, and then remained constant. Frequency of home use increased steadily, indicating adoption of the system by the user.

Conclusions: The implanted brain-computer interface proves to be robust in an individual with late-stage ALS, given stable performance and control signal for over 36 months.

Significance: These findings are relevant for the future of implantable brain-computer interfaces along with other brain-sensing technologies, such as responsive neurostimulation.

Keywords: Amyotrophic lateral sclerosis; Brain-computer interface; Communication; Electrocorticography; Implant; Stability.


Figures

Fig. 1
Fig. 1
Overview of the implanted brain-computer interface system. (A) Electrode-strip locations. During a first surgery, two strips were placed on the primary motor cortex and two on the dorsolateral prefrontal cortex. For both regions, one strip was placed over the primary target area, as determined using presurgical fMRI, and one was placed on a secondary target area as a backup. One strip over each area was connected to the device (see inserts) during a second surgery. These strips were selected based on correlation of the signal with the task condition of Localizer tasks performed during two days of testing between the two surgeries (see Vansteensel et al., 2016 for details). The bipolar electrode pair e2-e3 (indicated with black circles in top right insert) is used for BCI-control. (B and C) Overview of the BCI components and the location of the implanted parts. Adapted with permission from Vansteensel et al. (2016).
Fig. 2
Fig. 2
Task-related signal modulation over 36 months. (A) Correlation (R2) of HFB-power (65–95 Hz) with the Localizer task condition (rest vs. attempted hand movement), for all pairs on the motor electrode strip. The correlation was calculated between the mean HFB-power (over time) per trial and the task condition (active vs. rest). In red, the pair used for BCI control and home use. (B) Mean score per week on the Target-task using HFB-power of pair e2-e3 on the motor electrode strip. The Target-task was mainly used to familiarize the user with brain control. Therefore, the number of instances was higher in the first months after implantation than in the last months of this graph. Chance level is 48.4%, overall mean score was 91% (grey line), grey shading indicates the standard deviation of the mean. For both panels, the triangles represent the data collected after the research period (from November 2017).
Fig. 3
Fig. 3
Chronic evaluation of ECoG-electrode parameters and HFB-power. (A) Mean HFB-power per run (65–95 Hz) HFB-power (mean per run) during the Baseline-task in the motor strip (home use pair e2-e3) in black and dlPFC-strip (best performing pair, e9-e11) in grey. The dotted lines are the linear trend lines. Shaded area surrounding the line represents the standard deviation per run. Triangles represent data acquired after the research period. Note: motor and dlPFC-strips have independent analog amplifiers on the device, therefore the absolute HFB-power values of motor and dlPFC cannot be compared. (B) HFB-power (pair e2-e3 of the motor strip) during the active (black) and rest (grey) phase of the Target-task. Note that due to the analogue filtering on board of the device (center frequency 80 Hz, bandwidth 2.5 Hz; effective frequency range at these settings is 80 ± ∼10 Hz) the power values differ from the calculated power values in panel A. The dotted lines are the linear trend lines, the shaded area surrounding the line represents the standard deviation, and the triangles represent data acquired after the research period. Note that HFB power appears to stabilize after week 112. (C and E) Electrode pair impedances over time. Colored lines indicate values per electrode pair, averaged per month. In black the mean over all pairs of the motor strip, in red the pair used for control. Panel A shows the impedance values obtained using stimulation at 0.25 V. Panel C shows the values obtained after stimulation settings were increased to 0.7 V in April 2016 when some recordings using 0.25 V reached the maximum displayable value of 4000 Ω. Triangles represent the data collected after the research period (from November 2017). (D) Linear regression results of the impedances in panels A and C. During the first 5 months, a significant increase in impedance was found in all electrode pairs. From April 2016 onwards the impedances stabilized for all but 4 pairs (e1-e3, e1-e4, e2-e4 and e3-e4).

Similar articles

Cited by

References

    1. Blandin V. ALIS; Association du Locked-In Syndrome. 12 ans d’expérience en France. http://www.uzleuven.be/sites/default/files/revalidatiecentrum/wittebols/... (published 2009).
    1. Bullara L.A., Agnew W.F., Yuen T.G.H., Jacques S., Pudenz R.H. Evaluation of electrode array material for neural prostheses. Neurosurgery. 1979;5(6):681–686. - PubMed
    1. Degenhart A.D., Eles J., Dum R., Mischel J.L., Smalianchuk I., Endler B. Histological evaluation of a chronically-implanted electrocorticographic electrode grid in a non-human primate. J Neural Eng. 2016;13(4):046019. - PMC - PubMed
    1. Herron J.A., Thompson M.C., Brown T., Chizeck H.J., Ojemann J.G., Ko A.L. Chronic electrocorticography for sensing movement intention and closed-loop deep brain stimulation with wearable sensors in an essential tremor patient. J Neurosurg. 2016:1–8. - PubMed
    1. Morrell M.J., Group RNSS in ES Responsive cortical stimulation for the treatment of medically intractable partial epilepsy. Neurology. 2011;77(13):1295–1304. - PubMed

Publication types

MeSH terms