. 2019 Sep 30:291:52-62.
doi: 10.1016/j.pscychresns.2019.08.001. Epub 2019 Aug 2.

Functional connectivity of emotional well-being: Overconnectivity between default and attentional networks is associated with attitudes of anger and aggression

Affiliations

Functional connectivity of emotional well-being: Overconnectivity between default and attentional networks is associated with attitudes of anger and aggression

Fiona L Weathersby et al. Psychiatry Res Neuroimaging. .

Abstract

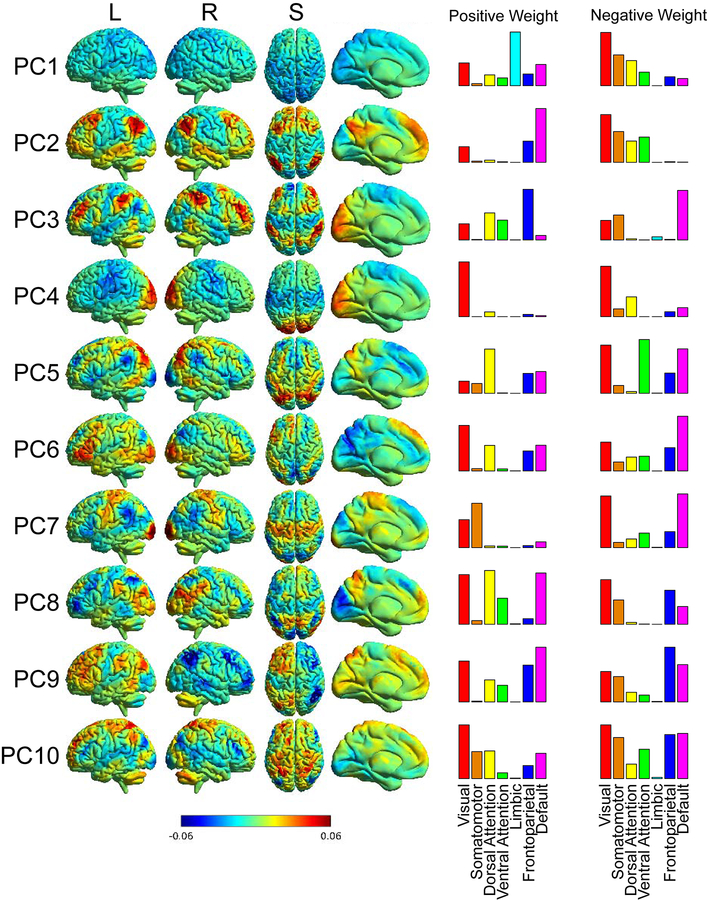
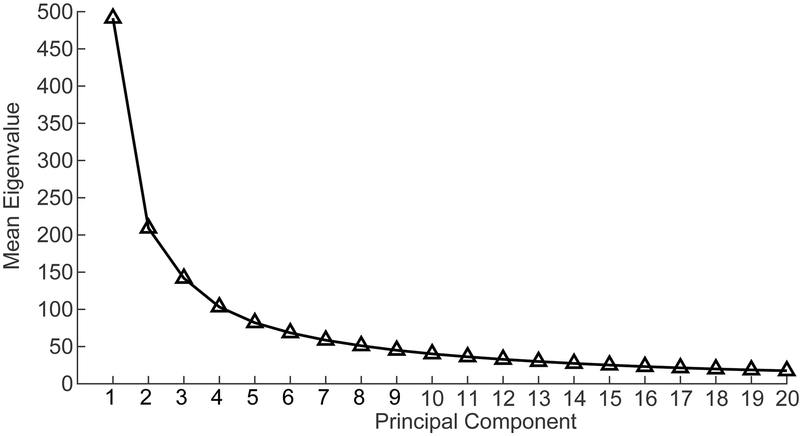
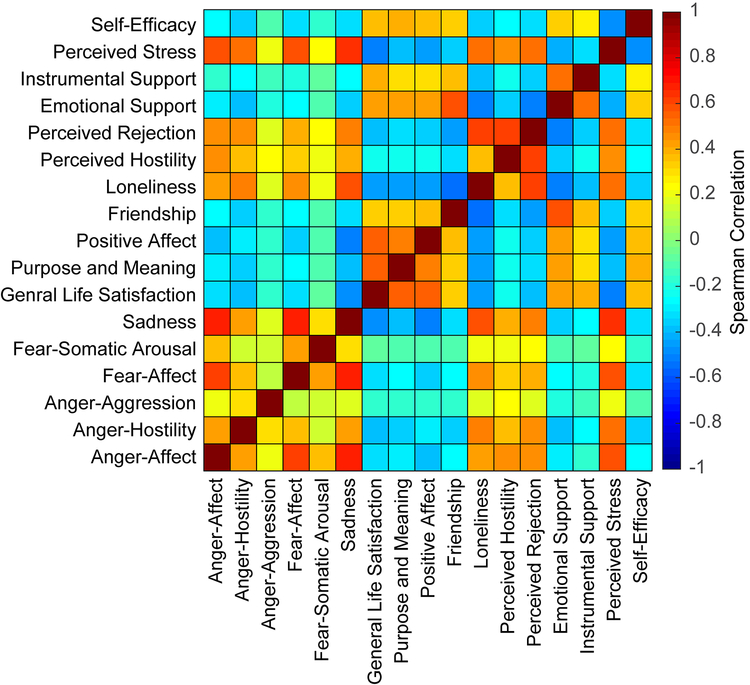
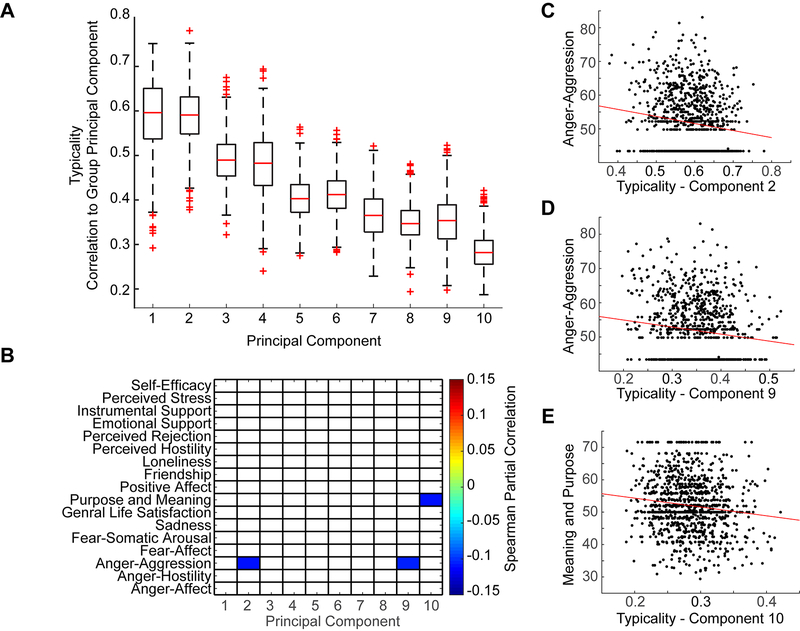
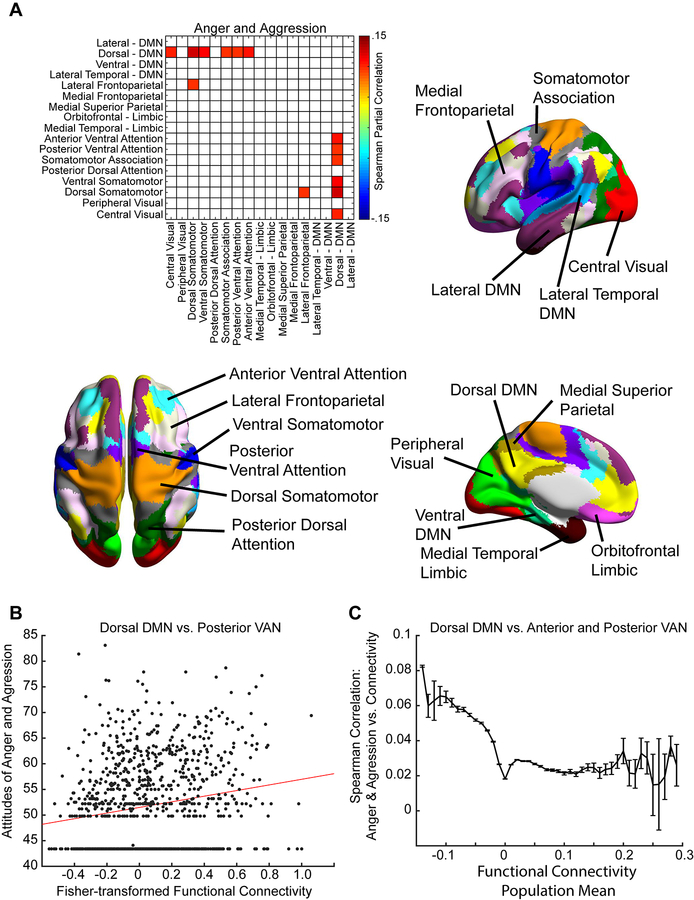
Functional MRI connectivity has identified neurophysiology relevant to cognition and personality, motivating a search for relationships between brain architecture and emotional health and well-being. Two approaches were used to asses functional connectivity correlates of emotional health and well-being. The first approach used principal component analysis to evaluate resting-state functional magnetic resonance imaging data from the Human Connectome Project 1200 Subjects Data Release. Pairwise functional connectivity measurements were obtained from a 5 mm resolution parcellation of brain gray matter. Principal components were calculated for each individual and for group mean connectivity data and compared to obtain an estimate of typicality of functional connectivity for each component in each subject. Typicality scores were compared to reported emotional health metrics using a general linear model. The second approach calculated functional connectivity between each pair of networks from a 17-resting-state network cortical parcellation. Typicality of connectivity showed significant correlation across the population to emotional metrics corresponding to attitudes of anger and aggression in 3 of 10 principal components. Additionally, functional connectivity between the default and attentional networks was positively correlated with scores of attitudes of anger and aggression. These findings are consistent with a mechanism of impaired effortful control and decreased response inhibition of impulsivity.

Keywords: Attentional networks; Default mode network; Effortful control; Emotional well-being; FMRI; Principal component analysis.


Figures

Figure 1:
Figure 1:
Principal components back-projected into anatomical space. The color bar represents a unitless weighting factor where red indicates a positive weighting, and blue indicates a negative weighting. The columns to the right show histograms of ROIs showing positive or negative weight (1 standard deviation above and below the mean for each component) that are represented by 7 canonical ICA-derived functional networks.
Figure 2:
Figure 2:
First 20 principal components as a function of their respective eigenvalues. Note the decrease in eigenvalue and, by extension, the decrease in variance accounted for as the principal components progress from 1 to 20.
Figure 3:
Figure 3:
Emotional well-being metric correlation across subjects. Negative affect metrics, such as attitudes associated with anger and fear are associated with one another, as well as with negative aspects of social relationships and stress. Positive affect metrics, such as life satisfaction and psychological well-being are associated with one another and positive aspects of social relationships and perceived self-efficacy.
Figure 4:
Figure 4:
A. Range of typicality across subjects for each of the 10 principal components derived from group averaged data. Range is shown as a boxplot where the box represents 25 to 75 percentile of the data. Extreme values are shown as “+”. B. Typicality in principal components 1 through 10 correlated with emotional well-being metrics, thresholded q(FDR < .05). Note that there is a negative association between anger-aggression and typicality in principal components 2 and 9. There is also a negative association between attitudes of life purpose and meaning and principal component 10. C. Scatter plot shows scores of typicality for principal component 2 compared to Anger-aggression metric scores. Red line shows best linear fit. D. Scatter plot shows scores of typicality for principal component 9 compared to Anger-aggression metric scores. Red line shows best linear fit. E. Scatter plot shows scores of typicality for principal component 10 compared to Purpose and Meaning metric scores. Red line shows best linear fit.
Figure 5:
Figure 5:
A. Spearman correlation between functional connectivity across 17 functional networks and anger-aggression scores, thresholded for q(FDR<.05). There is overconnectivity observed between default network and sensory networks, as well as between default network and attentional networks. Each of the 17 networks is illustrated on a labeled, color-coded parcellation of the brain shown to the right and below. B. Scatter plot shows functional connectivity for each subject between the dorsal DMN and posterior ventral attention network compared to anger-aggression metric scores. Red line shows best linear fit. C. Individual connections from each ROI within the dorsal DMN to each ROI within the anterior and posterior ventral attention network were grouped into bins based on population mean functional connectivity for each ROI to ROI connection. The error bars show standard error of the mean for correlation between anger-aggression scores and functional connectivity for the connections within each bin.

References

    1. Adolphs R, Tranel D, Damasio H, Damasio AR, 1995. Fear and the human amygdala. J. Neurosci 15, 5879–5891. - PMC - PubMed
    1. Allman JM, Hakeem A, Erwin JM, Nimchinsky E, Hof P, 2001. The anterior cingulate cortex. The evolution of an interface between emotion and cognition. Ann. N. Y. Acad. Sci 935, 107–117. - PubMed
    1. Anders S, Lotze M, Erb M, Grodd W, Birbaumer N, 2004. Brain activity underlying emotional valence and arousal: a response-related fMRI study. Hum Brain Mapp 23, 200–209. - PMC - PubMed
    1. Anderson JS, Ferguson MA, Lopez-Larson M, Yurgelun-Todd D, 2011. Connectivity Gradients Between the Default Mode and Attention Control Networks. Brain Connectivity 1, 147–157. - PMC - PubMed
    1. Anderson KL, Anderson JS, Palande S, Wang B, 2018. Topological data analysis of functional MRI connectivity in time and space domains. Lecture Notes in Computer Science 11083, 67–77. - PMC - PubMed