. 2019 Sep 17;140(12):979-991.
doi: 10.1161/CIRCULATIONAHA.119.041014. Epub 2019 Aug 12.

Changes in Plant-Based Diet Quality and Total and Cause-Specific Mortality

Affiliations

Changes in Plant-Based Diet Quality and Total and Cause-Specific Mortality

Megu Y Baden et al. Circulation. .

Abstract

Background: Plant-based diets have been associated with lower risk of type 2 diabetes mellitus and cardiovascular disease (CVD) and are recommended for both health and environmental benefits. However, the association between changes in plant-based diet quality and mortality remains unclear.

Methods: We investigated the associations between 12-year changes (from 1986 to 1998) in plant-based diet quality assessed by 3 plant-based diet indices (score range, 18-90)-an overall plant-based diet index (PDI), a healthful PDI, and an unhealthful PDI-and subsequent total and cause-specific mortality (1998-2014). Participants were 49 407 women in the Nurses' Health Study (NHS) and 25 907 men in the Health Professionals Follow-Up Study (HPFS) who were free from CVD and cancer in 1998. Multivariable-adjusted Cox proportional-hazards models were used to estimate hazard ratios (HRs) and 95% CIs.

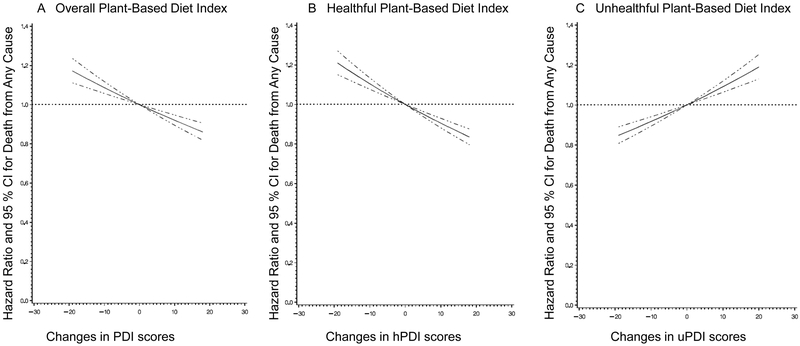
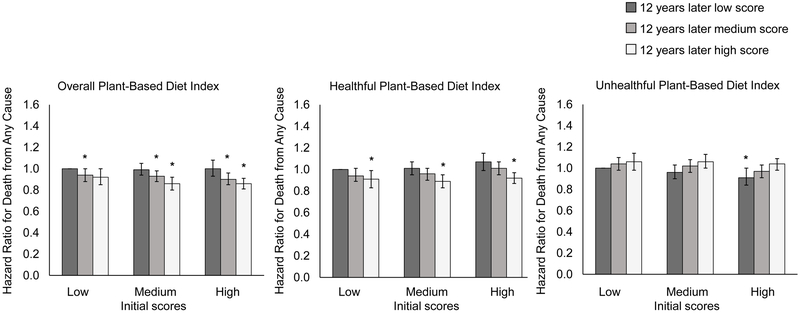
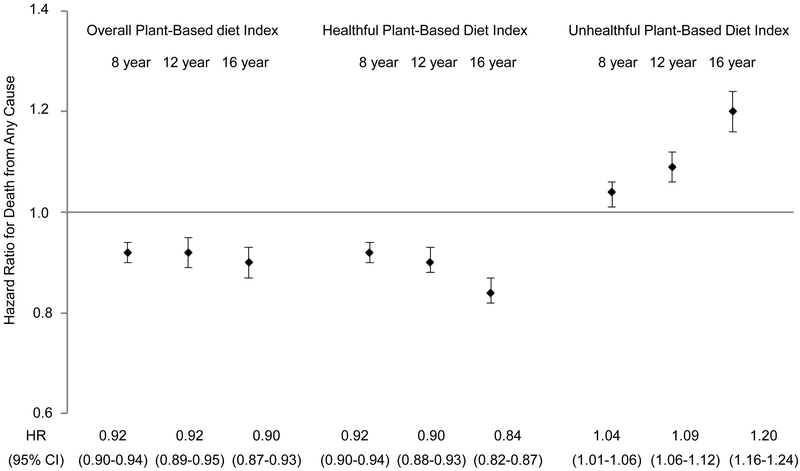
Results: We documented 10 686 deaths including 2046 CVD deaths and 3091 cancer deaths in the NHS over 725 316 person-years of follow-up and 6490 deaths including 1872 CVD deaths and 1772 cancer deaths in the HPFS over 371 322 person-years of follow-up. Compared with participants whose indices remained stable, among those with the greatest increases in diet scores (highest quintile), the pooled multivariable-adjusted HRs for total mortality were 0.95 (95% CI, 0.90-1.00) for PDI, 0.90 (95% CI, 0.85-0.95) for healthful PDI, and 1.12 (95% CI, 1.07-1.18) for unhealthful PDI. Among participants with the greatest decrease (lowest quintile), the multivariable-adjusted HRs were 1.09 (95% CI, 1.04-1.15) for PDI, 1.10 (95% CI, 1.05-1.15) for healthful PDI, and 0.93 (95% CI, 0.88-0.98) for unhealthful PDI. For CVD mortality, the risk associated with a 10-point increase in each PDI was 7% lower (95% CI, 1-12%) for PDI, 9% lower (95% CI, 4-14%) for healthful PDI, and 8% higher (95% CI, 2-14%) for unhealthful PDI. There were no consistent associations between changes in plant-based diet indices and cancer mortality.

Conclusions: Improving plant-based diet quality over a 12-year period was associated with a lower risk of total and CVD mortality, whereas increased consumption of an unhealthful plant-based diet was associated with a higher risk of total and CVD mortality.

Keywords: death; diet; epidemiology; food quality; vegetarian diet.


Conflict of interest statement

Disclosures

Dr. Li and Dr. Hu reported receiving research support from California Walnut Commission. Dr. Satija is currently employed at Analysis Group, Inc. All other authors have no conflict of interest to disclose.

Figures

Figure 1.
Figure 1.. Restricted cubic spline curves for associations between 12-year changes in plant-based diet indices and total mortality.
A. Overall plant-based diet index (PDI). B. Healthful plant-based diet index (hPDI). C. Unhealthful plant-based diet index (uPDI). Multivariable-adjusted hazard ratios are calculated by restricted cubic spline regression adjusted for age, sex, race, initial plant-based diet index score, family history of myocardial infarction, diabetes, or cancer, aspirin use, multivitamin use, initial body mass index, weight change, menopausal status and hormone use in women, smoking status, history of hypertension, hypercholesterolemia, or type 2 diabetes, antihypertensive medication use, cholesterol-lowering medication use, and initial and changes in each of smoking pack-years, physical activity, total energy intake, alcohol consumption, and margarine intake. Solid curves represent point estimates and dashed curves represent 95% confidence intervals (CIs).
Figure 2.
Figure 2.. Risk of death from any cause according to initial (1986) and 12 years later plant-based diet index scores.
Initial plant-based diet index scores are shown as low, mediun, and high. At 12 years later, participants may have had a consistenty low plant-based diet index scores over time, a change from a low score to a medium or high score, a consistently medium score over time, a change from a medium score to a low or high score, a consistetly high score over time, or a change from a high score to a low or medium score. The multivariable-adjusted hazard ratios were calculated with adjustments for age, race, family history of myocardial infarction, diabetes, or cancer, aspirin use, multivitamin use, initial body mass index, weight change, menopausal status and hormone use in women, smoking status, history of hypertension, hypercholesterolemia, or type 2 diabetes, antihypertensive medication use, cholesterol-lowering medication use, and initial and changes in each of smoking pack-years, physical activity, total energy intake, alcohol consumption, and margarine intake. Results from the Nurses’ Health Study and the Health Professionals Follow-Up Study were combined with the use of the fixed effects model. Error bars represent 95% confidence intervals; asterisks represent P <0.05 for the associations of hazard ratios compared with participants who had consistently low plant-based diet index scores over time.
Figure 3.
Figure 3.. Risk of death from any cause per 10-point increase in plant-based diet indices for preceding 8-, 12-, 16-year changes.
The multivariable-adjusted hazard ratios of death from any cause per 10-point increase in three plant-based diet indices for preceding 8-, 12-, and 16-year are shown. Error bars represent 95% confidence intervals (CIs).

References

    1. Huang T, Yang B, Zheng J, Li G, Wahlqvist ML and Li D. Cardiovascular disease mortality and cancer incidence in vegetarians: a meta-analysis and systematic review. Ann Nutr Metab. 2012;60:233–240. doi: 10.1159/000337301 - DOI - PubMed
    1. Kwok CS, Umar S, Myint PK, Mamas MA and Loke YK. Vegetarian diet, Seventh Day Adventists and risk of cardiovascular mortality: a systematic review and meta-analysis. Int J Cardiol. 2014;176:680–686. doi: 10.1016/j.ijcard.2014.07.080 - DOI - PubMed
    1. Tonstad S, Stewart K, Oda K, Batech M, Herring RP and Fraser GE. Vegetarian diets and incidence of diabetes in the Adventist Health Study-2. Nutr Metab Cardiovasc Dis. 2013;23:292–299. doi: 10.1016/j.numecd.2011.07.004 - DOI - PMC - PubMed
    1. Yokoyama Y, Nishimura K, Barnard ND, Takegami M, Watanabe M, Sekikawa A, Okamura T and Miyamoto Y. Vegetarian diets and blood pressure: a meta-analysis. JAMA Intern Med. 2014;174:577–587. doi: 10.1001/jamainternmed.2013.14547 - DOI - PubMed
    1. Millen BE, Abrams S, Adams-Campbell L, Anderson CA, Brenna JT, Campbell WW, Clinton S, Hu F, Nelson M, Neuhouser ML, Perez-Escamilla R, Siega-Riz AM, Story M and Lichtenstein AH. The 2015 Dietary Guidelines Advisory Committee Scientific Report: Development and Major Conclusions. Adv Nutr. 2016;7:438–444. doi: 10.3945/an.116.012120 - DOI - PMC - PubMed

Publication types