. 2019 Sep 24;140(13):1100-1114.
doi: 10.1161/CIRCULATIONAHA.119.040232. Epub 2019 Aug 12.

Artery-Associated Sympathetic Innervation Drives Rhythmic Vascular Inflammation of Arteries and Veins

Affiliations

Artery-Associated Sympathetic Innervation Drives Rhythmic Vascular Inflammation of Arteries and Veins

Alba de Juan et al. Circulation. .

Abstract

Background: The incidence of acute cardiovascular complications is highly time-of-day dependent. However, the mechanisms driving rhythmicity of ischemic vascular events are unknown. Although enhanced numbers of leukocytes have been linked to an increased risk of cardiovascular complications, the role that rhythmic leukocyte adhesion plays in different vascular beds has not been studied.

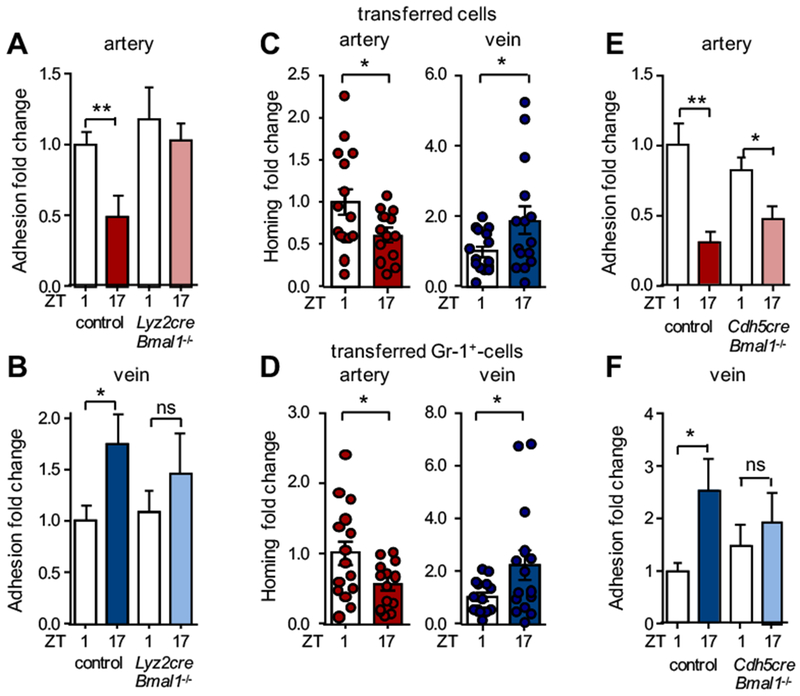
Methods: We evaluated leukocyte recruitment in vivo by using real-time multichannel fluorescence intravital microscopy of a tumor necrosis factor-α-induced acute inflammation model in both murine arterial and venous macrovasculature and microvasculature. These approaches were complemented with genetic, surgical, and pharmacological ablation of sympathetic nerves or adrenergic receptors to assess their relevance for rhythmic leukocyte adhesion. In addition, we genetically targeted the key circadian clock gene Bmal1 (also known as Arntl) in a lineage-specific manner to dissect the importance of oscillations in leukocytes and components of the vessel wall in this process.

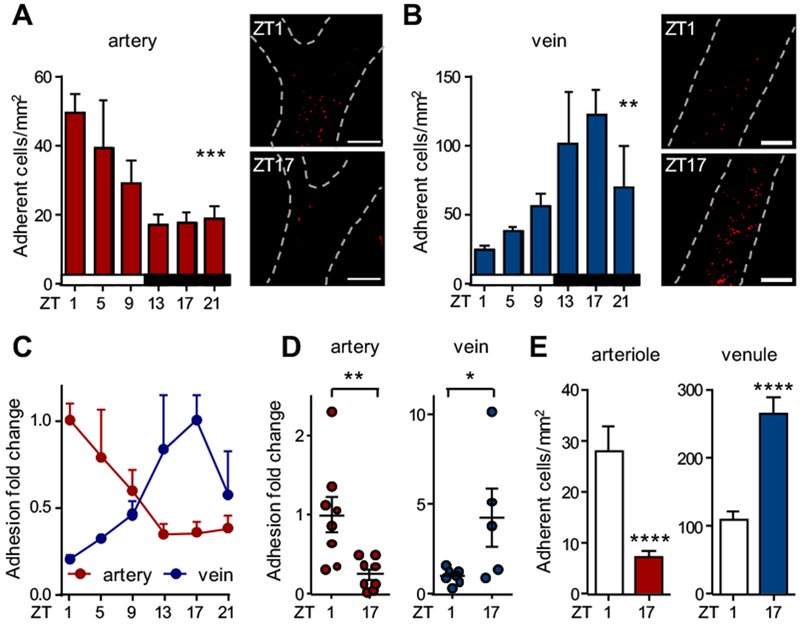
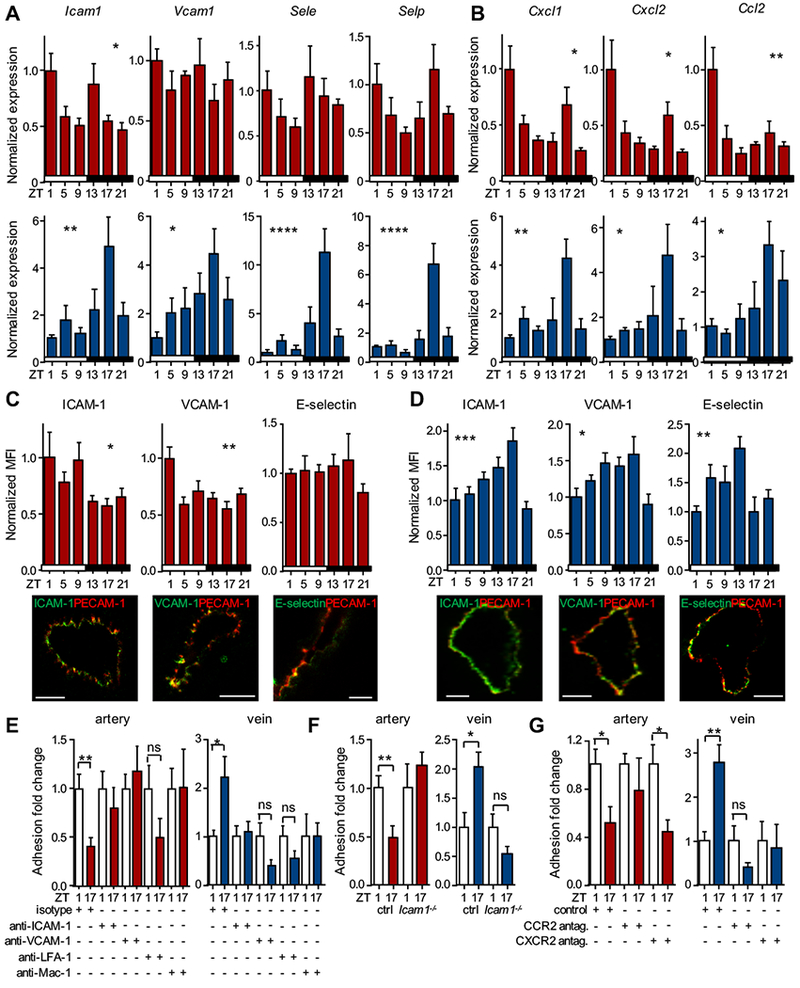
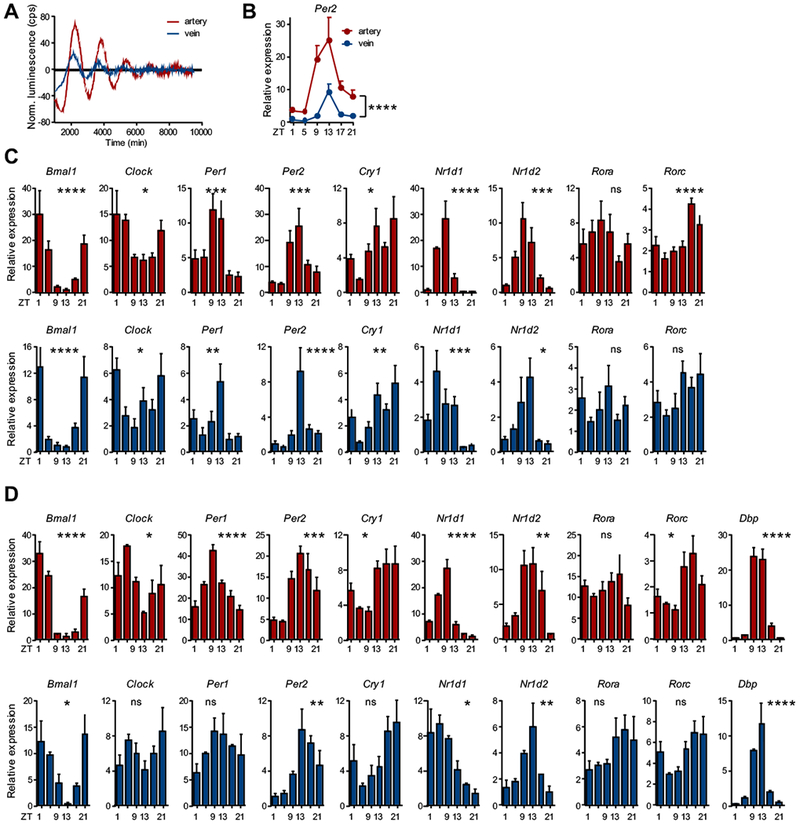
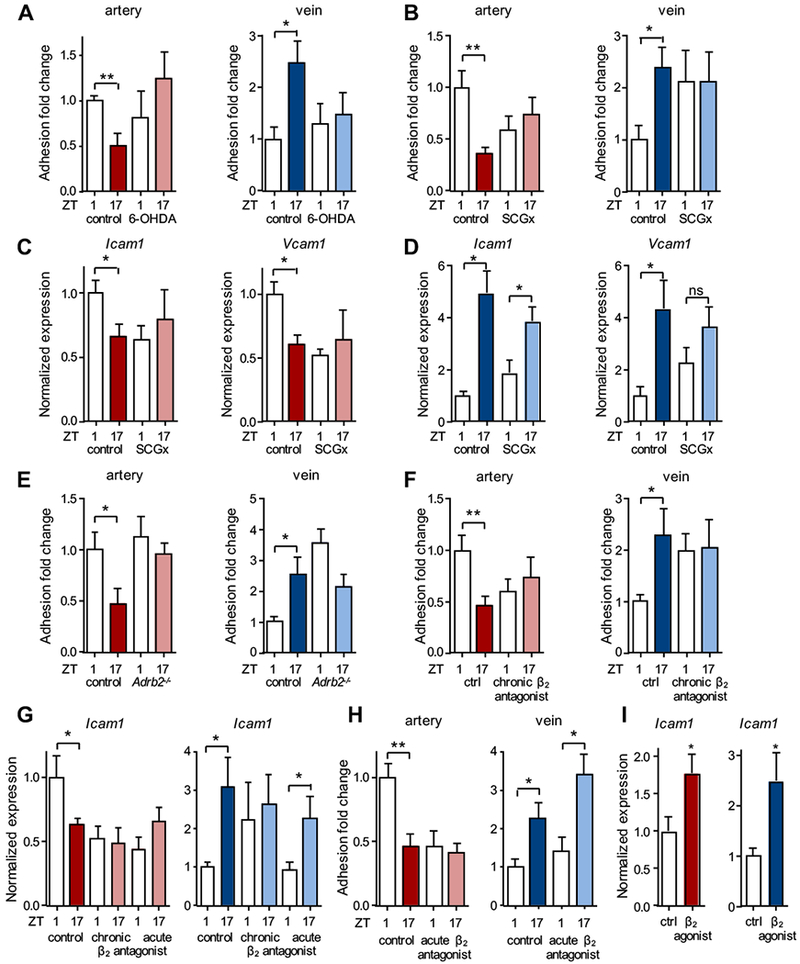
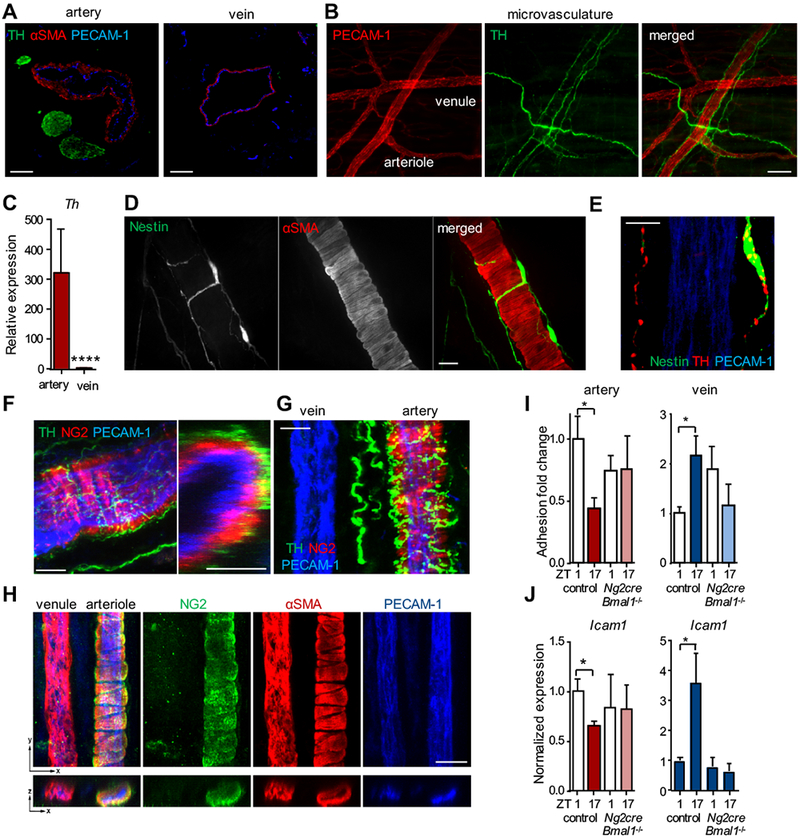
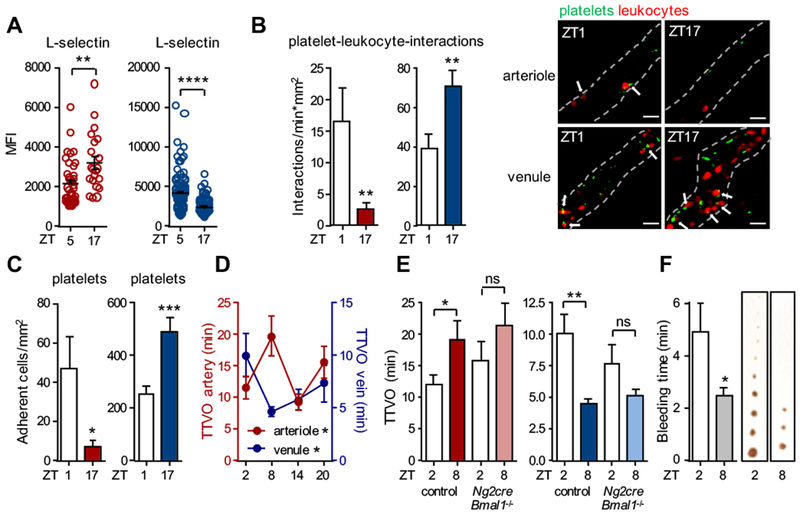
Results: In vivo quantitative imaging analyses of acute inflammation revealed a 24-hour rhythm in leukocyte recruitment to arteries and veins of the mouse macrovasculature and microvasculature. Unexpectedly, although in arteries leukocyte adhesion was highest in the morning, it peaked at night in veins. This phase shift was governed by a rhythmic microenvironment and a vessel type-specific oscillatory pattern in the expression of promigratory molecules. Differences in cell adhesion molecules and leukocyte adhesion were ablated when disrupting sympathetic nerves, demonstrating their critical role in this process and the importance of β2-adrenergic receptor signaling. Loss of the core clock gene Bmal1 in leukocytes, endothelial cells, or arterial mural cells affected the oscillations in a vessel type-specific manner. Rhythmicity in the intravascular reactivity of adherent leukocytes resulted in increased interactions with platelets in the morning in arteries and in veins at night with a higher predisposition to acute thrombosis at different times as a consequence.

Conclusions: Together, our findings point to an important and previously unrecognized role of artery-associated sympathetic innervation in governing rhythmicity in vascular inflammation in both arteries and veins and its potential implications in the occurrence of time-of-day-dependent vessel type-specific thrombotic events.

Keywords: cell adhesion molecules; circadian rhythm; sympathetic nervous system; thrombosis.


Figures

Figure 1
Figure 1. Inflammatory leukocyte adhesion to arteries and veins occurs at different times of the day
(A-B) In vivo quantification of adherent leukocytes after TNF-α stimulation over 24 h in carotid artery (A) and jugular vein (B); n = 4-13 mice, one-way ANOVA. (C) Normalization of the leukocyte adhesion data from (A-B). Data are normalized to peak levels; n = 4-13 mice. (D) In vivo quantification of adherent cells in Lyz2-gfp mice after TNF-α stimulation in carotid artery and jugular vein. Data are normalized to ZT1 levels; n = 5-8 mice, Student’s t-test (artery) and Mann-Whitney test (vein). (E) In vivo quantification of adherent cells in arterioles and venules of the cremasteric microvasculature after TNF-α stimulation; n = 5 mice, Student’s t-test. *p < 0.05, **p < 0.01, ***p < 0.001, ****p < 0.0001. Scale bars: 200 μm.
Figure 2
Figure 2. Role of rhythmicity in myeloid cells and the microenvironment
(A-B) In vivo quantification of adherent leukocytes after TNF-α stimulation in carotid artery (A) and jugular vein (B) in control and Lyz2cre:Bmal1−/− mice. Data are normalized to control ZT1 levels; n = 7-10 mice, Student’s t-test. (C) Homing experiments of adoptively transferred leukocytes (C) and Gr1+ cells (D) to carotid artery and jugular vein after TNF-α stimulation. Data are normalized to ZT1 levels; n = 13-15 mice, Student’s t-test with Welch’s correction. (E-F) In vivo quantification of adherent leukocytes after TNF-α stimulation in carotid artery (E) and jugular vein (F) in control and Cdh5creERT2:Bmal1−/− mice. Data are normalized to control ZT1 levels; n = 8-11 mice, Student’s t-test with Welch’s correction. *p < 0.05, **p < 0.01.
Figure 3
Figure 3. Distinct rhythmicity of pro-migratory molecules in arteries and veins
(A-B) Q-PCR analyses of cell adhesion molecules (A) and chemokines (B) in carotid artery (red) and jugular vein (blue) after TNF-α stimulation over the course of the day; n = 3-6 mice, one-way ANOVA. (C-D) Mean fluorescence intensity (MFI) quantifications and representative images of adhesion molecule expression in endothelial cells after TNF-α stimulation in carotid artery (C) and jugular vein (D). Data are normalized to ZT1 levels; n = 3-6 mice, one-way ANOVA. (E) In vivo quantification of adherent leukocytes after TNF-α stimulation in carotid artery and jugular vein after antibody blockade. Data are normalized to ZT1 levels; n = 4-6 mice, Student’s t-test. (F) In vivo quantification of adherent leukocytes after TNF-α stimulation in carotid artery and jugular vein in Icam1−/− mice; n = 8-9 mice Student’s t-test. (G) In vivo quantification of adherent leukocytes after TNF-α stimulation in carotid artery and jugular vein after antagonist treatment. Data are normalized to ZT1 levels; n = 4-6 mice, Student’s t-test. *p < 0.05, **p < 0.01, ***p < 0.001, ****p < 0.0001. Scale bars: 50 μm.
Figure 4
Figure 4. Clock gene expression patterns in arteries and veins
(A) Ex vivo circadian oscillations of Per2 expression levels as quantified in aorta and vena cava harvested from the bioluminescence mPer2:Luc reporter mouse over 6 days under non-inflammatory conditions; n = 3 mice. (B) Comparison of Per2 expression levels between carotid artery (red) and jugular vein (blue) over the course of the day in steady state; n = 6 mice, two-way ANOVA. (C-D) Q-PCR analyses of circadian clock gene expression levels over 24 h in carotid artery (red) and jugular vein (blue) under (C) steady-state and (D) TNF-α-induced inflammatory conditions; n = 6 mice, one-way ANOVA. *p < 0.05, **p < 0.01, ***p < 0.001, ****p < 0.0001.
Figure 5
Figure 5. Local sympathetic nerves drive rhythmic inflammatory responses
(A) In vivo quantification of adherent leukocytes after TNF-α stimulation in carotid artery and jugular vein after 6-OHDA treatment. Data are normalized to ZT1 control levels; n = 5-8 mice, Student’s t-test. (B) In vivo quantification of adherent leukocytes after TNF-α stimulation in carotid artery and jugular vein after unilateral surgical denervation of the superior cervical ganglion (SCGx). Data are normalized to ZT1 control levels; n = 5-12 mice, Student’s t-test. (C-D) Q-PCR analyses of cell adhesion molecules after TNF-α stimulation in carotid artery (C) and jugular vein (D) of SCGx mice. Data are normalized to ZT1 control levels; n = 4-7 mice, Student’s t-test with Welch’s correction. (E) In vivo quantification of adherent leukocytes after TNF-α stimulation in carotid artery and jugular vein of Adrb2−/− mice. Data are normalized to ZT1 control levels; n = 6-9 mice, Student’s t-test. (F) In vivo quantification of adherent leukocytes after TNF-α stimulation in carotid artery and jugular vein after 5 d (chronic) treatment with a β2 adrenergic receptor antagonist. Data are normalized to ZT1 control levels; n = 4-7 mice, Student’s t-test with Welch’s correction. (G) Q-PCR analyses of cell adhesion molecules after TNF-α stimulation in carotid artery and jugular vein after chronic (5 d) or acute (2 h) treatment with a β2-adrenergic receptor antagonist. Data are normalized to ZT1 control levels; n = 5-6 mice, Student’s t-test with Welch’s correction. (H) In vivo quantification of adherent leukocytes after TNF-α stimulation in carotid artery and jugular vein after 2 h (acute) treatment with a β2-adrenergic receptor antagonist. Data are normalized to ZT1 control levels; n = 6-11 mice, Student’s t-test. (I) Q-PCR analyses of cell adhesion molecules after TNF-α stimulation in carotid artery and jugular vein after acute (2 h) treatment with a β2-adrenergic receptor agonist; n = 5-6 mice, Student’s t-test with Welch’s correction. *p < 0.05, **p < 0.01.
Figure 6
Figure 6. Different sympathetic innervation status of arteries and veins
(A) Immunofluorescence images of carotid artery and jugular vein sections stained with antibodies directed against PECAM-1 (endothelial cells), αSMA (smooth muscle cells) and tyrosine hydroxylase (TH, sympathetic nerves) in steady state. (B) Whole-mount immunofluorescence images of sympathetic innervation in the cremaster muscle microcirculation in steady state. (C) Q-PCR analyses of Th expression levels in steady state; n = 11-12 mice, Mann-Whitney test. (D) Whole-mount immunofluorescence images of sympathetic innervation (Nestin) of αSMA+-smooth muscle cells of an arteriole in the cremaster muscle microcirculation in steady state. (E) TH+ sympathetic varicosities within Nestin+ nerve fibers in close proximity to the arterial vessel wall. (F-G) Whole-mount immunofluorescence images of sympathetic innervation (TH) of mural cells (NG2) within the carotid artery and an associated vein (G) in steady state harvested from Ng2-DsRed mice. The right picture in (F) represents an orthogonal view. (H) Whole-mount immunofluorescence images of a cremasteric arteriole and venule stained with antibodies directed against PECAM-1, NG2 and αSMA in steady state. (I) In vivo quantification of adherent leukocytes after TNF-α stimulation in carotid artery (red, left) and jugular vein (blue, right) of Ng2cre:Bmal1−/− mice. Data are normalized to ZT1 control levels; n = 4-10 mice, Student’s t-test with Welch’s correction. (J) Q-PCR analyses of Icam1 expression levels after TNF-α stimulation in carotid artery (red, left) and jugular vein (blue, right) of Ng2cre:Bmal1−/− mice. Data are normalized to ZT1 control levels; n = 3-9 mice, Student’s t-test with Welch’s correction. *p < 0.05, ****p < 0.0001. Scale bars: (A-B) 100 μm, (D) 10 μm, (E) 5 μm, (F) 30 μm, (G) 15 μm, (H) 20 μm.
Figure 7
Figure 7. Acute thrombosis in arteries and veins peaks at different times of the day
(A) In vivo quantification of L-selectin mean fluorescence intensity (MFI) levels on the surface of adherent leukocytes after TNF-α stimulation in cremasteric arterioles (red) and venules (blue); n = 24 cells, Student’s t-test. (B) In vivo quantifications of heterocellular interactions between platelets (CD41+) and adherent neutrophils (Ly6G+) after TNF-α stimulation in cremasteric arterioles (red) and venules (blue); n = 28-38 vessels, Student’s t-test. (C) In vivo quantification of adherent platelets after TNF-α stimulation in cremasteric arterioles (red) and venules (blue); n = 28-38 vessels, Student’s t-test with Welch’s correction. (D) In vivo quantification of time to vaso-occlusion (TTVO) after light-induced thrombus formation in cremasteric arterioles (red) and venules (blue); n = 6-22 vessels, one-way ANOVA. (E) In vivo quantification of time to vaso-occlusion (TTVO) after light-induced thrombus formation in cremasteric arterioles (red) and venules (blue) of control and Ng2cre:Bmal1−/− mice; n = 12-15 vessels, Student’s t-test. (F) Tail bleeding time after 2mm tail transection, assessed at two different time points with representative images of blood drops on paper every 30s until complete stop of bleeding; n = 18-20 mice, Student’s t-test. *p < 0.05, **p < 0.01, ***p < 0.001, ****p < 0.0001. Scale bars: 10 μm.

References

    1. Muller JE, Stone PH, Turi ZG, Rutherford JD, Czeisler CA, Parker C, Poole WK, Passamani E, Roberts R, Robertson T, Sobel BE, Willerson JT, and Braunwald E and the MILIS Study Group. Circadian variation in the frequency of onset of acute myocardial infarction. New Eng J MEd. 1985;313:1315–1322. - PubMed
    1. Coller BS. Leukocytosis and ischemic vascular disease morbidity and mortality: is it time to intervene? Arterioscler thromb Vasc Biol. 2005;25:658–670. - PubMed
    1. Hidalgo A, Chang J, Jang JE, Peired AJ, Chiang EY and Frenette PS. Heterotypic interactions enabled by polarized neutrophil microdomains mediate thromboinflammatory injury. Nat Med. 2009;15:384–391. - PMC - PubMed
    1. Turhan A, Weiss LA, Mohandas N, Coller BS and Frenette PS. Primary role for adherent leukocytes in sickle cell vascular occlusion: a new paradigm. Proc Nat Acad Sci USA. 2002;99:3047–3051. - PMC - PubMed
    1. Xu H, Gonzalo JA, St Pierre Y, Williams IR, Kupper TS, Cotran RS, Springer TA and Gutierrez-Ramos JC. Leukocytosis and resistance to septic shock in intercellular adhesion molecule 1-deficient mice. J Exp Med. 1994;180:95–109. - PMC - PubMed

Publication types

MeSH terms

Substances