. 2019 Sep 30;374(1782):20180331.
doi: 10.1098/rstb.2018.0331. Epub 2019 Aug 12.

Percolation models of pathogen spillover

Affiliations

Percolation models of pathogen spillover

Alex D Washburne et al. Philos Trans R Soc Lond B Biol Sci. .

Abstract

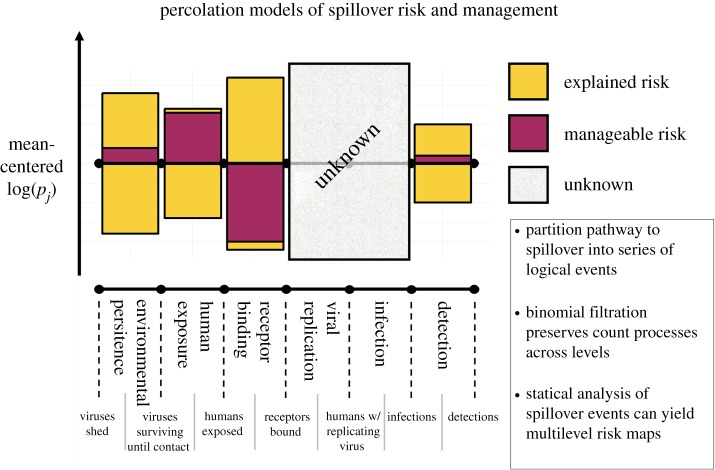
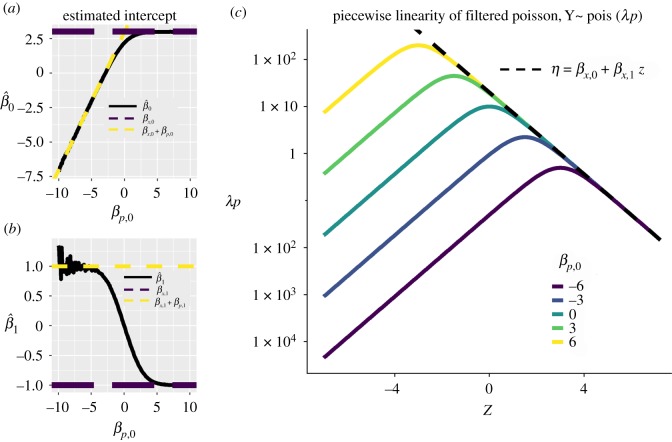
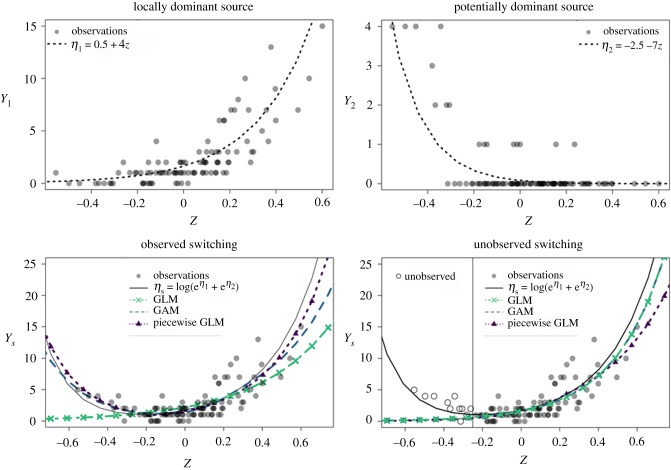
Predicting pathogen spillover requires counting spillover events and aligning such counts with process-related covariates for each spillover event. How can we connect our analysis of spillover counts to simple, mechanistic models of pathogens jumping from reservoir hosts to recipient hosts? We illustrate how the pathways to pathogen spillover can be represented as a directed graph connecting reservoir hosts and recipient hosts and the number of spillover events modelled as a percolation of infectious units along that graph. Percolation models of pathogen spillover formalize popular intuition and management concepts for pathogen spillover, such as the inextricably multilevel nature of cross-species transmission, the impact of covariance between processes such as pathogen shedding and human susceptibility on spillover risk, and the assumptions under which the effect of a management intervention targeting one process, such as persistence of vectors, will translate to an equal effect on the overall spillover risk. Percolation models also link statistical analysis of spillover event datasets with a mechanistic model of spillover. Linear models, one might construct for process-specific parameters, such as the log-rate of shedding from one of several alternative reservoirs, yield a nonlinear model of the log-rate of spillover. The resulting nonlinearity is approximately piecewise linear with major impacts on statistical inferences of the importance of process-specific covariates such as vector density. We recommend that statistical analysis of spillover datasets use piecewise linear models, such as generalized additive models, regression clustering or ensembles of linear models, to capture the piecewise linearity expected from percolation models. We discuss the implications of our findings for predictions of spillover risk beyond the range of observed covariates, a major challenge of forecasting spillover risk in the Anthropocene. This article is part of the theme issue 'Dynamic and integrative approaches to understanding pathogen spillover'.

Keywords: generalized linear model; multilevel model; percolation; probability; regression; spillover.


Conflict of interest statement

We declare we have no competing interests.

Figures

Figure 1.
Figure 1.
Partitioning the pathway to spillover into a series of logical events allows one to model, study, conceptualize and visualize risk maps of spillover across levels. Percolation models subdivide spillover into a series of events, such as environmental persistence or viral replication, in-between which there are pools of potential observations, such as the number of human exposures or the number of infected humans. Some variation in the overall risk of pathogen spillover can be explained through known associations between log-probabilities log(pj) of each event j in the series and external covariates. A management action can differentially impact the probabilities of each event happening leading to a degree of manageable risk under a proposed intervention. Covariances between attrition rates at different levels, and even directionality of changes following a management action, can be visualized with asymmetric graphs of manageable risk. Pathogen spillover is an inextricably multilevel process. As such, quantifying the manageable risk requires knowing the impacts of management actions on every one of the series of events separating a wildlife pathogen from a human infection. Unknown or unstudied levels can impact the overall effect of an intervention on spillover risk. Such unknown effects must be explicitly recognized and can be either assumed to be unaffected or prioritized for further study.
Figure 2.
Figure 2.
The nonlinearities of equation (3.4) affect our inferences from spillover count datasets. Simulating data under the linear model of equation (3.4) illustrates how the intercept β^0 (a) and slope β^1 (b) of spillover counts estimated under a generalized linear model switch between those predicted from the linear models in equations (3.3) and (3.6). For lower attrition, simulated here as a large, positive baseline log-odds of survival through percolation βp,0, the slope of the attrition process contributes less to the observed slope of spillover counts. Thus, spillover count datasets can lead one to underestimate the potential sensitivity of a level to management action well outside the range of observed covariates. (c) These results stem from the approximate piecewise linearity of the canonical parameter one can calculate from a percolation model of pathogen spillover. Here, we plot the nonlinearity of the canonical parameter as a function of the covariate, z, across a range of intercepts for the baseline log-odds of an infectious unit surviving the percolation along the pathway to spillover.
Figure 3.
Figure 3.
Pooled counts of infectious units from alternative pathways produce a nonlinearity similar to the nonlinearity arising from attrition. In this manuscript, we show this common nonlinearity inherent in percolation models of spillover is approximately a switching or piecewise linearity. If one reservoir or source is the dominant source in our dataset (a) but another, more sensitive source (b) could become dominant outside the range of observed covariates owing to its association with a covariate, z, the pooled counts will not follow a generalized linear model (GLM) (c,d). If pathway switching—the exchange of dominance across alternative pathways—is observed (c), then percolation models reveal how piecewise linear [34] or piecewise cubic splines such as those in generalized additive models (GAMs) can produce accurate predictions outside the range of observed covariates. If pathway switching is not observed (d), then, like the low-attrition processes in figure 2, the sensitivity of non-dominant pathways can be invisible to the machinery we use to infer how spillover risk will change with the covariate.

References

    1. Power AG, Mitchell CE. 2004. Pathogen spillover in disease epidemics. Am. Nat. 164, S79–S89. (10.1086/424610) - DOI - PubMed
    1. Morse SS, Mazet JAK, Woolhouse M, Parrish CR, Carroll D, Karesh WB, Zambrana-Torrelio C, Lipkin WI, Daszak P. 2012. Prediction and prevention of the next pandemic zoonosis. Lancet 380, 1956–1965. (10.1016/S0140-6736(12)61684-5) - DOI - PMC - PubMed
    1. Plowright RK, Parrish CR, McCallum H, Hudson PJ, Ko AI, Graham AL, Lloyd-Smith JO. 2017. Pathways to zoonotic spillover. Nat. Rev. Microbiol. 15, 502 (10.1038/nrmicro.2017.45) - DOI - PMC - PubMed
    1. Washburne AD, Silverman JD, Morton JT, Becker DJ, Crowley D, Mukherjee S, David LA, Plowright RK. 2019. Phylofactorization: a graph partitioning algorithm to identify phylogenetic scales of ecological data. Ecol. Monogr. 89, e01353 (10.1002/ecm.1353) - DOI
    1. Becker DJ, Washburne AD, Faust CL, Pulliam JRC, Mordecai EA, Lloyd-Smith JO, Plowright RK. 2019. Dynamic and integrative approaches to understanding pathogen spillover. Phil. Trans. R. Soc. B 374, 20190014 (10.1098/rstb.2019.0014) - DOI - PMC - PubMed

MeSH terms

LinkOut - more resources