Review
. 2019 Sep 30;374(1782):20190016.
doi: 10.1098/rstb.2019.0016. Epub 2019 Aug 12.

Dose-response and transmission: the nexus between reservoir hosts, environment and recipient hosts

Affiliations
Review

Dose-response and transmission: the nexus between reservoir hosts, environment and recipient hosts

Tamika J Lunn et al. Philos Trans R Soc Lond B Biol Sci. .

Abstract

Dose is the nexus between exposure and all upstream processes that determine pathogen pressure, and is thereby an important element underlying disease dynamics. Understanding the relationship between dose and disease is particularly important in the context of spillover, where nonlinearities in the dose-response could determine the likelihood of transmission. There is a need to explore dose-response models for directly transmitted and zoonotic pathogens, and how these interactions integrate within-host factors to consider, for example, heterogeneity in host susceptibility and dose-dependent antagonism. Here, we review the dose-response literature and discuss the unique role dose-response models have to play in understanding and predicting spillover events. We present a re-analysis of dose-response experiments for two important zoonotic pathogens (Middle East respiratory syndrome coronavirus and Nipah virus), to exemplify potential difficulties in differentiating between appropriate models with small exposure experiment datasets. We also discuss the data requirements needed for robust selection between dose-response models. We then suggest how these processes could be modelled to gain more realistic predictions of zoonotic transmission outcomes and highlight the exciting opportunities that could arise with increased collaboration between the virology and epidemiology disciplines. This article is part of the theme issue 'Dynamic and integrative approaches to understanding pathogen spillover'.

Keywords: infection; infectious disease; modelling; nonlinearities; spillover; virus.


Conflict of interest statement

We declare we have no competing interests.

Figures

Figure 1.
Figure 1.
Prevalence of shedding or mortality in mice experimentally inoculated with MERS-CoV. Groups of six mice were inoculated intranasally with doses of 101, 102, 103 104 or 105 TCID50 of MERS-CoV in a total volume of 50 µl. Data are available for only five of the mice infected at the highest dose. Viral shedding was quantified by quantitative reverse transcription-polymerase chain reaction (qRT-PCR) performed on oropharyncheal swabs. Points show prevalence of shedding or mortality in each group, and error bars are exact binomial 95% confidence intervals for the predicted probability of infection given the dose. The different coloured lines are the independent action model, for different values of r, the probability of infection from an individual virus particle. The maximum-likelihood estimate of r is 0.00571, shown as a red line. The lower and upper 95% confidence intervals based on profile likelihood for r are 0.002 and 0.0146. Dashed red lines show the corresponding dose–response curves. (Online version in colour.)
Figure 2.
Figure 2.
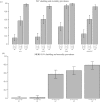
Prevalence of (a) NiV and (b) MERS-CoV shedding or mortality in experimentally inoculated hamsters and mice, respectively. Groups represent intranasal inoculations with doses of 103,105 or 107 TCID50 of NiV in a total volume of 100 µl, and 101, 102, 103, 104 or 105 TCID50 of MERS-CoV in a total volume of 50 µl. Shedding was quantified by qRT-PCR performed on nasal, rectal, throat or urogenital (NiV) and oropharyncheal (MERS-CoV) swabs. Estimates of shedding prevalence and corresponding 95% confidence intervals were calculated using maximum-likelihood estimation, following a binomial distribution for each combination of dose and shedding route.
Figure 3.
Figure 3.
Intensity (shedding in TCID50 equivalents ml−1) and timing (days post infection) of NiV shedding across inoculated hamsters (individuals shown by colour), separated by exposure dose and shedding route. Dose groups represent intranasal inoculations with doses of 103, 105 or 107 TCID50 of NiV in a total volume of 100 µl. Viral shedding titre was quantified by qRT-PCR performed on nasal, rectal, throat or urogenital swabs, evaluated daily for 14 days post inoculation. (Online version in colour.)

References

    1. Conlan AJ, Line JE, Hiett K, Coward C, Van Diemen PM, Stevens MP, Jones MA, Gog JR, Maskell DJ. 2011. Transmission and dose–response experiments for social animals: a reappraisal of the colonization biology of Campylobacter jejuni in chickens. J. R. Soc. Interface 8, 1720–1735. (10.1098/rsif.2011.0125) - DOI - PMC - PubMed
    1. Teunis P, Takumi K, Shinagawa K. 2004. Dose response for infection by Escherichia coli O157:H7 from outbreak data. Risk Anal. 24, 401–407. (10.1111/j.0272-4332.2004.00441.x) - DOI - PubMed
    1. Toth DJA, et al. 2013. Quantitative models of the dose-response and time course of inhalational anthrax in humans. PLoS Pathog. 9, 18 (10.1371/journal.ppat.1003555) - DOI - PMC - PubMed
    1. Haas CN, Thayyar-Madabusi A, Rose JB, Gerba CP. 2000. Development of a dose-response relationship for Escherichia coli O157:H7. Int. J. Food Microbiol. 56, 153–159. (10.1016/S0168-1605(99)00197-X) - DOI - PubMed
    1. Manlove KR, Cassirer EF, Plowright RK, Cross PC, Hudson PJ. 2017. Contact and contagion: bighorn sheep demographic states vary in probability of transmission given contact. J. Anim. Ecol. 86, 908–920. (10.1111/1365-2656.12664) - DOI - PMC - PubMed

Publication types

LinkOut - more resources