. 2019 Sep 30;374(1782):20180335.
doi: 10.1098/rstb.2018.0335. Epub 2019 Aug 12.

Mosquito and primate ecology predict human risk of yellow fever virus spillover in Brazil

Affiliations

Mosquito and primate ecology predict human risk of yellow fever virus spillover in Brazil

Marissa L Childs et al. Philos Trans R Soc Lond B Biol Sci. .

Abstract

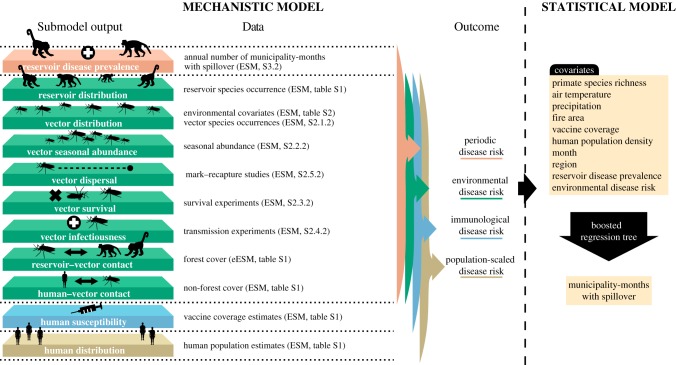
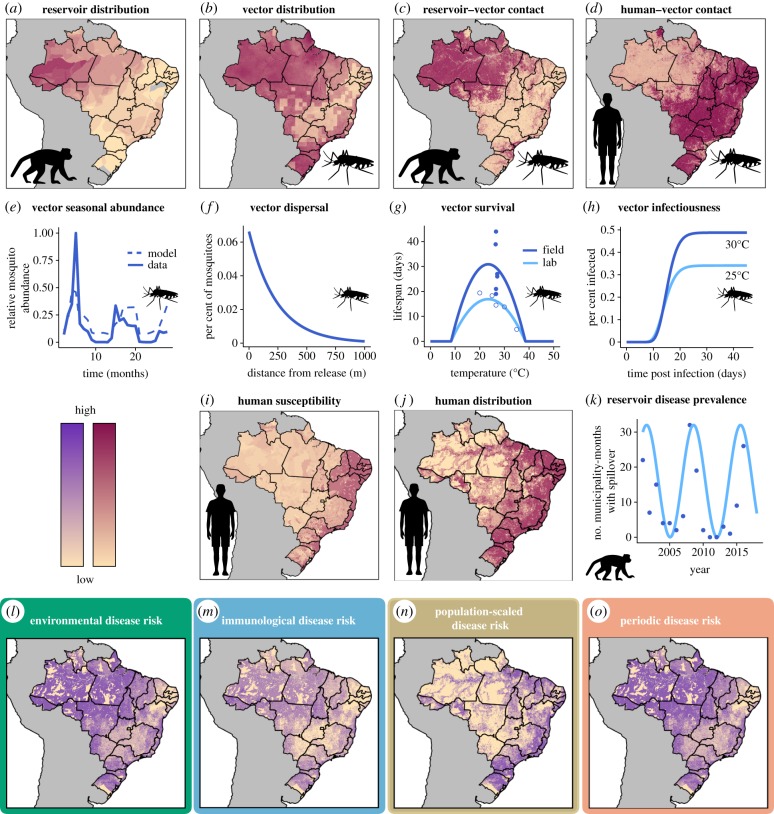
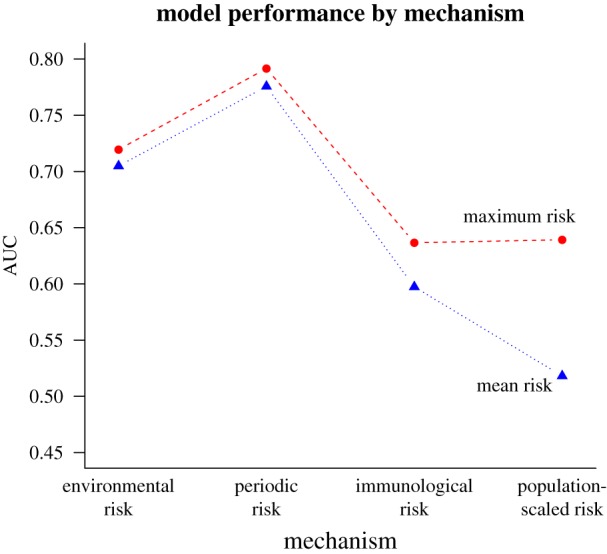
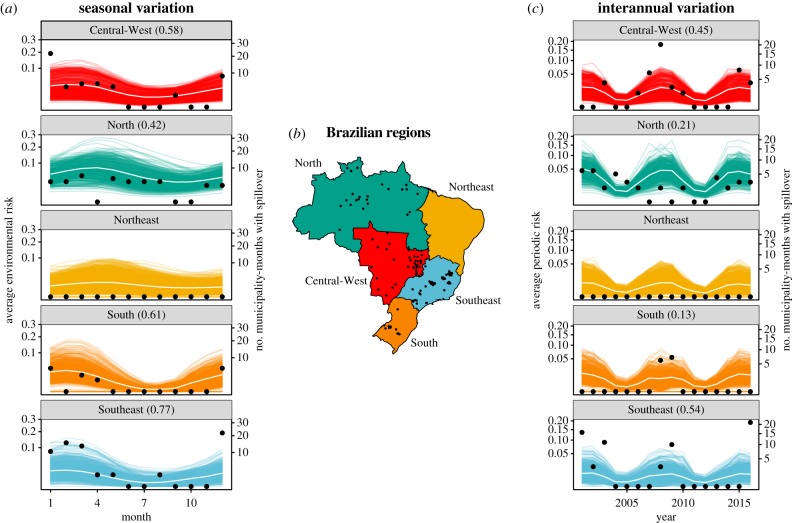
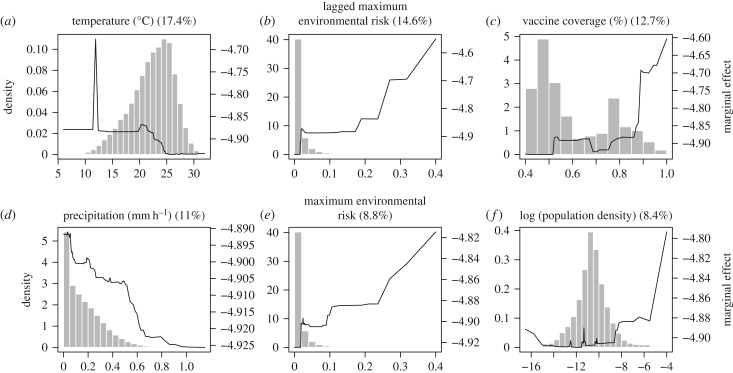
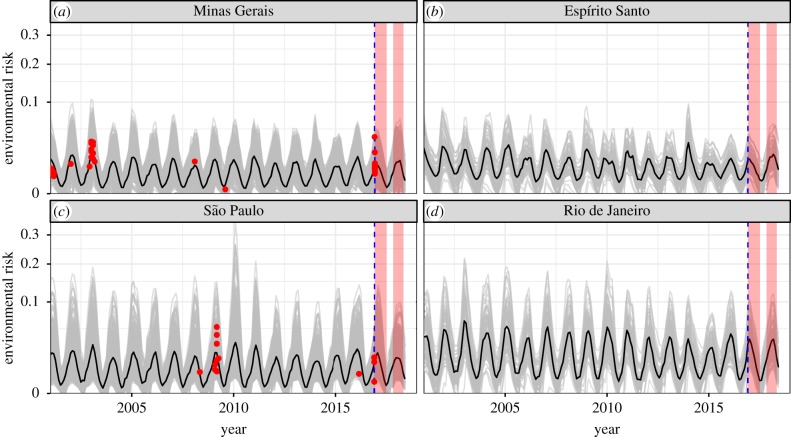
Many (re)emerging infectious diseases in humans arise from pathogen spillover from wildlife or livestock, and accurately predicting pathogen spillover is an important public health goal. In the Americas, yellow fever in humans primarily occurs following spillover from non-human primates via mosquitoes. Predicting yellow fever spillover can improve public health responses through vector control and mass vaccination. Here, we develop and test a mechanistic model of pathogen spillover to predict human risk for yellow fever in Brazil. This environmental risk model, based on the ecology of mosquito vectors and non-human primate hosts, distinguished municipality-months with yellow fever spillover from 2001 to 2016 with high accuracy (AUC = 0.72). Incorporating hypothesized cyclical dynamics of infected primates improved accuracy (AUC = 0.79). Using boosted regression trees to identify gaps in the mechanistic model, we found that important predictors include current and one-month lagged environmental risk, vaccine coverage, population density, temperature and precipitation. More broadly, we show that for a widespread human viral pathogen, the ecological interactions between environment, vectors, reservoir hosts and humans can predict spillover with surprising accuracy, suggesting the potential to improve preventive action to reduce yellow fever spillover and avert onward epidemics in humans. This article is part of the theme issue 'Dynamic and integrative approaches to understanding pathogen spillover'.

Keywords: Brazil; disease ecology; mosquito; pathogen spillover; vector-borne disease; yellow fever.


Conflict of interest statement

We have no competing interests.

Figures

Figure 1.
Figure 1.
Mechanistic and statistical model schematic. Submodels of components in the mechanistic model are parameterized using independent data on reservoir species, vector species occurrences, seasonal abundances, vector mark–recapture studies, vector survival, transmission experiments, forest cover, estimated vaccine coverage and human population estimates. Reservoir disease prevalence is estimated from annual number of municipality-months with spillover. The output from the submodels are used in a mechanistic spillover model to predict four risk metrics of yellow fever in humans: periodic disease risk, environmental disease risk, immunological disease risk, and population-scaled disease risk. Environmental disease risk metric is then used as a covariate in a boosted regression tree to predict the municipality-months with spillover and identify covariates important for predicting spillover. Other environmental covariates are also included in the boosted regression tree. Details on data used in the mechanistic model can be found in the electronic supplementary material (ESM). Specific locations within the electronic supplementary material are noted parenthetically by either the section or table in which details can be found. Data used in the boosted regression tree are described in electronic supplementary material, table S6. Layers shown on the left correspond to mechanistic model components in figure 2a–k.
Figure 2.
Figure 2.
Data used to estimate ecological and human population components of spillover (a–k) and estimates of overall spillover risk (lo). Number of primate reservoir species (a), vector species probability of occurrence (b), reservoir–vector contact probability (c), human–vector contact probability (d), human susceptibility approximated by 1 minus estimated vaccine coverage (i), and human distribution (j) vary spatially. Vector seasonal abundance is modelled as a function of rainfall using mosquito capture data (e). Vector dispersal depends on distance and is estimated from mark–recapture studies (f). Vector survival has been measured at different temperatures in laboratory (open circles) and field (closed circles) settings and was used to estimate temperature-dependent vector lifespan (g). Transmission studies at different temperatures inform modelled probability of vector infectiousness as a function of days since infecting bite and temperature (h). Phenomenologically modelled reservoir disease prevalence (light blue line, k) is approximated from human case data (blue dots, k). All mechanistic model components (a–k) are derived from empirical data in previously published studies. Components a–h are used to predict environmental risk of disease spillover (l), components ai are used for immunological risk (m), components aj are used for population-scaled risk (n) and components ah and k are used for periodic risk (o). The four disease risk metrics presented here for illustrative purposes were estimated for January 2001 (l–o). (Online version in colour.)
Figure 3.
Figure 3.
Municipality maximum periodic risk best predicts spillover. Each point is the calculated area under the curve (AUC) from spillover predicted by modelled risk, where higher AUC represents a model better able to distinguish between spillover and non-spillover observations. The risk models (from left to right on the x-axis) are environmental risk, periodic risk, immunological risk and population-scaled risk. Municipality-wide maxima (red dashed lines and circles) and means (blue dotted lines and triangles) are shown for each metric.
Figure 4.
Figure 4.
Modelled environmental risk captures seasonal variation and periodic risk captures interannual variation in spillover. Each coloured line is the seasonal average of modelled maximum environmental risk in a municipality (a) and the yearly average of modelled maximum periodic risk in a municipality (c). White lines are the regional average over the municipal curves. Black points represent the total number of municipality-months with spillover in that region per month (a) and per year (c), or the municipalities with at least one month with spillover (b). Correlations between regional average environmental risk (white lines) and regional number of municipality-months with spillover (black points) are shown in parentheses (a,c) for regions where spillover has occurred (all except the Northeast). Regions of Brazil are shown with corresponding colours (b). The Southeast (shown in blue) was the region with the majority of cases during the large outbreaks in 2016–2018. (Online version in colour.)
Figure 5.
Figure 5.
Partial dependence plots of top six predictors of spillover in a municipality-month from boosted regression tree analysis. Plots are listed in order of predictive importance with relative influence (%) listed. In order, the variables identified as most important predictors were average temperature in the municipality-month (a), one-month lagged maximum environmental risk (b), estimated vaccine coverage (c), average rate of precipitation in the municipality-month (d), current month maximum environmental risk (e) and municipality population density (log-scaled for visibility, f). Histograms show the distribution of observed municipality-months at each covariate value (left y-axis) and solid lines show the marginal effects of covariate on model prediction (right y-axis). Marginal effects highlight the characteristics of municipality-months that experienced spillover in Brazil 2001–2016.
Figure 6.
Figure 6.
Mechanistic model predicts consistent low, seasonal risk across states in Southeast region of Brazil, where a large outbreak occurred in 2016–2018. Data are only available until the end of 2016 (blue dashed line), so do not include the duration of the 2016–2018 outbreaks (pink boxes). Only 2001–2016 spillovers are shown (red points), defined as municipality-months with human yellow fever cases. Red points show the date of spillover (x-axis) and modelled maximum environmental risk in the spillover municipality (y-axis). Grey lines are municipality estimates of maximum environmental risk and the black line is the environmental risk averaged over all municipalities in the state. Prior to the large outbreak in 2017–2018, spillover had occurred in Minas Gerais and São Paulo (a,c) but not in Espírito Santo or Rio de Janeiro (b,d). (Online version in colour.)

References

    1. Woolhouse MEJ, Haydon DT, Antia R. 2005. Emerging pathogens: the epidemiology and evolution of species jumps. Trends Ecol. Evol. 20, 238–244. (10.1016/j.tree.2005.02.009) - DOI - PMC - PubMed
    1. Jones KE, Patel NG, Levy MA, Storeygard A, Balk D, Gittleman JL, Daszak P. 2008. Global trends in emerging infectious diseases. Nature 451, 990–993. (10.1038/nature06536) - DOI - PMC - PubMed
    1. Plowright RK, Parrish CR, McCallum H, Hudson PJ, Ko AI, Graham AL, Lloyd-Smith JO. 2017. Pathways to zoonotic spillover. Nat. Rev. Microbiol. 15, 502–510. (10.1038/nrmicro.2017.45) - DOI - PMC - PubMed
    1. Plowright RK, et al. 2014. Ecological dynamics of emerging bat virus spillover. Proc. R. Soc. B 282, 20142124 (10.1098/rspb.2014.2124) - DOI - PMC - PubMed
    1. Lloyd-Smith JO, et al. 2009. Epidemic dynamics at the human-animal interface. Science 326, 1362–1367. (10.1126/science.1177345) - DOI - PMC - PubMed

Publication types

LinkOut - more resources