Review
. 2019 Sep 30;374(1782):20180336.
doi: 10.1098/rstb.2018.0336. Epub 2019 Aug 12.

Sampling to elucidate the dynamics of infections in reservoir hosts

Affiliations
Review

Sampling to elucidate the dynamics of infections in reservoir hosts

Raina K Plowright et al. Philos Trans R Soc Lond B Biol Sci. .

Abstract

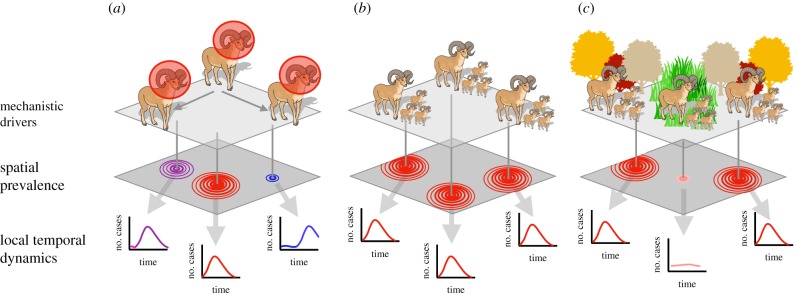
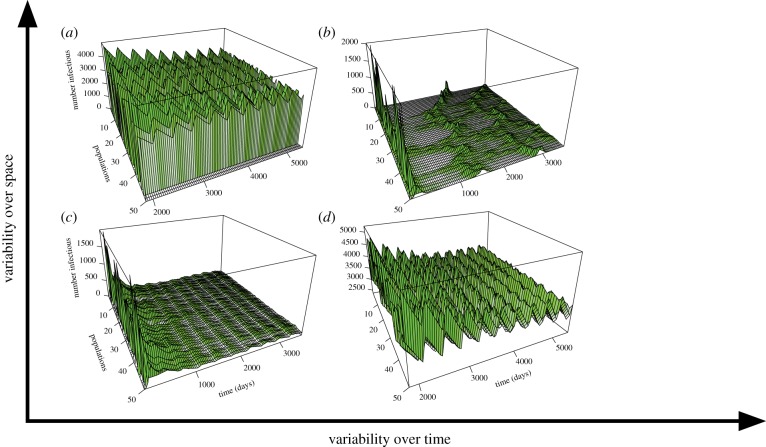
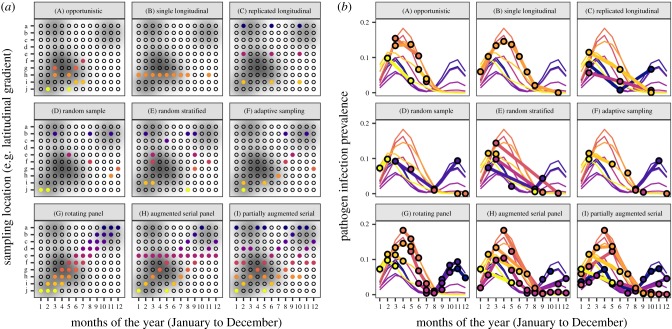
The risk of zoonotic spillover from reservoir hosts, such as wildlife or domestic livestock, to people is shaped by the spatial and temporal distribution of infection in reservoir populations. Quantifying these distributions is a key challenge in epidemiology and disease ecology that requires researchers to make trade-offs between the extent and intensity of spatial versus temporal sampling. We discuss sampling methods that strengthen the reliability and validity of inferences about the dynamics of zoonotic pathogens in wildlife hosts. This article is part of the theme issue 'Dynamic and integrative approaches to understanding pathogen spillover'.

Keywords: emerging infectious diseases; sampling reservoir hosts; spillover; wildlife disease; zoonoses.


Conflict of interest statement

We have no competing interests.

Figures

Figure 1.
Figure 1.
Mechanisms governing spatial and temporal patterns and structure of disease dynamics include dispersal of individuals, social organization and synchrony of host populations and Moran effects. For each mechanism, the color on the spatial prevalence panel indicates the time at which the local outbreak began, and the circles represent the extent of the pathogen in space. The prevalence curves in the local temporal dynamics panel show prevalence through time at the epicentre of each local outbreak. In (a), dispersal of infected hosts (bighorn sheep with red circles) produces spatial and temporal autocorrelation consistent with the movement patterns of the primary host. In (b), synchronous demographic or behavioural dynamics within the host species produce synchrony in spatial and temporal dynamics of prevalence within all host populations. In (c), Moran effects across populations create synchrony among populations experiencing similar environmental conditions. Here, we imagine that limited nutritional availability consistently increases host susceptibility to infection during autumn in forest populations. This leads to synchronous outbreaks in all forest populations that experience the nutrient deficit, without simultaneous outbreaks in populations in locations that are not forested. Cases are infected individuals.
Figure 2.
Figure 2.
A simulation of pathogen dynamics in reservoir host populations with varying autocorrelation of prevalence in space (populations) and time (days). Prevalence falls along spatial and temporal gradients of variability. In (a), variability is high over space but low over time (e.g. chronic infections with highly variable prevalence over locations but stable prevalence over time such as hepatitis B in human populations) [34]. In (b), variability is high over space and time (e.g. acute pathogens such as canine distemper virus in carnivores at the extent of the USA). In (c), variability is low over space and time, as with chronic, endemic pathogens in highly connected populations, such as herpes simplex virus in human populations. In (d), variability is low over space but high over time, as in highly contagious infections with seasonal transmission such as influenza. Methods for the simulations are described in electronic supplementary material, Methods.
Figure 3.
Figure 3.
Allocation of sampling effort over time (months) and space (e.g. along a latitudinal gradient) and consequences for inference of pathogen prevalence. Grey shading in panel (a) denotes the underlying spatial and temporal pattern in infection prevalence (the kernel-smoothed intensity of a random realization of a binomial point process). Open circles represent sampling locations. Colours indicate sampling location. Panel (b) illustrates the observed and true temporal trends in infection prevalence across sampling sites. Thin lines indicate the known infection prevalence over the annual cycle, whereas filled circles are estimated prevalence values given each design and ignoring error in estimation of the prevalence. Thick lines indicate the observed time-series of infection prevalence and only connect points from a single location; locations that are only sampled once within a design have no corresponding thick line. Heuristic sampling designs are as follows: opportunistic (A), single longitudinal (B), replicated longitudinal (C), randomized (D), random stratified (E), adaptive (F), rotating (G), augmented, serially alternating (H) and partially augmented, serially alternating (I). Sampling effort is held relatively constant across A to F and G to I (for which designs can require higher sampling effort). Methods for the simulations are given in electronic supplementary material, Methods.

References

    1. Plowright RK, Parrish CR, McCallum H, Hudson PJ, Ko AI, Graham AL, Lloyd-Smith JO. 2017. Pathways to zoonotic spillover. Nat. Rev. Microbiol. 15, 502–510. (10.1038/nrmicro.2017.45) - DOI - PMC - PubMed
    1. Kuiken T, Leighton F, Fouchier R, LeDuc J, Peiris J, Schudel A, Stöhr K, Osterhaus AD. 2005. Pathogen surveillance in animals. Science 309, 1680–1681. (10.1126/science.1113310) - DOI - PubMed
    1. Viana M, Mancy R, Biek R, Cleaveland S, Cross PC, Lloyd-Smith JO, Haydon DT. 2014. Assembling evidence for identifying reservoirs of infection. Trends Ecol. Evol. 29, 270–279. (10.1016/j.tree.2014.03.002) - DOI - PMC - PubMed
    1. Bean AG, Baker ML, Stewart CR, Cowled C, Deffrasnes C, Wang L-F, Lowenthal JW. 2013. Studying immunity to zoonotic diseases in the natural host–keeping it real. Nat. Rev. Immunol. 13, 851 (10.1038/nri3551) - DOI - PMC - PubMed
    1. Stallknecht DE. 2007. Impediments to wildlife disease surveillance, research, and diagnostics. In Wildlife and emerging zoonotic diseases: the biology, circumstances and consequences of cross-species transmission, pp. 445–461. Berlin: Springer. - PubMed

Publication types

MeSH terms

LinkOut - more resources