. 2019 Sep 5;105(3):456-476.
doi: 10.1016/j.ajhg.2019.07.003. Epub 2019 Aug 8.

Extreme Polygenicity of Complex Traits Is Explained by Negative Selection

Affiliations

Extreme Polygenicity of Complex Traits Is Explained by Negative Selection

Luke J O'Connor et al. Am J Hum Genet. .

Abstract

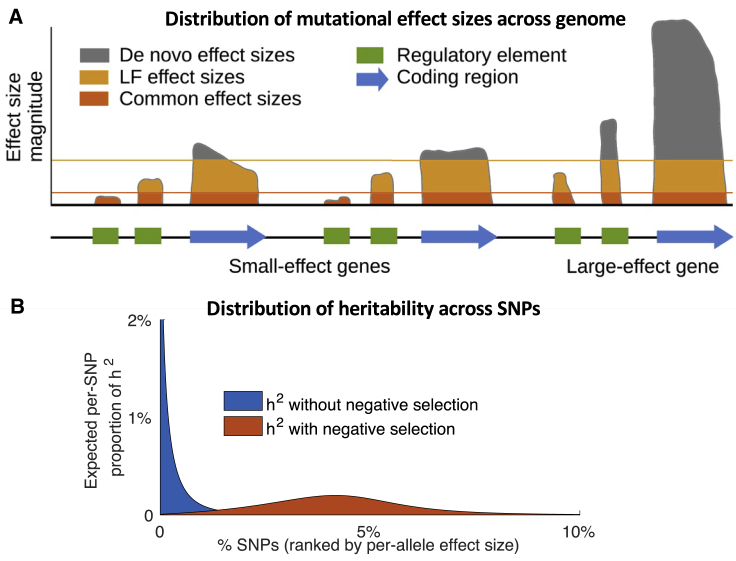
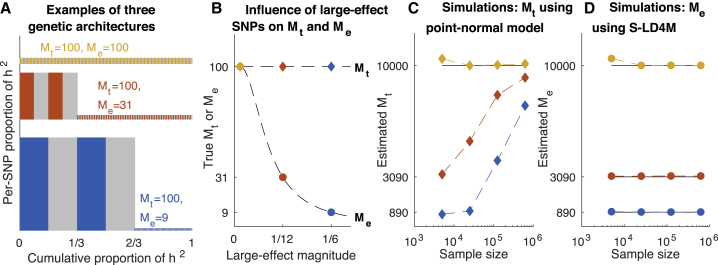
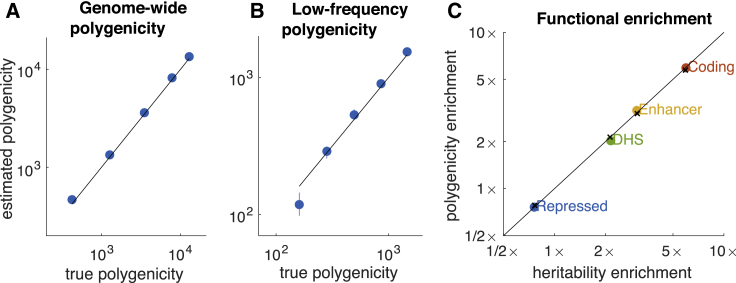
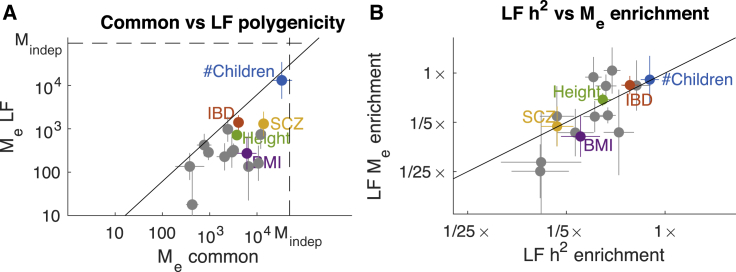
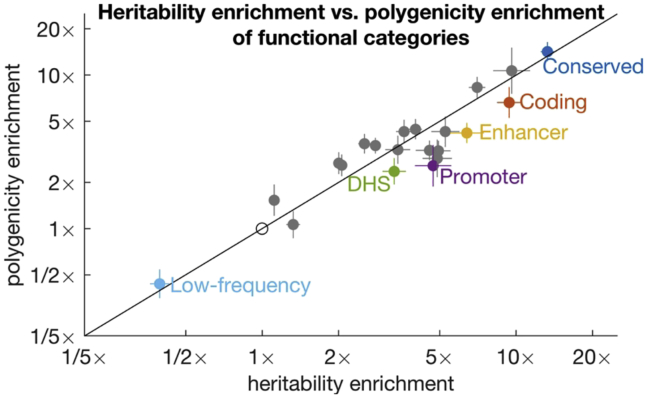
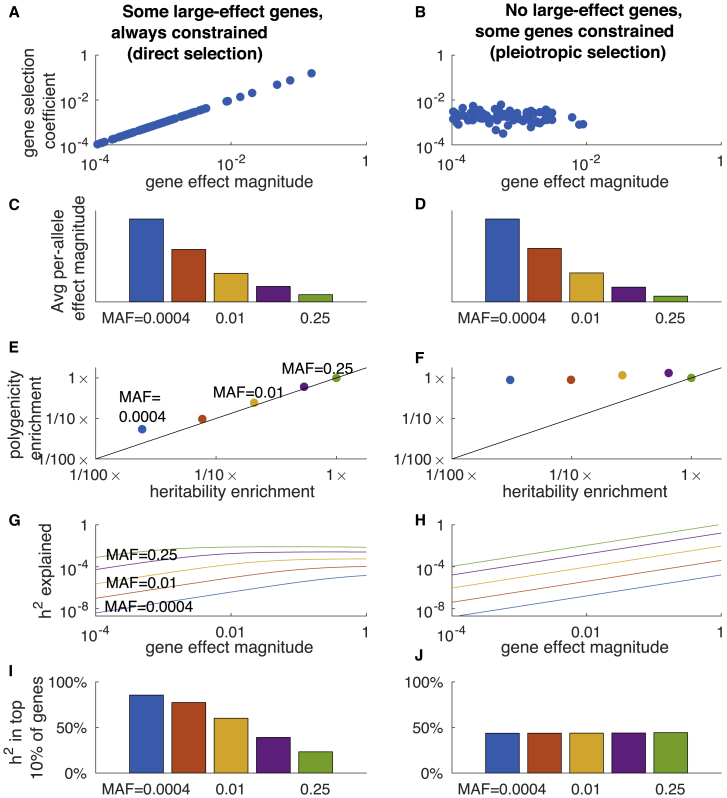
Complex traits and common diseases are extremely polygenic, their heritability spread across thousands of loci. One possible explanation is that thousands of genes and loci have similarly important biological effects when mutated. However, we hypothesize that for most complex traits, relatively few genes and loci are critical, and negative selection-purging large-effect mutations in these regions-leaves behind common-variant associations in thousands of less critical regions instead. We refer to this phenomenon as flattening. To quantify its effects, we introduce a mathematical definition of polygenicity, the effective number of independently associated SNPs (Me), which describes how evenly the heritability of a trait is spread across the genome. We developed a method, stratified LD fourth moments regression (S-LD4M), to estimate Me, validating that it produces robust estimates in simulations. Analyzing 33 complex traits (average N = 361k), we determined that heritability is spread ∼4× more evenly among common SNPs than among low-frequency SNPs. This difference, together with evolutionary modeling of new mutations, suggests that complex traits would be orders of magnitude less polygenic if not for the influence of negative selection. We also determined that heritability is spread more evenly within functionally important regions in proportion to their heritability enrichment; functionally important regions do not harbor common SNPs with greatly increased causal effect sizes, due to selective constraint. Our results suggest that for most complex traits, the genes and loci with the most critical biological effects often differ from those with the strongest common-variant associations.

Keywords: GWAS; SLD4M; heritability; negative selection; polygenicity.


Conflict of interest statement

The authors declare no competing interests.

Figures

Figure 1
Figure 1
Illustration of Flattening due to Negative Selection (A) We illustrate the range of possible per-allele effect sizes for a SNP at each site for a toy example of three genes and nearby regulatory regions. Here, the distribution of de novo effects is not highly polygenic; it is dominated by coding mutations in a single large-effect gene (although other genes also harbor small effects). Negative selection imposes an upper effect size bound (possibly soft) on common variants (and, to a lesser extent, low-frequency variants), resulting in increased polygenicity. Within functionally important regions (e.g., coding), a larger proportion of variants have effect sizes near the bound, leading to especially large polygenicity. In practice, this bound may vary across the genome, but we hypothesize that it is much more even than the effect-size distribution of de novo variants. (B) We illustrate the expected per-SNP proportion of heritability for SNPs ranked by per-allele effect size, for a hypothetical trait whose de novo effect-size distribution has a mixture of small- and large-effect mutations. In the absence of negative selection (blue), heritability is concentrated among a limited number of large-effect SNPs. In the presence of negative selection (orange), large-effect SNPs are prevented from becoming common, and thus explain little heritability; instead, heritability is spread across a large number of SNPs with small effects.
Figure 2
Figure 2
Comparison of the Effective Number of Independently Associated SNPs (Me) with the Total Number of SNPs with Nonzero Effects (Mt) (A and B) Examples of three genetic architectures with Mt = 100. (A) Each colored or gray block corresponds to one SNP; both height and width are proportional to the expected proportion of heritability explained by that SNP. The average unit of heritability, denoted Eh2(α2), is the average height (equal to the total area) of the colored and gray regions. Me is equal to h2/Eh2(α2). (B) Mt and Me as a function of the effect size magnitude of the four large-effect SNPs. (C and D) Simulations of the same three genetic architectures with the number of SNPs (and causal SNPs) scaled up by 100×. (C) Estimates of Mt under a point-normal model, at different sample sizes. (D) Estimates of Me using S-LD4M, at different sample sizes. Error bars denote 95% confidence intervals (based on 1,000 simulations) but are smaller than the data points.
Figure 3
Figure 3
Accuracy of S-LD4M Estimates in Simulations with LD (A) Estimates of Me for all SNPs (MAF = 0.5%–50%). (B) Estimates of Me for low-frequency SNPs (MAF = 0.5%–5%); common-SNP Me is fixed at ∼1,000 in these simulations. (C) Estimates of polygenicity enrichment and heritability enrichment in simulations with four functional categories. Black lines denotes y = x, and colored points denote estimates. In (C), × denotes true values. Error bars denote 95% confidence intervals (based on 1,000 simulations) but are smaller than the data points in most cases. Numerical results are reported in Table S1.
Figure 4
Figure 4
Comparison of Common and Low-Frequency Polygenicity across 15 Complex Traits (A) Estimates of Me for common and low-frequency SNPs. Estimates are meta-analyzed across well-powered traits. Common-variant polygenicity was ∼4× greater on average than low-frequency polygenicity. Dotted lines denote the effective number of independent SNPs (Mindep) for common and low-frequency SNPs, respectively, corresponding to an infinitesimal (Gaussian) architecture. The solid line denotes equal per-SNP Me. (B) Estimates of polygenicity enrichment and heritability enrichment for low-frequency SNPs (compared to all common and low-frequency SNPs). The solid line denotes equal enrichment. Error bars denote 95% confidence intervals. Numerical results are reported in Tables 1 and S9.
Figure 5
Figure 5
Estimates of Polygenicity Enrichment and Heritability Enrichment of Functional Categories We report estimates for 20 functional categories plus low-frequency SNPs. Estimates are meta-analyzed across well-powered traits. Error bars denote 95% confidence intervals. Complete results for each trait are reported in Table S9 and meta-analyzed results are reported in Table S10.
Figure 6
Figure 6
Gene-Level Flattening under an Evolutionary Model In the left column (A, C, E, G, I), there are some large-effect genes, but direct stabilizing selection acting on the phenotype strongly constrains these genes. In the right column (B, D, F, H, J), there are no large-effect genes; pleiotropic stabilizing selection has varying effects on each gene, limiting common-SNP effect sizes on average. (A and B) Joint distribution of gene effect size magnitudes and selection coefficients. (C and D) Average squared per-allele effect sizes at different allele frequencies. The strength of selection was chosen to produce similar common-variant effect sizes in both columns. (E and F) Heritability and polygenicity enrichment at different allele frequencies (relative to MAF = 0.25). Polygenicity at MAF = 0.25 is approximately equal for the two columns, due to the different distributions of gene effect sizes. (G and H) Expected heritability explained by a single gene as a function of its effect size, for SNPs at different frequencies. In (G), the selection coefficient is proportional to the effect size. In (H), the selection coefficient is held constant. (I and J) Proportion of heritability explained by the top 10% of largest-effect genes for SNPs at different allele frequencies. Numerical results are reported in Table S11.

References

    1. Purcell S.M., Wray N.R., Stone J.L., Visscher P.M., O’Donovan M.C., Sullivan P.F., Sklar P., International Schizophrenia Consortium Common polygenic variation contributes to risk of schizophrenia and bipolar disorder. Nature. 2009;460:748–752. - PMC - PubMed
    1. Yang J., Benyamin B., McEvoy B.P., Gordon S., Henders A.K., Nyholt D.R., Madden P.A., Heath A.C., Martin N.G., Montgomery G.W. Common SNPs explain a large proportion of the heritability for human height. Nat. Genet. 2010;42:565–569. - PMC - PubMed
    1. Stahl E.A., Wegmann D., Trynka G., Gutierrez-Achury J., Do R., Voight B.F., Kraft P., Chen R., Kallberg H.J., Kurreeman F.A., Diabetes Genetics Replication and Meta-analysis Consortium. Myocardial Infarction Genetics Consortium Bayesian inference analyses of the polygenic architecture of rheumatoid arthritis. Nat. Genet. 2012;44:483–489. - PMC - PubMed
    1. Loh P.R., Bhatia G., Gusev A., Finucane H.K., Bulik-Sullivan B.K., Pollack S.J., de Candia T.R., Lee S.H., Wray N.R., Kendler K.S., Schizophrenia Working Group of Psychiatric Genomics Consortium Contrasting genetic architectures of schizophrenia and other complex diseases using fast variance-components analysis. Nat. Genet. 2015;47:1385–1392. - PMC - PubMed
    1. Bulik-Sullivan B.K., Loh P.-R., Finucane H.K., Ripke S., Yang J., Patterson N., Daly M.J., Price A.L., Neale B.M., Schizophrenia Working Group of the Psychiatric Genomics Consortium LD Score regression distinguishes confounding from polygenicity in genome-wide association studies. Nat. Genet. 2015;47:291–295. - PMC - PubMed

Publication types