. 2019 Aug 22;178(5):1145-1158.e20.
doi: 10.1016/j.cell.2019.07.011. Epub 2019 Aug 8.

A Pliable Mediator Acts as a Functional Rather Than an Architectural Bridge between Promoters and Enhancers

Affiliations

A Pliable Mediator Acts as a Functional Rather Than an Architectural Bridge between Promoters and Enhancers

Laila El Khattabi et al. Cell. .

Abstract

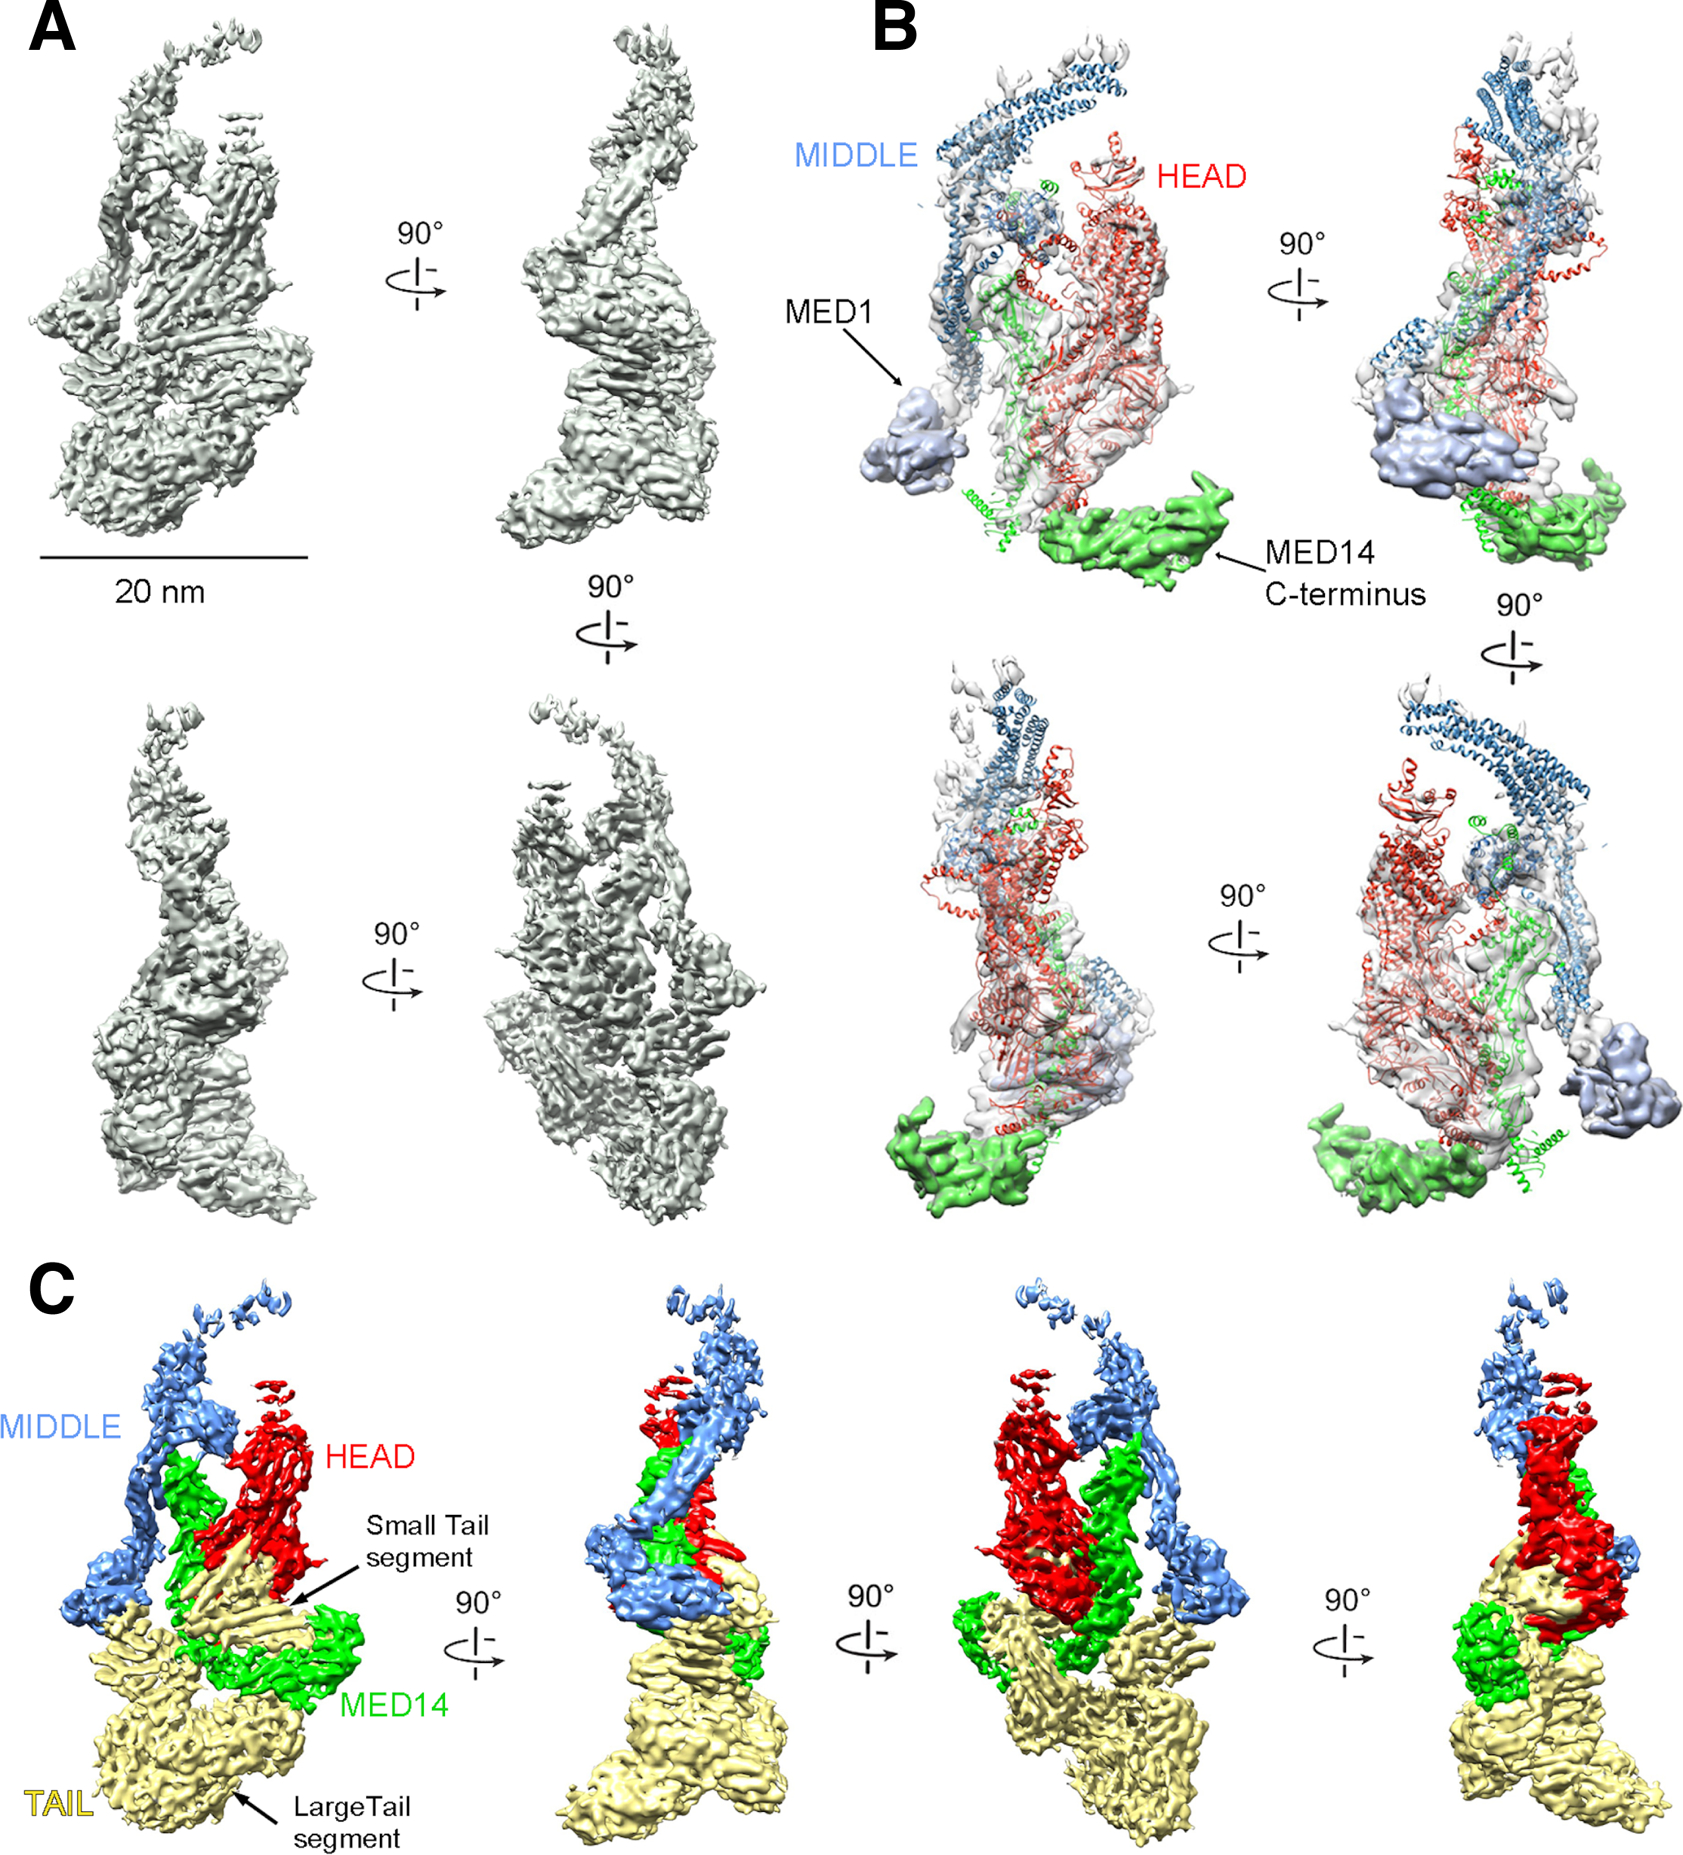
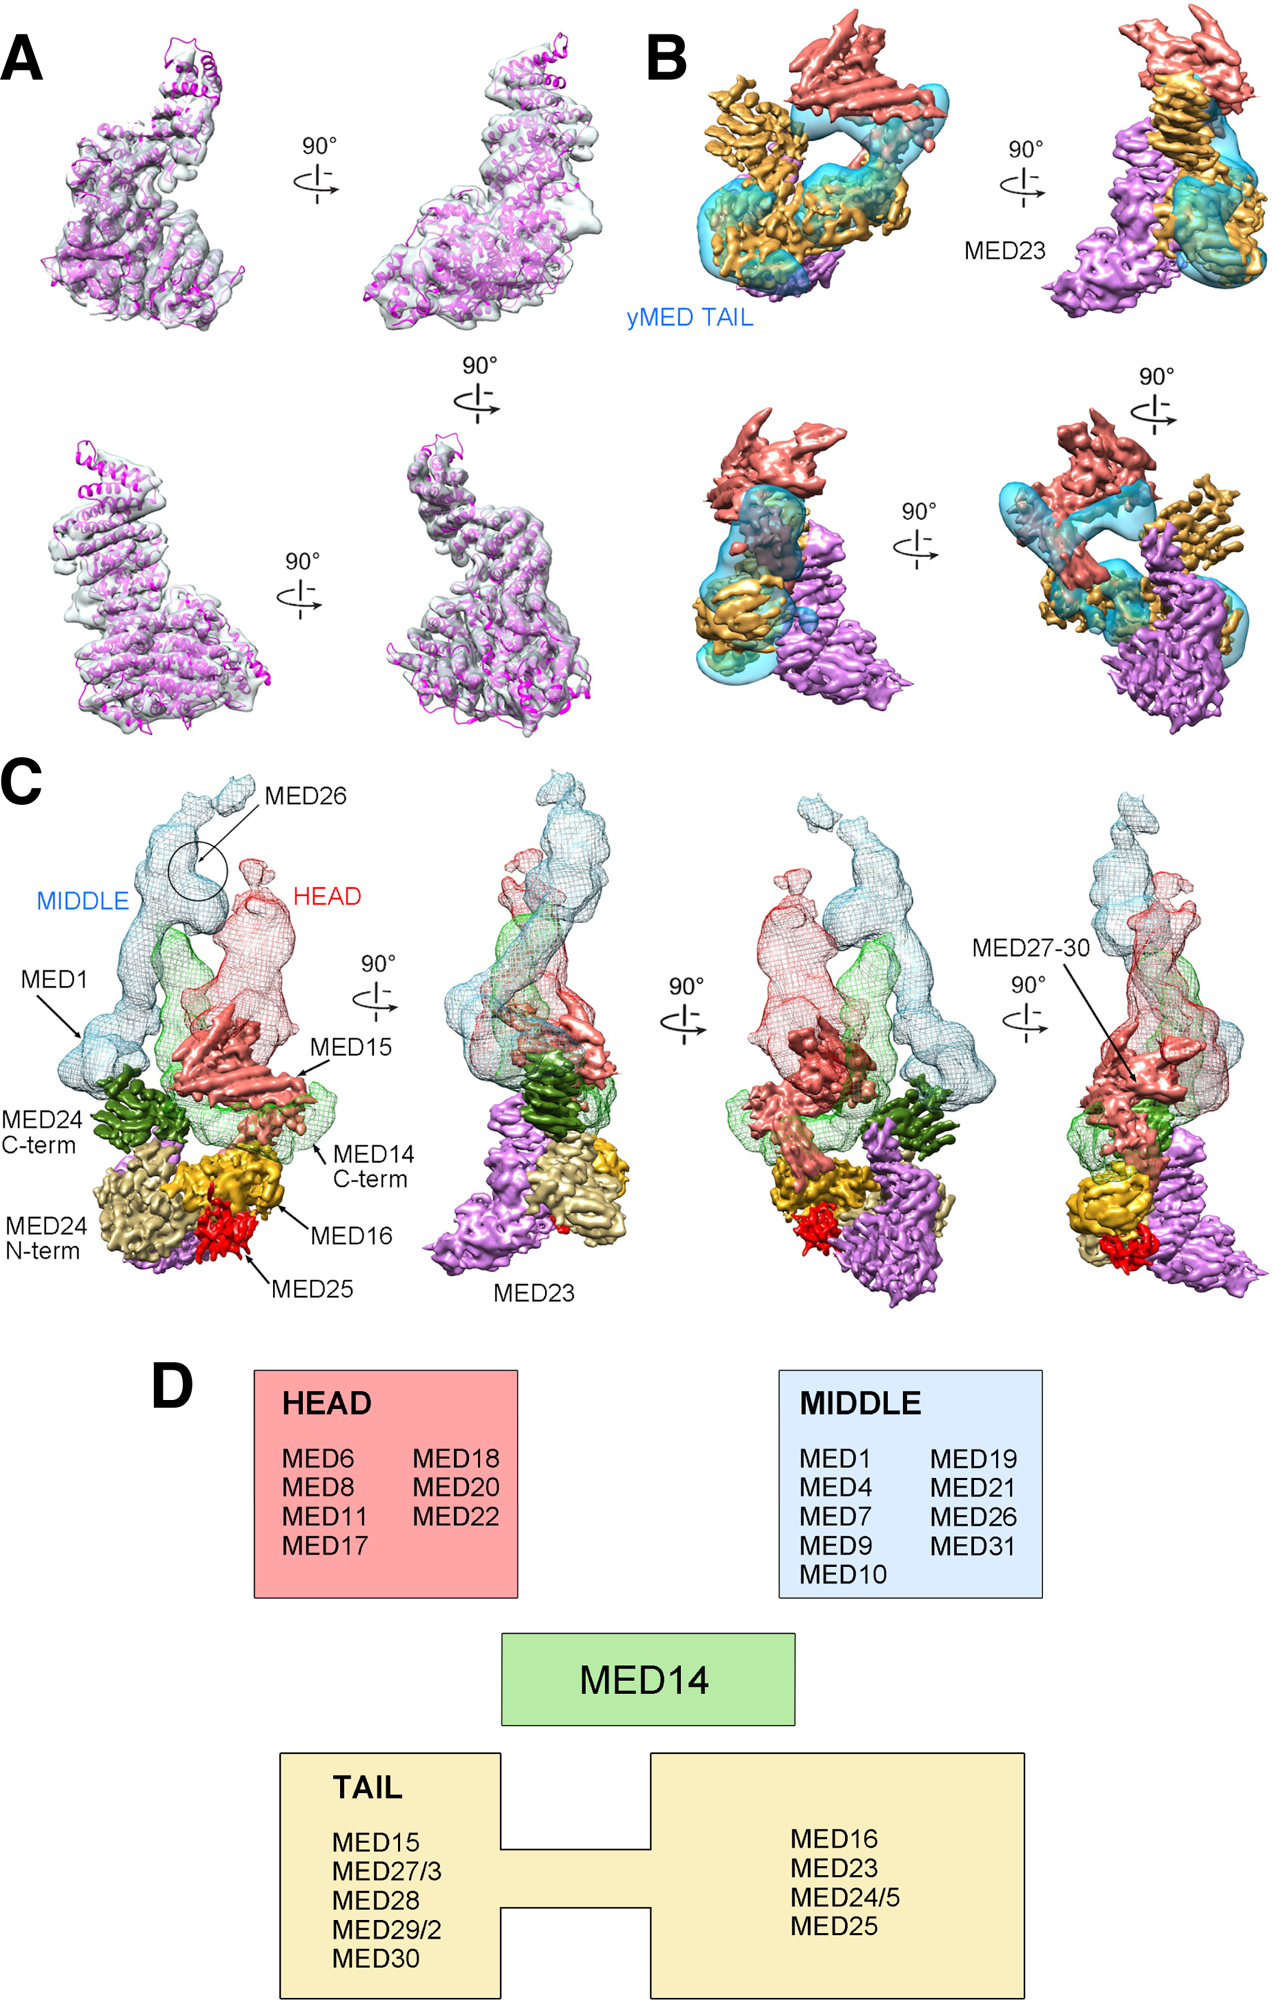
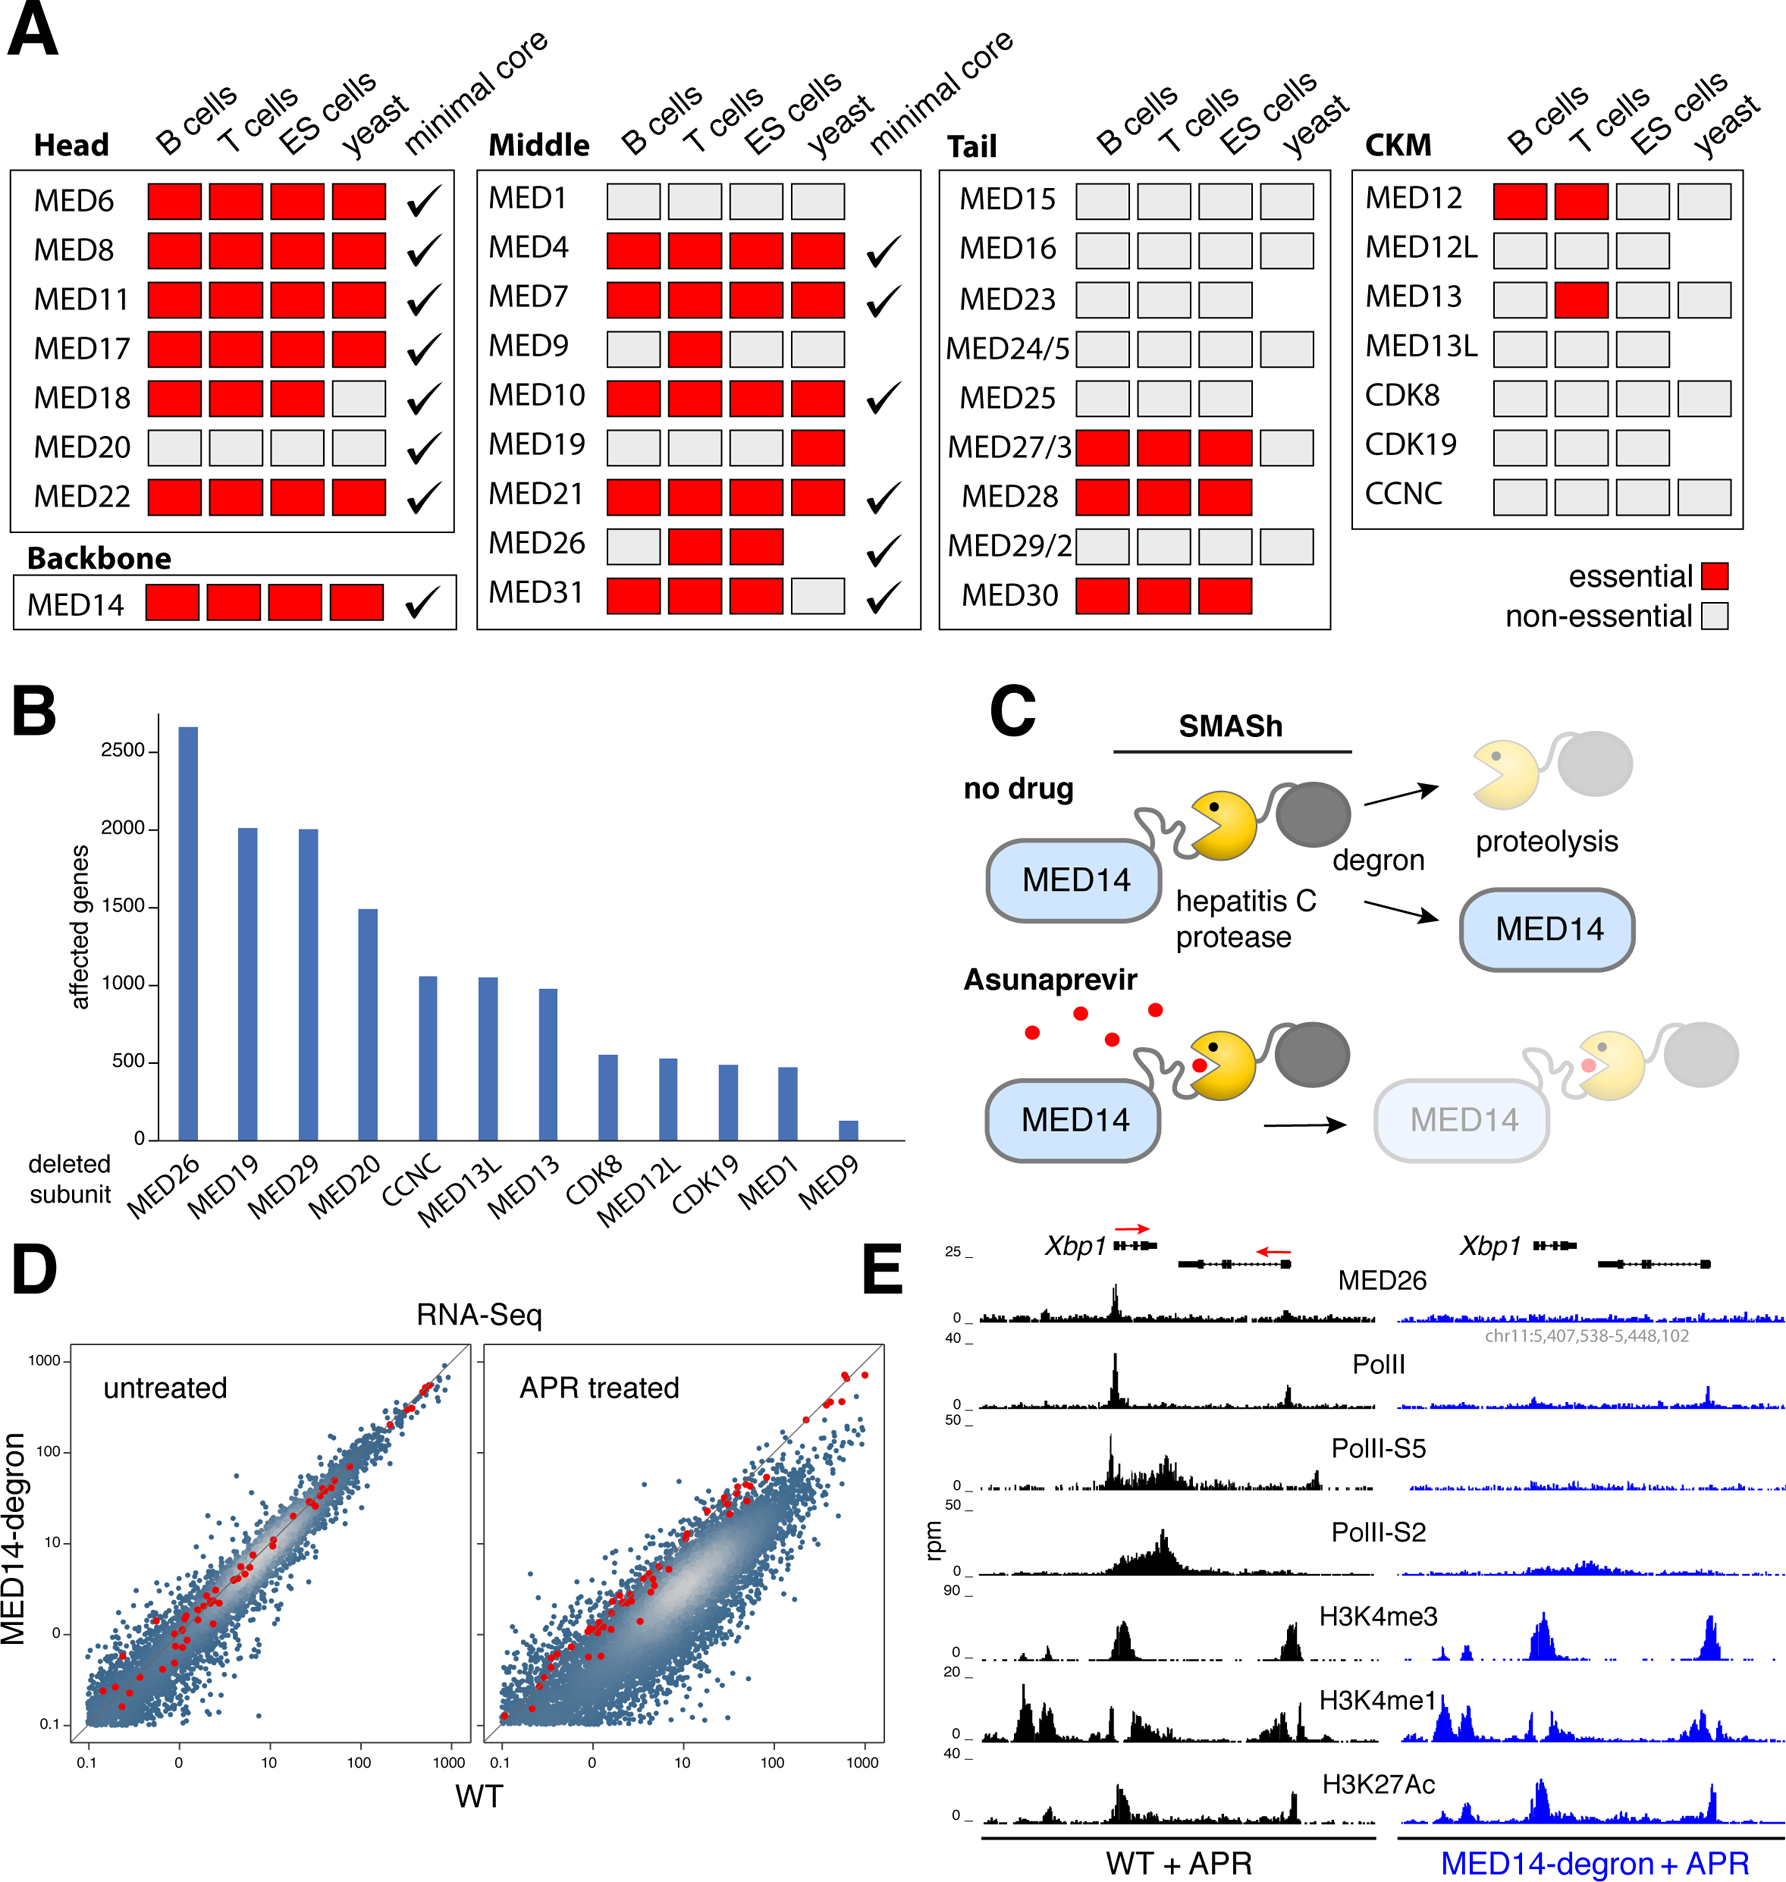
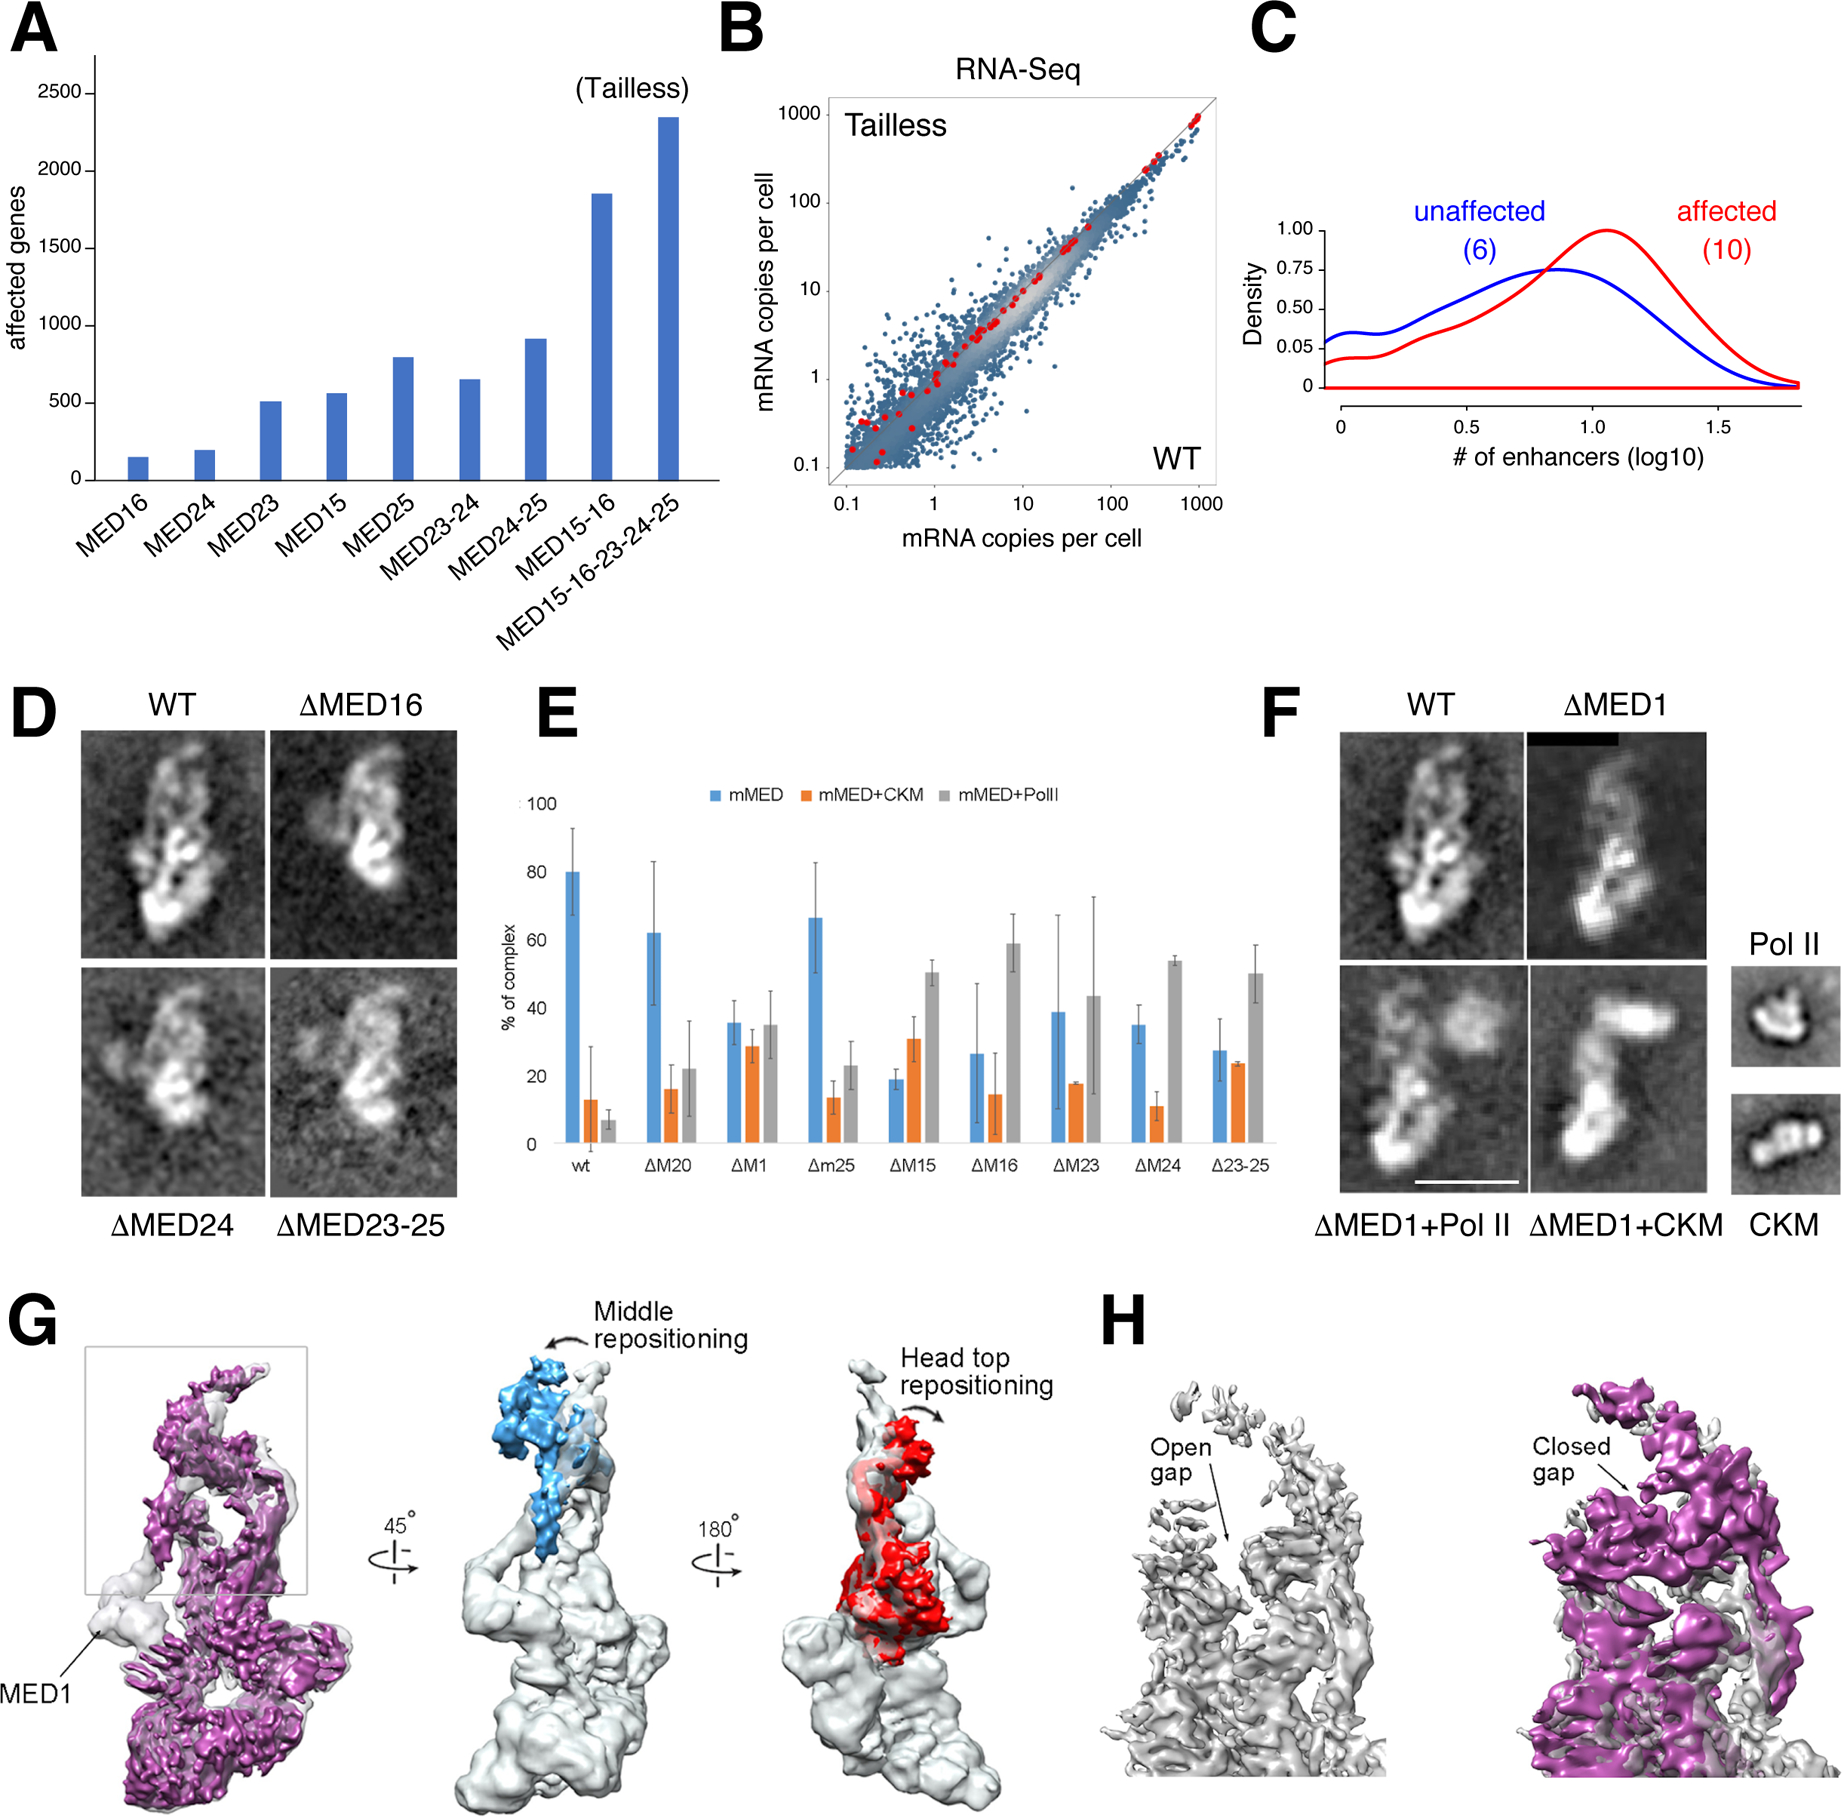
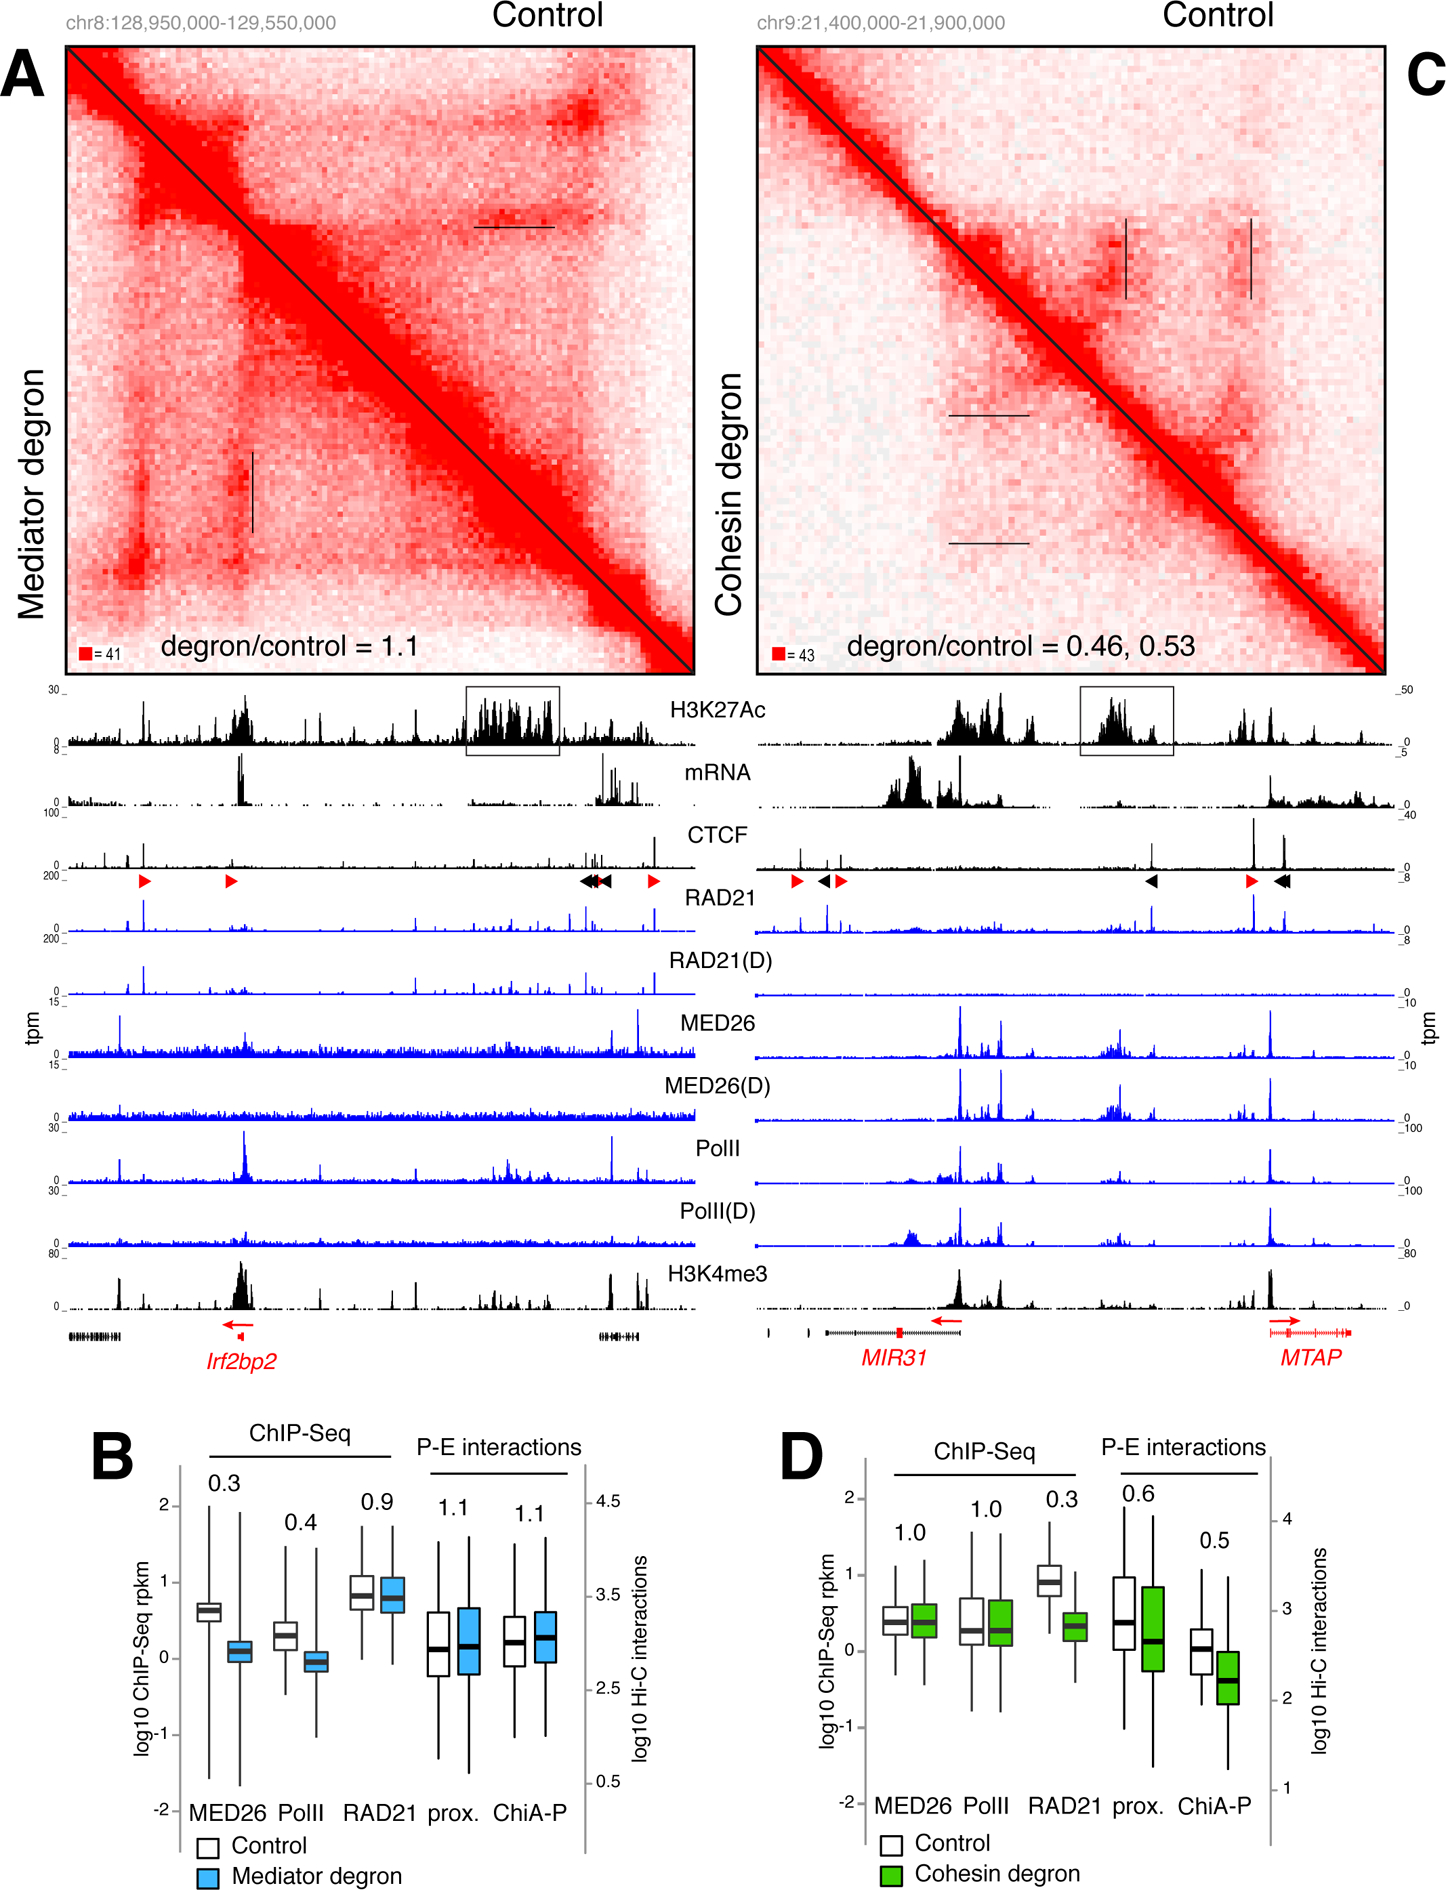
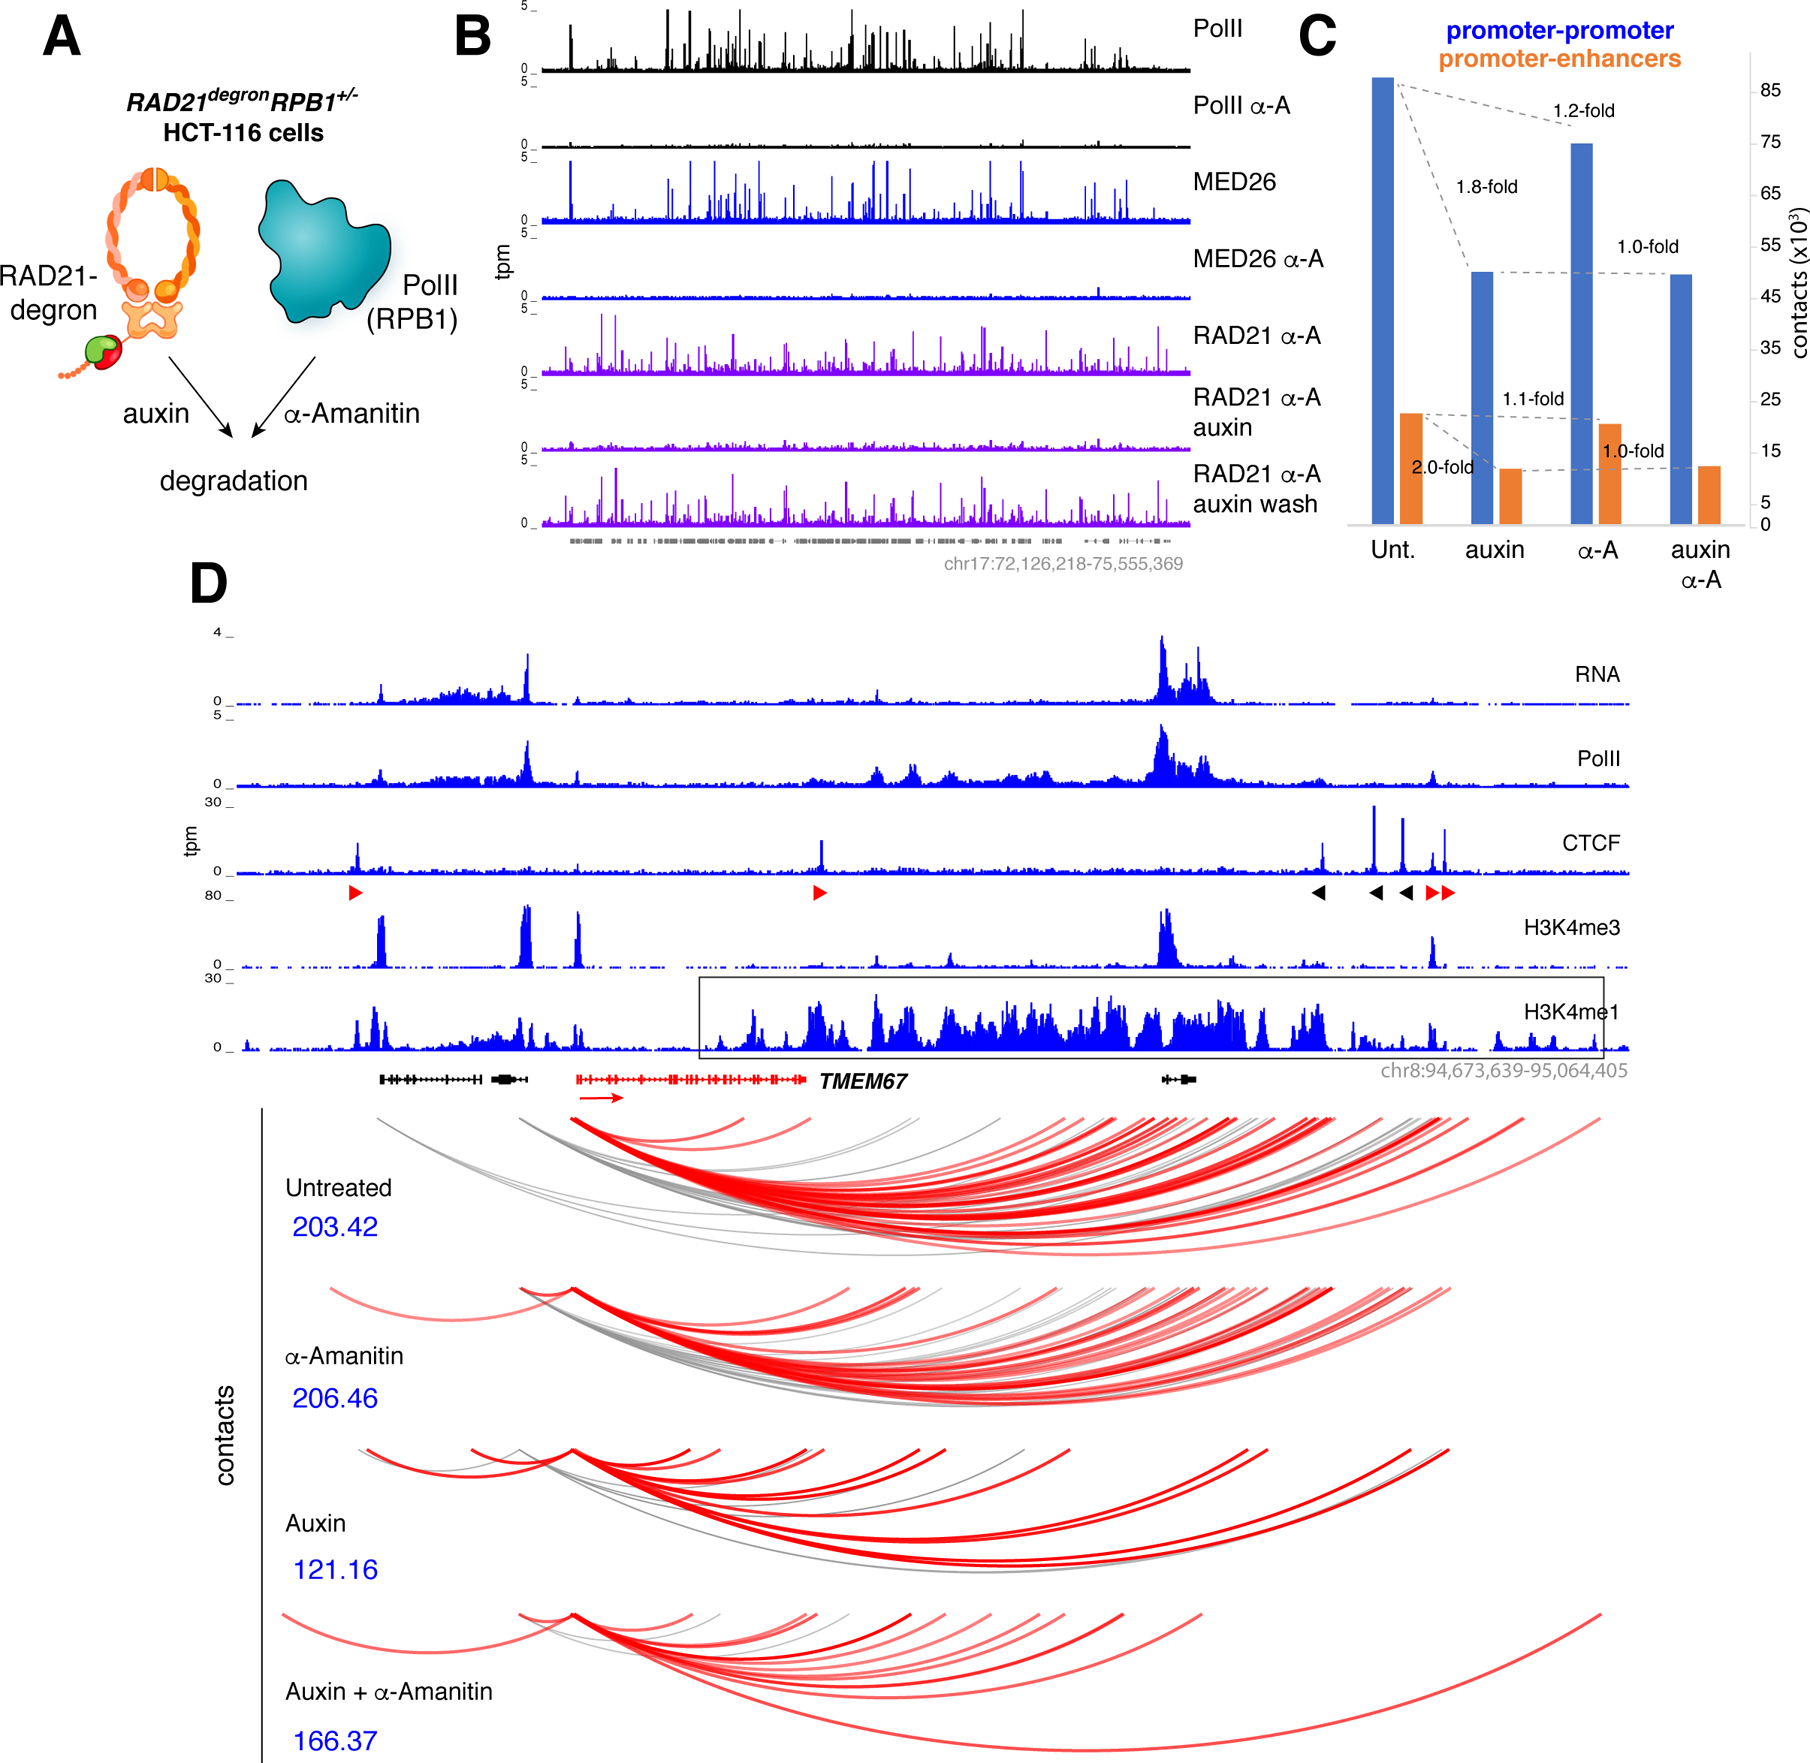
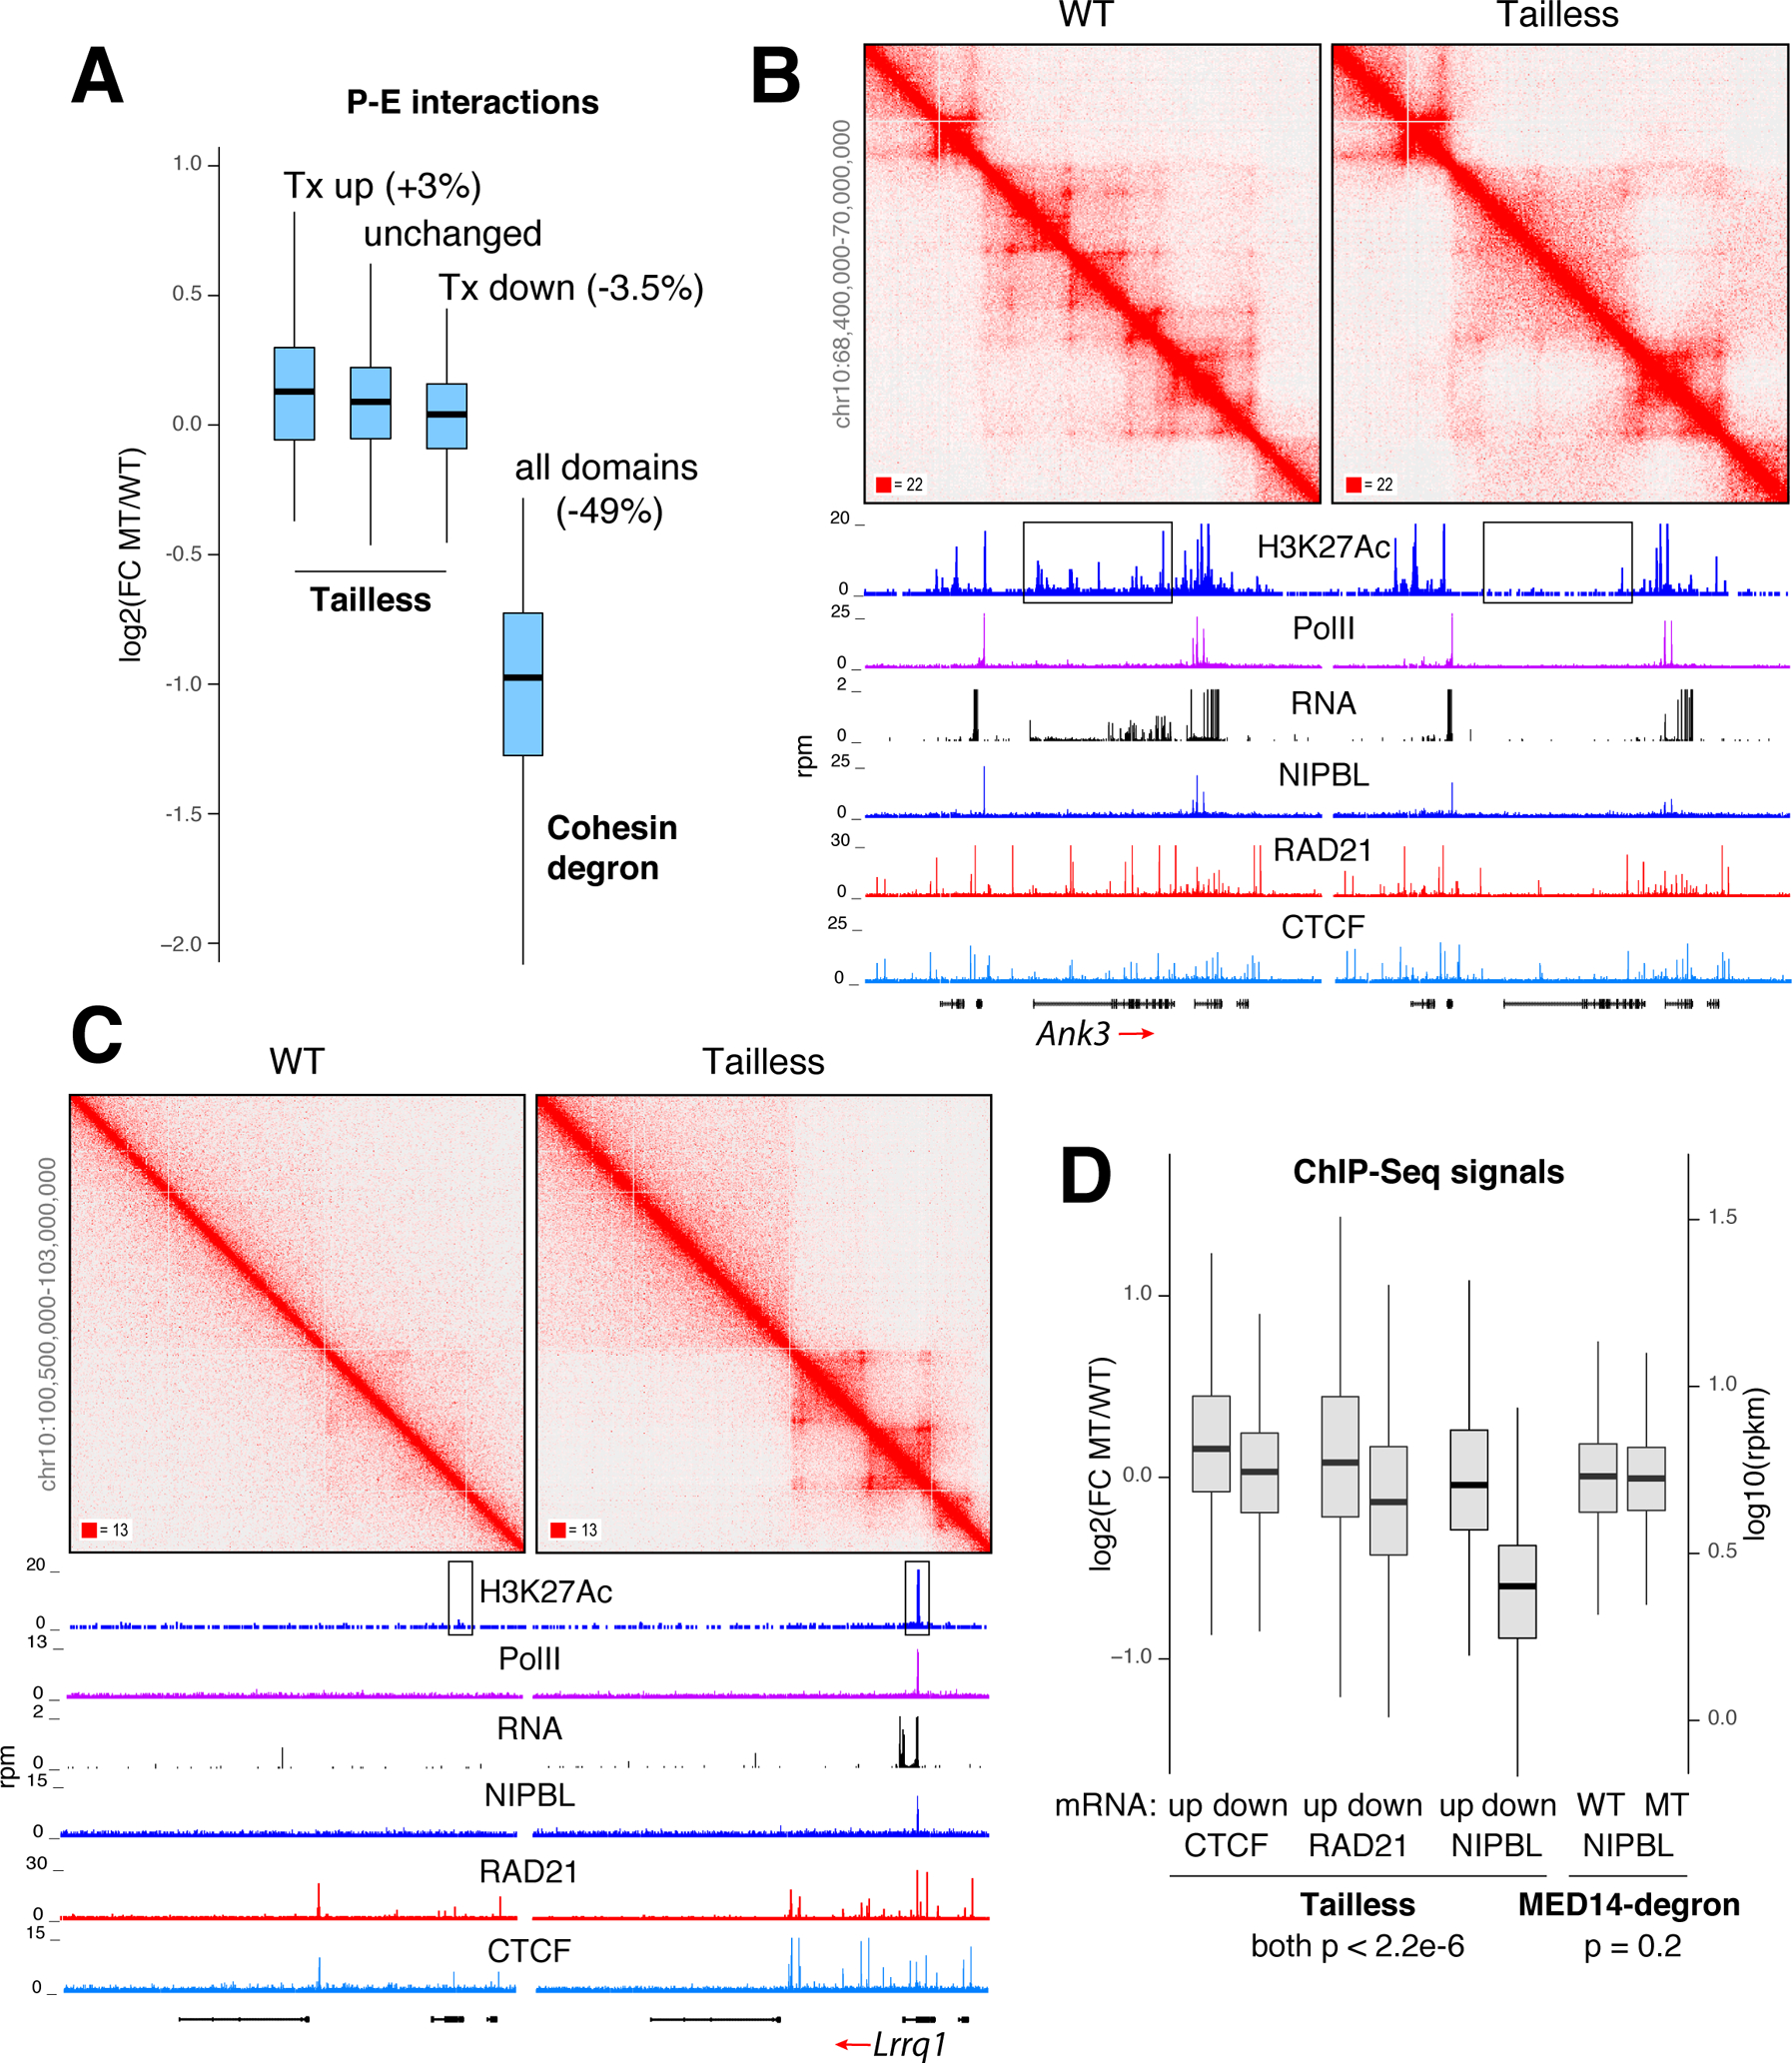
While Mediator plays a key role in eukaryotic transcription, little is known about its mechanism of action. This study combines CRISPR-Cas9 genetic screens, degron assays, Hi-C, and cryoelectron microscopy (cryo-EM) to dissect the function and structure of mammalian Mediator (mMED). Deletion analyses in B, T, and embryonic stem cells (ESC) identified a core of essential subunits required for Pol II recruitment genome-wide. Conversely, loss of non-essential subunits mostly affects promoters linked to multiple enhancers. Contrary to current models, however, mMED and Pol II are dispensable to physically tether regulatory DNA, a topological activity requiring architectural proteins. Cryo-EM analysis revealed a conserved core, with non-essential subunits increasing structural complexity of the tail module, a primary transcription factor target. Changes in tail structure markedly increase Pol II and kinase module interactions. We propose that Mediator's structural pliability enables it to integrate and transmit regulatory signals and act as a functional, rather than an architectural bridge, between promoters and enhancers.


Conflict of interest statement

DECLARATION OF INTERESTS

The authors declare no conflicts of interest.

Figures

Figure 1.
Figure 1.. mMED cryo-EM map and module organization.
(A) mMED cryo-EM map at 5.9Å resolution. (B) Comparison between mMED core (transparent gray) and the atomic model of Sp Mediator core (Head in red; Middle in blue, Med14 in green). (C) Views of mMED cryo-EM map segmented by modules (Head, Middle and MED14 colored as in (B) and Tail in light yellow).
Figure 2.
Figure 2.. mMED Tail structure, subunit organization and core interactions.
(A) Fit of the MED23 X-ray structure into the corresponding portion of mMED Tail cryo-EM map. (B) Comparison between cryo-EM maps of the mMED Tail (large segment in solid gold, small segment in solid salmon, and MED23 in transparent light purple) and the Sc Tail (transparent blue). (C) Subunit organization and interaction of the mMED Tail. The large Tail segment includes MED16 (gold), MED23 (light purple), MED24 (N-terminal portion in tan; C-terminal portion in dark green) and MED25 (red). The smaller Tail segment (in salmon) includes MED15, and MED27–30. The large Tail segment interacts (through the C-terminal portion of MED24) with MED1 in the Middle module (blue mesh) and with the C-terminus of MED14 (light green mesh). The smaller mMED Tail segment also interacts with the MED14 C-terminus and with the lower part of the Head (red mesh), including the MED18-MED20 Head jaws. The general position of MED26 from EM analysis of human Mediator is indicated. (D) Module assignment for mMED subunits based on EM analysis results. MED14, which functions as a central scaffolding subunit, was not assigned to a specific module.
Figure 3.
Figure 3.. mMED genetic and functional analysis.
(A) Genetic screen from mouse T, B and ES cells compared to yeast and the hMED minimal core. Essential subunits denoted with red boxes, non-essential with grey ones, minimal core subunits with checkmarks. (B) Bar graph shows the number of transcriptionally affected genes (>1.5 fold) in CH12 B cells deficient for non-essential (non-tail) mMED subunits. (C) Schematic showing MED14-degron strategy. A SMASh tag consisting of a linker, the hepatitis C protease, and a degron subunit was fused to MED14-N terminus. In untreated cells, the protease frees MED14 from SMASh, which is degraded. The hepatitis C protease inhibitor Asunaprevir blocks SMASh cleavage leading to MED14 degradation. (D) Transcriptome analysis of APR-treated Med14SMASh vs. control cells. Red dots represent mRNA spike-ins used to normalize signals on a per cell basis. (E) Med26, PolII, PolII-S5, PolII-S2, H3K4me3, H3K4me1, and H3K27Ac ChIP-Seq profiles at the Xbp1 locus in APR-treated WT (left) or Med14SMASh (right) cells. The orientation of genes is denoted with red arrows.
Figure 4.
Figure 4.. Tailless mutant and effect of MED1 and Tail subunit deletions on mMED interaction with PolII and CKM.
(A) Bar graph denotes transcriptionally affected genes (>1.5 fold) in Tail subunit KOs, including Tailless. (B) Scatter plot compares RNA-Seq from Tailless and WT controls. Red dots are spike-in controls. (C) Histogram showing the number of enhancers associated with affected (red) or unaffected (blue) promoters in Tailless. The median is shown in parenthesis. (D) 2D class averages of WT and single or multiple Tail subunit deletion mutants. Deletion of any subunit in the larger Tail segment (except MED23) results in loss of the entire segment. (E) Effect of MED1 and various Tail subunit deletions on mMED interaction with CKM and PolII. Error bars based on comparison of independent image clustering analyses. (F) 2D class averages calculated from images of ΔMED1, ΔMed1+PolII, and ΔMED1+CKM complexes. PolII and CKM class averages are included for comparison. Scale bar=20nm. (G) Comparison between cryo-EM maps of WT (MED19-FLAG; transparent gray) and ΔMED1 (solid magenta) cryo-EM maps at ~8Å resolution. Loss of MED1 in the ΔMED1 map breaks the connection between the Middle and Tail (leftmost panel) and results in large-scale changes in mMED conformation. The Middle module (blue) and the Head’s neck (red) move closer to each other. (H) Middle-Head repositioning results in closing of the CTD-binding gap (MED19-FLAG transparent gray, ΔMED1 purple; back view opposite to front view shown in leftmost panel).
Figure 5.
Figure 5.. P-E interactions are largely impervious to acute removal of Mediator and PolII but dependent on cohesin.
(A) Hi-C contact matrices for the Irf2bp2 locus in Mediator degron (lower left) vs. control WT cells (upper right). Irf2bp2 promoter-SE contacts are underlined in the matrices and the ratio of Hi-C signals between degron and control (1.1) are indicated. H3K27Ac, mRNA, CTCF, RAD21, MED26, PolII, and H3K4me3 ChIP-Seq tracks are shown and the SE is boxed. D = degron treatment. (B) Box plot comparing MED26, PolII, and RAD21 signals in control (empty) or Mediator degron (blue) cells. Comparison of P-E interactions as determined by enhancer proximity (left) or ChIA-PET (right) are shown. (C) Same analysis as in A for the MIR31 locus in HCT116 RAD21 degron and controls cells. Hi-C signal ratio for MIR32 and MTAP promoters are 0.45 and 0.53 respectively. (D) Same analyses as in B for HCT-116 cells. For B and D data are represented as mean +/− SEM.
Figure 6.
Figure 6.. Analysis of Mediator-PolII degron.
(A) RAD21degronRPB1+/− cells were created by deleting one allele of RPB1 from HCT116 RAD21degron cells to make them highly susceptible to PolII degradation by α-Amanitin. (B) RAD21degronRPB1+/− cells were untreated or treated for 3h with α-Amanitin, 6h with Auxin, or with a combination of Auxin and α-Amanitin and examined for PolII, MED26, or RAD21 occupancy. Auxin-washed cells led to RAD21 recovery in the presence of α-Amanitin (last row). (C) Bar graph showing the total number of reproducible P-P contacts (blue bars) or P-E contacts (orange bars) in RAD21degronRPB1+/− cells that were either untreated or treated with Auxin, α-Amanitin, or both. (D) Representative example of promoter contacts for TMEM67 in RAD21degronRPB1+/− cells grown under the conditions indicated. Scores in blue denote the significance of the interactions and the interacting enhancer domain is boxed.
Figure 7.
Figure 7.. The impact of Mediator Tail deletion on promoter-enhancer interactions.
(A) Box plot showing changes in promoter-enhancer interactions at loop domains where transcription is increased, unchanged, or decreased in Tailless cells. For comparison, global changes in P-E interactions in cohesin-degron cells relative to control are shown. (B) Example of loop domains lost in Tailless. Profiles of H3K27Ac, PolII, RNA, NIPBL, RAD21 and CTCF occupancy are shown. Enhancer area is boxed. (C) Example of gained loop domains. (D) Box plot showing changes in CTCF, RAD21, and NIPBL recruitment at loop domains showing an increase or decrease in transcription in Tailless. NIPBL signals in Mediator-degron and control are shown for comparison. For A and D data are represented as mean +/− SEM.

Comment in

References

    1. Alexander JM, Guan J, Huang B, Lomvardas S, and Weiner OD (2018). Live-Cell Imaging Reveals Enhancer-dependent Sox2 Transcription in the Absence of Enhancer Proximity. bioRxiv. - PMC - PubMed
    1. Allen BL, and Taatjes DJ (2015). The Mediator complex: a central integrator of transcription. Nat Rev Mol Cell Biol 16, 155–166. - PMC - PubMed
    1. Aranda-Orgilles B, Saldana-Meyer R, Wang E, Trompouki E, Fassl A, Lau S, Mullenders J, Rocha PP, Raviram R, Guillamot M, et al. (2016). MED12 Regulates HSC-Specific Enhancers Independently of Mediator Kinase Activity to Control Hematopoiesis. Cell stem cell 19, 784–799. - PMC - PubMed
    1. Asturias FJ, Jiang YW, Myers LC, Gustafsson CM, and Kornberg RD (1999). Conserved structures of mediator and RNA polymerase II holoenzyme. Science 283, 985–987. - PubMed
    1. Benabdallah NS, and Bickmore WA (2015). Regulatory Domains and Their Mechanisms. Cold Spring Harb Symp Quant Biol 80, 45–51. - PubMed

Publication types

MeSH terms