. 2019 Aug 22;178(5):1132-1144.e10.
doi: 10.1016/j.cell.2019.07.001. Epub 2019 Aug 8.

Molecular Strategies of Meiotic Cheating by Selfish Centromeres

Affiliations

Molecular Strategies of Meiotic Cheating by Selfish Centromeres

Takashi Akera et al. Cell. .

Abstract

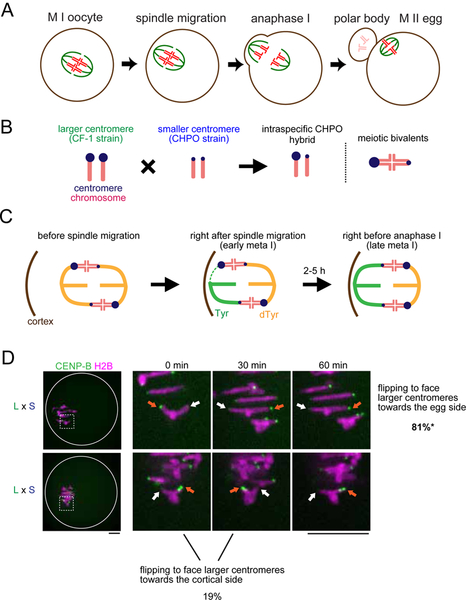
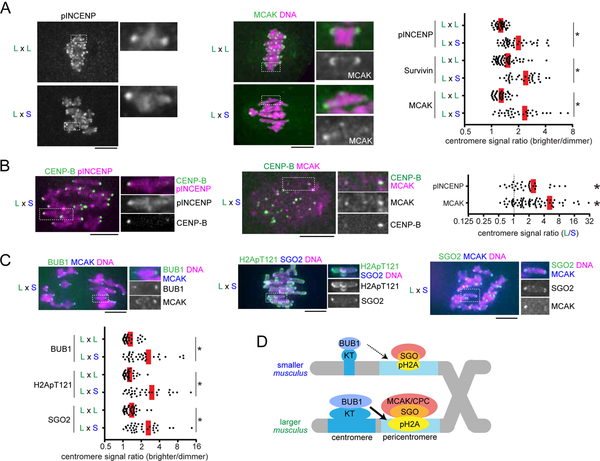
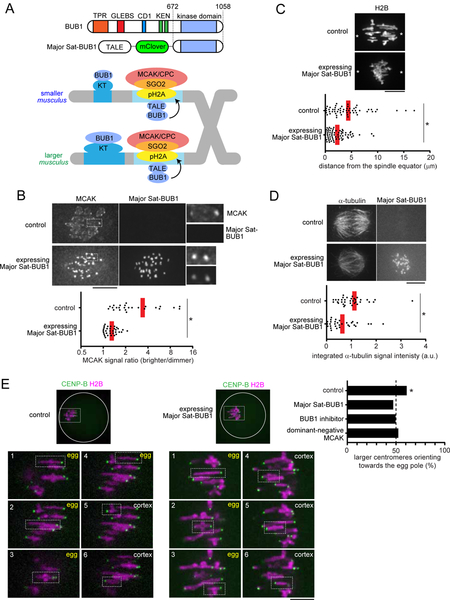
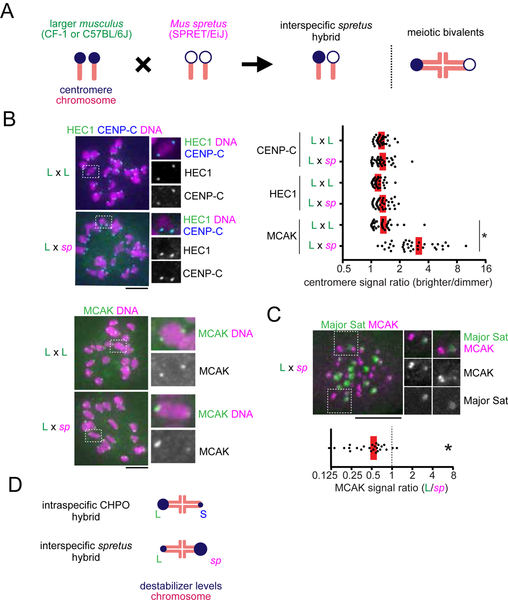
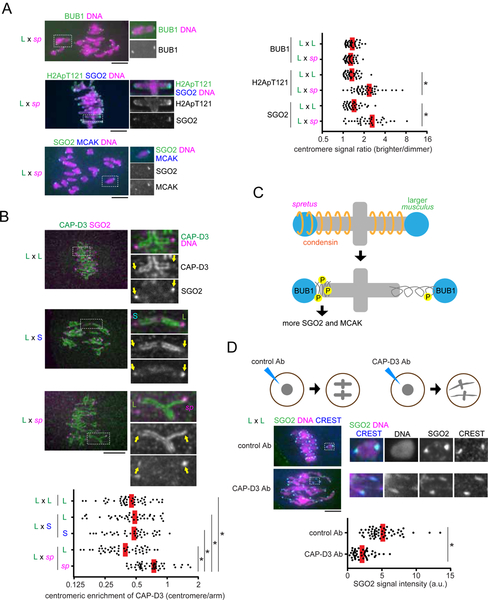
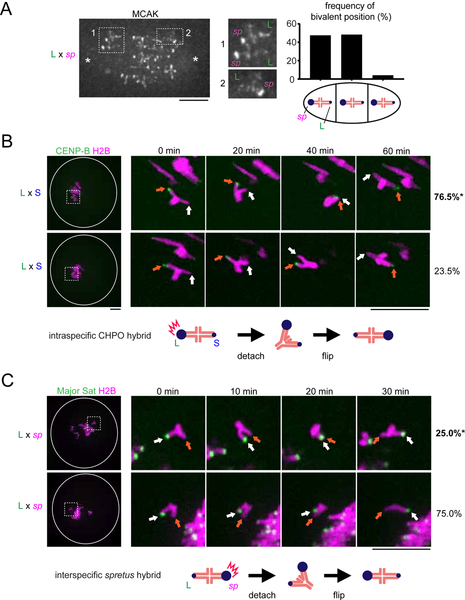
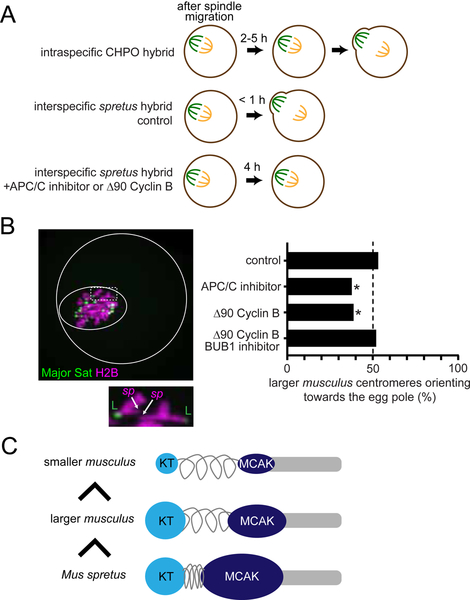
Asymmetric division in female meiosis creates selective pressure favoring selfish centromeres that bias their transmission to the egg. This centromere drive can explain the paradoxical rapid evolution of both centromere DNA and centromere-binding proteins despite conserved centromere function. Here, we define a molecular pathway linking expanded centromeres to histone phosphorylation and recruitment of microtubule destabilizing factors, leading to detachment of selfish centromeres from spindle microtubules that would direct them to the polar body. Exploiting centromere divergence between species, we show that selfish centromeres in two hybrid mouse models use the same molecular pathway but modulate it differently to enrich destabilizing factors. Our results indicate that increasing microtubule destabilizing activity is a general strategy for drive in both models, but centromeres have evolved distinct mechanisms to increase that activity. Furthermore, we show that drive depends on slowing meiotic progression, suggesting that selfish centromeres can be suppressed by regulating meiotic timing.

Keywords: centromere; chromosome segregation; meiosis; meiotic drive; mouse; oocyte.


Conflict of interest statement

DECLARATION OF INTERESTS

The authors declare no competing interests.

Figures

Figure 1.
Figure 1.. Biased flipping underlies the biased orientation of selfish centromeres towards the egg pole.
(A) Schematic of female meiosis. The meiosis I (MI) spindle initially forms in the center of the oocyte and later migrates towards the cortex and orients perpendicular to the cortex, followed by the highly asymmetric cell division. Selfish elements cheat by preferentially orienting to the egg side of the spindle. (B) Schematic of the intraspecific CHPO hybrid system for centromere drive. A Mus musculus strain with larger (L) centromeres, CF-1, is crossed to a strain with smaller (S) centromeres, CHPO. In the hybrid offspring, chromosomes with larger and smaller centromeres are paired in meiotic bivalents. (C) Schematic showing spindle asymmetry and biased orientation of larger centromeres in the intraspecific CHPO hybrid, based on previous results (Akera et al., 2017). Initial MT attachments are established when the spindle is still in the center and symmetric. Hybrid bivalents are off-center on the spindle, with the larger centromere closer to the pole, indicating that larger and smaller centromeres interact differentially with spindle MTs. Bivalent orientation on the spindle is unbiased right after spindle migration (early meta I), but the attachment of larger centromeres to the cortical side of the spindle is especially unstable, leading to detachment and flipping to establish biased orientation (late meta I). (D) CF-1 x CHPO (L x S) hybrid oocytes expressing CENP-B-mCherry and H2B-EGFP were imaged live after spindle migration. Time-lapse images show examples of flipping events to face larger centromeres towards the egg (top) or cortical (bottom, 0 – 30 min) side. Images are maximum intensity z-projections showing all chromosomes (left), or optical slices magnified to show flipping events (timelapse). Orange and white arrows indicate larger and smaller centromeres, respectively. Scale bar, 10 μm. Percentages indicate the frequency of each case (n = 21 flipping events from 48 cells). *P < 0.05, indicating significant deviation from 50%. Two out of four flipping events that faced larger centromeres towards the cortical side were subsequently reversed (bottom, 30 – 60 min), demonstrating the difficulty for larger centromeres to remain attached to the cortical side.
Figure 2.
Figure 2.. Selfish centromeres enrich more MT-destabilizing factors through the BUB1 pathway.
(A and C) CF-1 x CHPO (L x S) hybrid oocytes, or CF-1 x CF-1 (L x L) as controls, were fixed at metaphase I and stained for phosphorylated INCENP, Survivin, MCAK, BUB1, H2ApT121, or SGO2. Graph shows centromere signal ratios, calculated as the brighter divided by the dimmer signal for each bivalent (n > 32 for each condition); red line, mean; *P < 0.001. (B) CF-1 x CHPO hybrid oocytes expressing CENP-B-EGFP were stained for pINCENP or MCAK. Graph shows centromere signal ratios, calculated as the CF-1 centromere divided by the CHPO centromere signal for each bivalent. Each dot represents a single bivalent (n > 31 for each condition); red line, mean; *P < 0.001, indicating significant deviation from 1. Images (A-C) are maximum intensity z-projections showing all chromosomes (left), or optical slices magnified to show single bivalents (right); scale bars, 10 μm. (D) Model of the amplified BUB1 pathway in larger centromeres compared to smaller centromeres in the intraspecific CHPO hybrid.
Figure 3.
Figure 3.. Asymmetry in MT destabilizing activity is essential for centromere drive.
(A) Schematic of the strategy to equalize MT-destabilizing activity between larger and smaller centromeres by targeting BUB1 to major satellite; TPR, tetratricopeptide repeat domain; GLEBS, BUB3 binding domain; CD1, conserved domain 1;KEN, KEN box (Vleugel et al., 2015). (B) CF-1 x CHPO (L x S) oocytes expressing a TALE targeting major satellite fused to the fluorescent protein mClover and to BUB1 lacking the N-terminal kinetochore-targeting domain (Major Sat-BUB1). Cells were fixed at metaphase I and stained for MCAK. Graph shows centromere signal ratios, calculated as the brighter divided by the dimmer signal for each bivalent. Each dot represents a single bivalent (n > 25 for each condition); red line, mean. (C) CF-1 x CHPO oocytes expressing Major Sat-BUB1 and H2B-EGFP were imaged live at metaphase I. Asterisks indicate the position of spindle poles determined by differential interference contrast imaging. Graph shows the distance between the spindle equator and the crossover position of each bivalent (n > 60 bivalents for each condition). (D) CF-1 x CF-1 oocytes expressing Major Sat-BUB1 were analyzed for cold-stable MTs at metaphase I. Graph shows integrated α-tubulin signal intensity in the spindle (n > 32 spindles for each condition). (E) CF-1 x CHPO oocytes expressing CENP-B-mCherry and H2B-EGFP were imaged live shortly before anaphase I onset (within 30 min). Oocytes also expressed Major Sat-BUB1 or a dominant-negative MCAK mutant, RAMFLhyp, or were treated with a BUB1 inhibitor, BAY-1816032, as indicated. The fraction of bivalents with the larger centromere oriented towards the egg pole was quantified; n = 272 bivalents for control, 110 for Major Sat-BUB1, 115 for BAY-1816032, and 126 for RAMFLhyp. Images show the most common configuration for conditions with or without biased orientation (control or Major Sat-BUB1), with each of the six bivalents labeled to indicate the orientation of the larger centromere towards the egg or cortex. Images (B-E) are maximum intensity z-projections or optical slices magnified to show single bivalents. *P < 0.005, indicating significant deviation from 50% in (E).
Figure 4.
Figure 4.. Centromeres in an interspecific hybrid exhibit asymmetry in destabilizers but not in kinetochore size.
(A) Schematic of the interspecific spretus hybrid system. A Mus musculus strain with larger centromeres (L, CF-1 or C57BL/6J) is crossed to a Mus spretus strain (sp, SPRET/EiJ). In the hybrid offspring, chromosomes with musculus and spretus centromeres are paired in meiotic bivalents. (B) C57BL/6J x SPRET/EiJ (L x sp) hybrid oocytes, or C57BL/6J x C57BL/6J (L x L) as controls, were fixed at metaphase I and stained for the indicated centromere proteins. Graph shows centromere signal ratios, calculated as the brighter divided by the dimmer signal for each bivalent (n > 36 bivalents for each condition). (C) C57BL/6J x SPRET/EiJ (L x sp) oocytes expressing Major Sat. TALE-mClover were stained for MCAK. Graph shows centromere signal ratios, calculated as the C57BL/6J centromere divided by the spretus centromere signal for each bivalent (n = 24 bivalents). Images (B, C) are maximum intensity z-projections showing all chromosomes (left), or optical slices magnified to show single bivalents (right); scale bars, 10 μm. In the graphs, each dot represents a single bivalent; red line, mean; *P < 0.001, indicating significant deviation from 1 in (C). (D) Schematic of relative MT destabilizer levels in both intraspecific and interspecific hybrid models.
Figure 5.
Figure 5.. Condensin governs the asymmetry in MT-destabilizing factors in the interspecific spretus hybrid.
(A) C57BL/6J x SPRET/EiJ (L x sp) hybrid oocytes, or C57BL/6J x C57BL/6J (L x L) as controls, were fixed at metaphase I and stained for BUB1, H2ApT121, or SGO2. Graph shows centromere signal ratios, calculated as the brighter divided by the dimmer signal for each bivalent. Each dot represents a single bivalent (n > 36 for each condition). (B) C57BL/6J x SPRET/EiJ (L x sp) hybrid oocytes, or CF-1 x CHPO (L x S) and CF-1 x CF-1 (L x L) as controls, were fixed at metaphase I and stained for CAP-D3 and SGO2. Graph shows centromeric enrichment of CAP-D3, calculated as the centromeric signal divided by the chromosome arm signal for each half-bivalent. Each dot represents a single centromere (n > 40 for each condition). (C) Model for how SGO2 and MCAK recruitment depends on condensin in the spretus hybrid. (D) CF-1 x CF-1 (L x L) oocytes microinjected with control IgG or anti-CAP-D3 antibody were fixed at metaphase I and stained for SGO2 and CREST. Graph shows centromeric SGO2 signal intensity. Each dot represents a single centromere (n > 46 for each condition). Images (A, B, D) are maximum intensity z-projections showing all chromosomes (left), or optical slices magnified to show single bivalents (right); red line, mean; *P < 0.001; scale bars, 10 μm.
Figure 6.
Figure 6.. Relative MCAK levels on centromeres predict their destabilizing activity.
(A) C57BL/6J x SPRET/EiJ (L x sp) oocytes were fixed at metaphase I and stained for MCAK. Images are maximum intensity z-projections showing all chromosomes or optical slices magnified to show two bivalents closer to the left pole (1) or a single bivalent closer to the right pole (2). Schematic shows bivalent positions as equidistant between the two poles (middle) or off-center with either the spretus centromere or the larger musculus centromere closer to the pole. The frequency of each case is plotted (n = 120 bivalents). (B) CF-1 x CHPO (L x S) oocytes expressing CENP-B-mCherry and H2B-EGFP were imaged live. Time-lapse images show examples of flipping events, which were analyzed to determine the frequency of either the larger (orange arrows) or smaller (white arrows) musculus centromere moving first to initiate flipping (top and bottom panels respectively). Percentages on the right indicate frequency of each case (n = 45 flipping events from 61 cells). (C) CF-1 x SPRET/EiJ and C57BL/6J x SPRET/EiJ (L x sp) oocytes expressing Major Sat. TALE-mClover and H2B-mCherry were imaged live and analyzed to determine whether the larger musculus (white arrows) or spretus (orange arrows) centromere initiates flipping (top and bottom panels respectively) (n = 27 flipping events from 20 cells). Images (B, C) are maximum intensity z-projections showing all chromosomes (left), or optical slices magnified to show flipping events (timelapse). White circle indicates the cell outline. Schematics show the more frequent flipping events, with relative MCAK levels indicated by the size of the blue circle. Scale bars, 10 μm; *P < 0.05, indicating significant deviation from 50%.
Figure 7.
Figure 7.. Relative MT-destabilizing activity determines the direction of centromere drive.
(A) Schematics of meiotic progression. Expression of non-degradable Δ90 Cyclin B or treatment with ProTAME, an APC/C inhibitor, delays anaphase I onset in the spretus hybrid to at least 4 hours, comparable to the CHPO hybrid. (B) CF-1 x SPRET/EiJ and C57BL/6J x SPRET/EiJ oocytes expressing Major Sat. TALE-mClover and H2B-mCherry were imaged live either shortly before anaphase I (control) or 2–4 hours after spindle migration. Oocytes also expressed Δ90 Cyclin B or were treated with ProTAME or the BUB1 inhibitor BAY-1816032 as indicated. Images are a maximum intensity z-projection of the whole oocyte (top) and an optical slice magnified to show two bivalents (bottom). Solid and dashed white circles indicate the outline of the cell and the spindle, respectively. Graph shows the fraction of bivalents with the larger musculus centromere oriented towards the egg pole; n = 295 bivalents for control, 135 for ProTAME, 134 for Δ90 Cyclin B, and 150 for Δ90 Cyclin B + BAY-1816032. *P < 0.01, indicating significant deviation from 50%. Scale bars, 10 μm. (C) Schematic showing that the direction of centromere drive correlates with MT-destabilizer levels. Musculus centromeres enrich destabilizing activity by increasing kinetochore size, whereas spretus centromeres do so by modulating centromere geometry.

Comment in

References

    1. Akera T, Chmátal L, Trimm E, Yang K, Aonbangkhen C, Chenoweth DM, Janke C, Schultz RM, and Lampson MA (2017). Spindle asymmetry drives non-Mendelian chromosome segregation. Science 358, 668–672. - PMC - PubMed
    1. Almonacid M, Terret M-E, and Verlhac M-H (2014). Actin-based spindle positioning: new insights from female gametes. J. Cell Sci. 127, 477–483. - PubMed
    1. Azoury J, Lee KW, Georget V, Hikal P, and Verlhac M-H (2011). Symmetry breaking in mouse oocytes requires transient F-actin meshwork destabilization. Development 138, 2903–2908. - PubMed
    1. Beck EA, and Llopart A (2015). Widespread Positive Selection Drives Differentiation of Centromeric Proteins in the Drosophila melanogaster subgroup. Sci. Rep 5, 17197. - PMC - PubMed
    1. Bint SM, Ogilvie CM, Flinter FA, Khalaf Y, and Scriven PN (2011). Meiotic segregation of Robertsonian translocations ascertained in cleavage-stage embryos--implications for preimplantation genetic diagnosis. Hum. Reprod 26, 1575–1584. - PubMed

Publication types

Substances