. 2019 Sep 17;51(3):479-490.e6.
doi: 10.1016/j.immuni.2019.06.016. Epub 2019 Aug 8.

MicroRNA-142 Is Critical for the Homeostasis and Function of Type 1 Innate Lymphoid Cells

Affiliations

MicroRNA-142 Is Critical for the Homeostasis and Function of Type 1 Innate Lymphoid Cells

Melissa M Berrien-Elliott et al. Immunity. .

Abstract

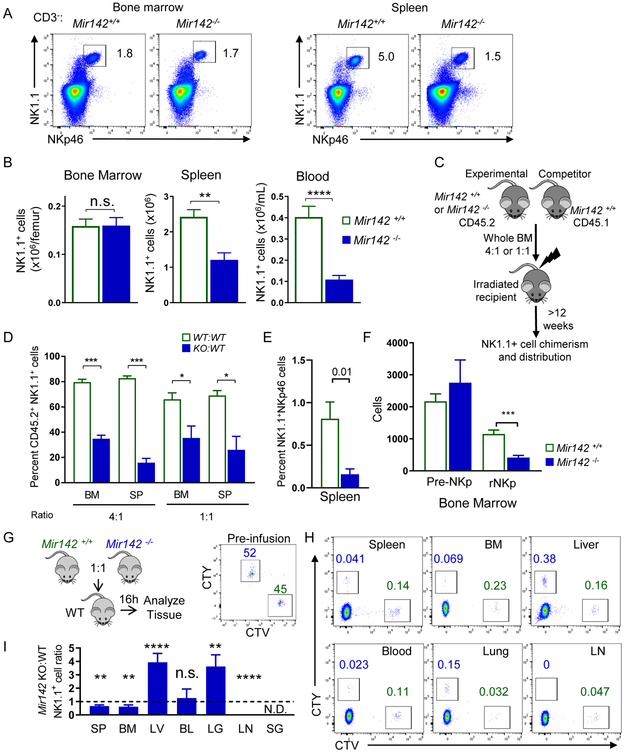
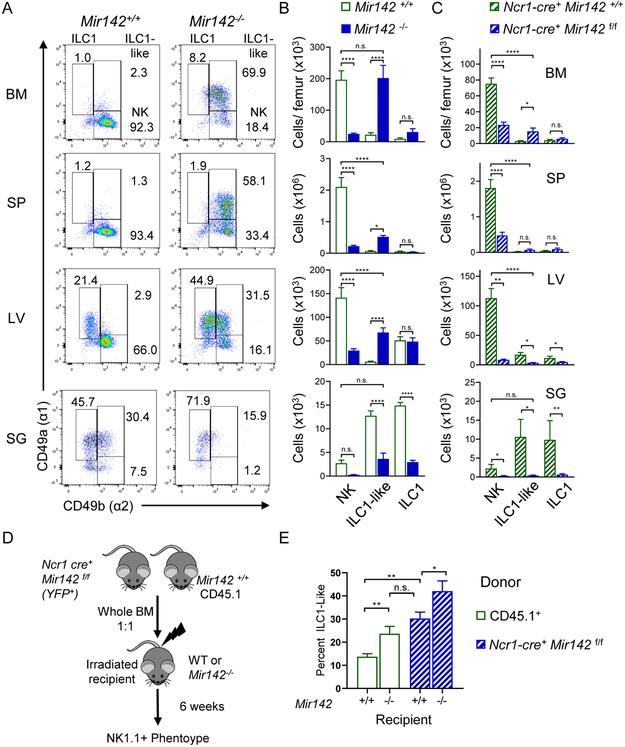
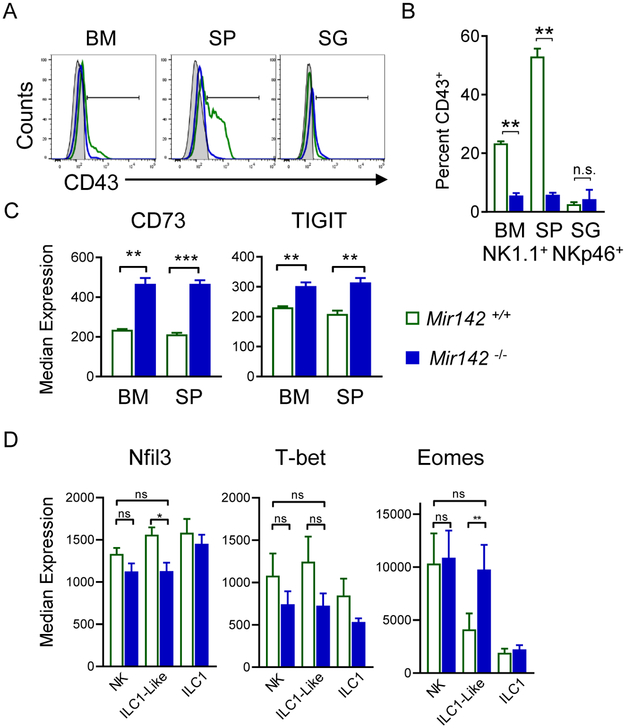
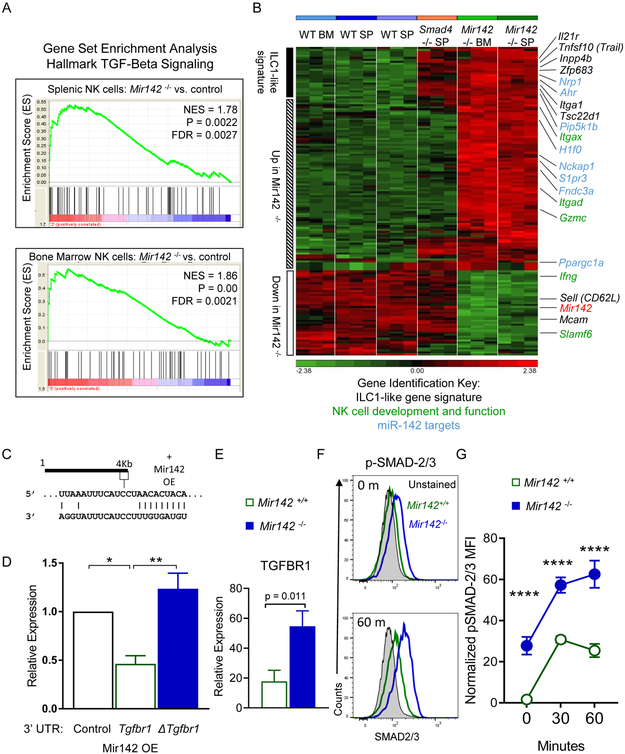
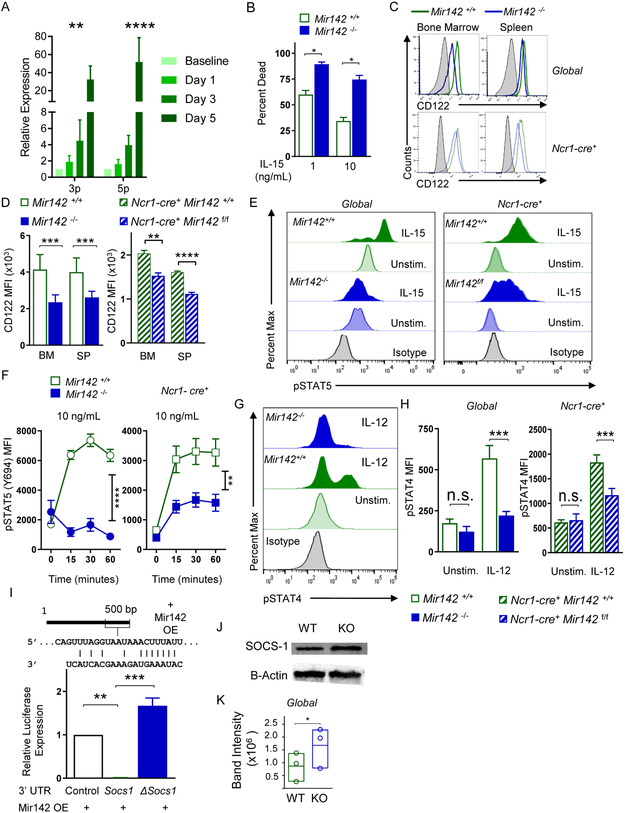
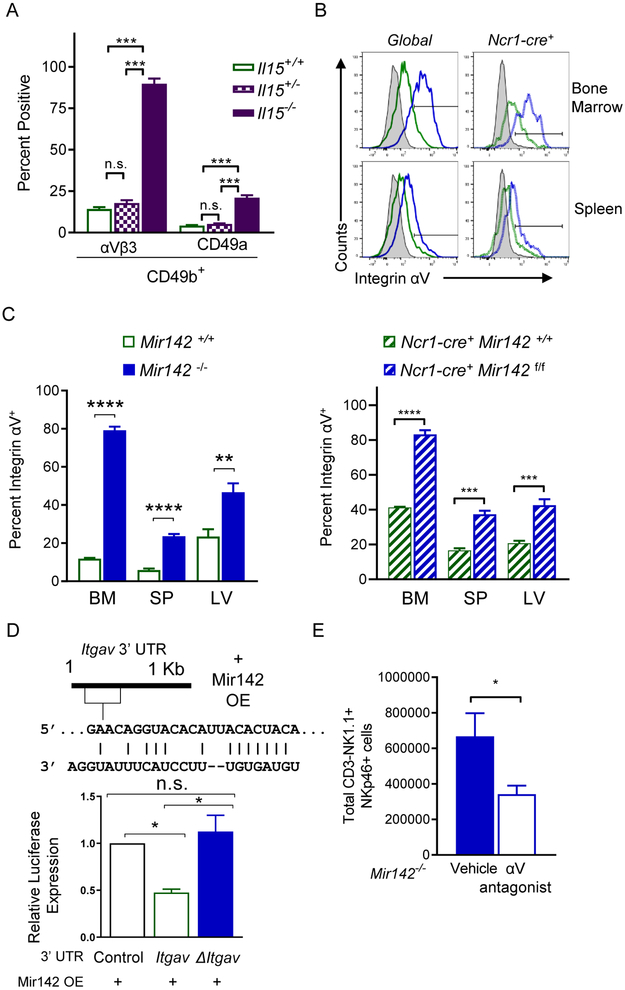
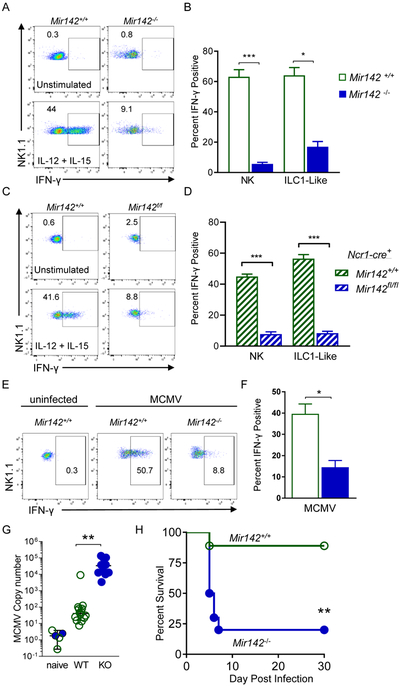
Natural killer (NK) cells are cytotoxic type 1 innate lymphoid cells (ILCs) that defend against viruses and mediate anti-tumor responses, yet mechanisms controlling their development and function remain incompletely understood. We hypothesized that the abundantly expressed microRNA-142 (miR-142) is a critical regulator of type 1 ILC biology. Interleukin-15 (IL-15) signaling induced miR-142 expression, whereas global and ILC-specific miR-142-deficient mice exhibited a cell-intrinsic loss of NK cells. Death of NK cells resulted from diminished IL-15 receptor signaling within miR-142-deficient mice, likely via reduced suppressor of cytokine signaling-1 (Socs1) regulation by miR-142-5p. ILCs persisting in Mir142-/- mice demonstrated increased expression of the miR-142-3p target αV integrin, which supported their survival. Global miR-142-deficient mice exhibited an expansion of ILC1-like cells concurrent with increased transforming growth factor-β (TGF-β) signaling. Further, miR-142-deficient mice had reduced NK-cell-dependent function and increased susceptibility to murine cytomegalovirus (MCMV) infection. Thus, miR-142 critically integrates environmental cues for proper type 1 ILC homeostasis and defense against viral infection.

Keywords: IL-15; ILC1-like cells; NK cells; cytokine receptors; innate lymphoid cells; integrin; microRNA-142; murine cytomegalovirus; tissue resident.


Figures

Figure 1.
Figure 1.. miR-142 deficiency reduces peripheral type-1 ILC numbers and alters trafficking.
BM, SP, and blood (BL) of Mir142+/+ (control, open green) and Mir142−/− (filled blue) were harvested and assessed for type-1 ILCs (CD45+CD3NK1.1+NKp46+). (A) Representative flow plot of NK1.1+ NKp46+ cells (gated on CD3) from the SP and BM. (B) Summary data showing the total NK1.1+ NKp46+ cells, see Fig. S1 (C-D) Schema of the BM chimera assay. (D) Summary of 2 independent experiments with >8 mice per group. (E) Non-competitive BM chimera experiment where control or Mir142−/− BM were transferred into congenic, irradiated recipients. Summary data showing percent CD45.2+CD3NK1.1+NKp46+ cells from 3 independent experiments with 6 mice per group. (F) Summary data showing the NK cell precursor population numbers: pre-NK precursor (pre-NKp) and restricted NK precursor (rNKp). Data are from >3 independent experiments with >12 mice per group. Data were compared using Student’s T test or Mann-Whitney test. (G) Experimental schema for trafficking experiments. Briefly, control and miR142−/− BM cells were differently labeled with cell trace violet and cell trace yellow. The cells were mixed, injected iv. into WT recipients, and tissues examined for the presence of labeled NK1.1+NKp46+ cells. Flow plots of pre-infusion NK1.1+ cells present at 1:1 ratio. (H) Representative flow cytometry showing NK1.1+ cells. (I) Summary data from (H) showing the ratio of control and miR142−/− NK1.1+ cells. N=10 mice from 2 independent experiments. Significance was determined by Wilcoxon signed rank test against the theoretical value of one (no trafficking alteration, dashed line). Please also see Figure S3.
Figure 2.
Figure 2.. miR-142-deficient mice display altered, tissue-specific type-1 ILC compartment.
The CD3NK1.1+NKp46+ compartment of Mir142+/+ (open green) and Mir142−/− (filled blue) mice was assessed for CD49a and CD49b by flow cytometry. (A) Representative flow plots of CD3NK 1.1 +NKp46+ cells. (B) Total number of NK cells (NK, CD49aCD49b+), ILC1-like (CD49a+CD49b+), and ILC1s (CD49a+CD49b) within the indicated tissues. Summary from >3 independent experiments with > 10 mice per group. (C) Total numbers of NK, ILC1-like, and ILC1 cells within control (Ncr1-cre+ Mir142+/+) and ILC-specific miR-142-deficient (Ncr1-cre+ Mir142f/f) mice, cells gated on CD3NK1.1+NKp46+ YFP+. (D) Experimental Schema. BM from control and Ncr1-cre+ Mir142f/f mice were transferred into irradiated recipients and spleens assessed 6 weeks later. (E) Summary data showing the percent of ILC1-like cells from CD3-NK1.1+NKp46+ CD45.1+ (WT) or YFP+ (Mir142f/f) within the indicated recipient mice. Data from 2-3 independent experiments, N=7-10 mice, compared using T-test or Mann-Whitney corrected for multiple comparisons, when appropriate. See also Figure S2.
Figure 3.
Figure 3.. miR-142-deficient type-1 ILCs display ILC1-like phenotype in lymphoid tissues.
(A) Representative histograms depict CD43 expression on NK1.1+NKp46+ cells from Mir142−/− (blue) mice compared to controls (green). Gray filled histograms represent CD43 lymphocytes. (B) Summary from (A). (C) Summary CD73 and TIGIT median expression on NK1.1+NKp46+ cells. (D) Transcription factor median expression on Mir142−/− and control NK1.1+NKp46+ cells. Data are from 2-4 independent experiments with N=5-10 mice per group. Data were compared using Student’s T or Mann Whitney tests.
Figure 4.
Figure 4.. TGF-β signaling is increased in Mir142−/− type-1 ILCs.
(A-B) CD3NK1.1+NKp46+ cells were flow-sorted from Mir142+/+ (WT) or Mir142−/− (KO) BM or SP and microarray performed. (A) GSEA of the TGF-β Hallmark Signaling Pathway gene set in Mir142−/− versus WT from SP and BM. NES, Normalized enrichment score. (B) Heat map of differentially regulated genes between Mir142+/+, Smad4Δ/Δ, and Mir142−/− NK1.1+ cells. Genes associated with the ILC1-like signature (black), miR-142 targets (blue), and NK cell development and effector functions (green) are indicated. Data are from 3 biological replicates. (C) Predicted miR-142-3p binding site in the 3’UTR of Tgfbr1. (D) Luciferase reporter assay for miR-142 overexpression (OE) without the Tgfbr1 3’UTR (empty), with Tgfbr1 3’ UTR (WT) or with Tgfbr1-mutated at the miR-142-3p binding site in the 3’ UTR (Δ). Data summarize 3 independent experiments and were compared using an ANOVA. (E) Summary TGFBR1 expression on type-1 ILCs from SP of indicated mice (relative expression: median minus FMO); data from > 3 independent experiments were compared with T test (n=6-8 mice per group). (F-G) SP cells were stimulated with 10 ng/mL IL-15 plus 10 ng/mL TGF-β1 or left unstimulated (0 minutes) and assessed for phosphorylated (p) SMAD-2 and/or −3. (F) Representative flow plot showing pSMAD-2 and/or −3 in unstimulated (0m, top) or stimulated (60m, bottom) CD3NK1.1+ cells. (G) Summary from (F). Data are from 2 independent experiments with 6-7 mice per group. Significance was determined by 2-Way ANOVA. Please also see Figure S4.
Figure 5.
Figure 5.. miR-142-deficient type-1 ILCs are hyporesponsive to IL-15 signaling.
(A) WT CD3NK1.1+ cells were sorted from the SP and incubated with 10 ng/mL IL-15. Immediately after sorting (baseline) and after stimulation, RNA was extracted from the cells and miR-142-3p/5p expression were assessed by qPCR. Summary data (normalized to baseline) from 2 independent experiments with 3 biological replicates. (B) Splenocytes were incubated with IL-15 for 48 hours in vitro. Summary data depict the percent of type-1 ILCs (CD45+CD3NK1.1+) positive for 7-AAD and/or Annexin V. (C) Representative histograms of surface expression of CD122 (IL-2 and −15Rβ) on Mir142+/+ and Mir142−/− CD45+CD3NK1.1+ cells (Global, Top) and Ncr1-cre+ Mir142+/+ and Ncr1-cre+ Mir142f/f CD45+CD3NK1.1+YFP+ cells (Ncr1-cre+, Bottom). Gray filled histograms depict CD122-negative lymphocytes. (D) Summary data from (C) showing the MFI. (E) Representative histograms showing intracellular pSTAT-5 (Y694) staining in global (left) and Ncrl-cre+ (right) NK1.1+ and/or YFP+ cells after 15-minute stimulation with IL-15. (F) Summary data from (E). (G) Representative histograms showing pSTAT-4 in global (Top) and Ncr1-cre+ (Bottom) CD3 NK1.1+ and/or YFP+ cells after stimulation with IL-12 for 15 minutes. (H) Summary data from (G). (I) Predicted miR-142-5p binding site in Socs1 3’ UTR (top). A luciferase reporter assay for Socs1 3’UTR. Data are compared using an ANOVA. Data summarize 3 independent experiments. (J-K) CD3NK1.1+ SP cells from control and Mir142−/− SP were sorted and assessed for Socs1 and β-actin by western blot. (J) Representative blot from 3 independent experiments showing Socs1 (top) and β-Actin (bottom). (K) Summary data depicting Socs1 band intensity (normalized using β-actin). Comparisons were made using RM-ANOVA (A, I), Student’s T test/Mann-Whitney (B-D, H), RM-ANOVA (F), paired T test (K). Please also see Figure S5.
Figure 6.
Figure 6.. Integrin aV promotes type-1 ILC survival in miR-142-deficient mice.
(A) Summary data of integrin αVβ3 and CD49a on CD3NK1.1+NKp46+CD49b+ cells from the SP of Il15−/− or control mice. (B) Representative histogram showing integrin αV expression in the indicated tissues of Global and Ncr1-cre+ mice. (C) Summary showing percent integrin αV+ NK1.1+NKp46+ cells in the indicated tissues from Mir142−/− (left), Ncr1-cre+ Mir142f/f (YFP+, right), and controls. (D) Predicted miR-142-3p binding site in 3’UTR of Itgav (top). Luciferase reporter assay for Itgav 3’UTR (bottom). Data summarize 3 independent experiments and were compared using an ANOVA. (E) Mir142−/− mice were treated for 2 weeks with an αV inhibitor or vehicle. Summary data of total type-1 ILCs in the SP from 4 independent experiments, n=11 mice per group. (C, E) Data were compared using Student’s T test. See also Figure S3.
Figure 7.
Figure 7.. miR-142-deficient type-1 ILCs display altered effector responses in vitro and in vivo.
(A-B) Splenocytes from Mir142+/+ and Mir142−/− mice were stimulated for 6 hours. (A) Representative flow plots showing intracellular IFN-γ staining in CD45+CD3NK1.1+ cells. (B) Summary data from (A). (C-D) Splenocytes were isolated from Ncr1-cre+ Mir142+/+ (control, open green bars) and Ncr1-cre+ Mir142f/f (filled blue bars) mice and stimulated for 6 hours. (C) Representative flow plots showing intracellular IFN-γ staining in CD45+CD3NK1.1+YFP+ cells. (D) Summary data from (C). (E-F) 36 hours after MCMV infection, SP NK1.1+ cells were assessed immediately for intracellular IFN-γ protein by flow cytometry. (E) Representative flow plots showing IFN-γ in CD45+CD3NK1.1+ cells. (F) Summary from (E). (G) Viral copy numbers in the SP of MCMV-naïve control, Mir142+/+ (WT) and Mir142−/− (KO) MCMV-infected mice, were assessed using qPCR 4 days after infection (units: IE1×1000/B-Actin). (H) Mice were infected with 1e5 PFU MCMV and survival assessed. Pooled data from 2-3 independent experiments with >4 mice per group per experiment. Comparisons were made using Student’s T test or Mann-Whitney test, and log-rank (H). See also Figure S7.

References

    1. Bezman NA, Chakraborty T, Bender T, and Lanier LL (2011). miR-150 regulates the development of NK and iNKT cells. J Exp Med 2018, 2717–2731. - PMC - PubMed
    1. Chapnik E, Rivkin N, Mildner A, Beck G, Pasvolsky R, Metzl-Raz E, Birger Y, Amir G, Tirosh I, Porat Z, et al. (2014). MiR-142 orchestrates a network of actin cytoskeleton regulators during megakaryopoiesis. Elife 3:e01964, 1–22. - PMC - PubMed
    1. Collins PL, Cella M, Porter SI, Li S, Gurewitz GL, Hong HS, Johnson RP, Oltz EM, and Colonna M (2019). Gene Regulatory Programs Conferring Phenotypic Identities to Human NK Cells. Cell 176, 348–360.e12. - PMC - PubMed
    1. Cooper MA, Bush JE, Fehniger TA, Vandeusen JB, Waite RE, Liu Y, Aguila HL, and Caligiuri MA (2002). In vivo evidence for a dependence on interleukin 15 for survival of natural killer cells. Blood 100, 3633–3638. - PubMed
    1. Cortez VS, Fuchs A, Cella M, Gilfillan S, and Colonna M (2014). Cutting Edge: Salivary Gland NK Cells Develop Independently of Nfil3 in Steady-State. J. Immunol. 192, 4487–4491. - PubMed

Publication types

MeSH terms

Substances