. 2020 Jan;83(1):240-253.
doi: 10.1002/mrm.27932. Epub 2019 Aug 11.

High-resolution intravascular MRI-guided perivascular ultrasound ablation

Affiliations

High-resolution intravascular MRI-guided perivascular ultrasound ablation

Xiaoyang Liu et al. Magn Reson Med. 2020 Jan.

Abstract

Purpose: To develop and test in animal studies ex vivo and in vivo, an intravascular (IV) MRI-guided high-intensity focused ultrasound (HIFU) ablation method for targeting perivascular pathology with minimal injury to the vessel wall.

Methods: IV-MRI antennas were combined with 2- to 4-mm diameter water-cooled IV-ultrasound ablation catheters for IV-MRI on a 3T clinical MRI scanner. A software interface was developed for monitoring thermal dose with real-time MRI thermometry, and an MRI-guided ablation protocol developed by repeat testing on muscle and liver tissue ex vivo. MRI thermal dose was measured as cumulative equivalent minutes at 43°C (CEM43 ). The IV-MRI IV-HIFU protocol was then tested by targeting perivascular ablations from the inferior vena cava of 2 pigs in vivo. Thermal dose and lesions were compared by gross and histological examination.

Results: Ex vivo experiments yielded a 6-min ablation protocol with the IV-ultrasound catheter coolant at 3-4°C, a 30 mL/min flow rate, and 7 W ablation power. In 8 experiments, 5- to 10-mm thick thermal lesions of area 0.5-2 cm2 were produced that spared 1- to 2-mm margins of tissue abutting the catheters. The radial depths, areas, and preserved margins of ablation lesions measured from gross histology were highly correlated (r ≥ 0.79) with those measured from the CEM43 = 340 necrosis threshold determined by MRI thermometry. The psoas muscle was successfully targeted in the 2 live pigs, with the resulting ablations controlled under IV-MRI guidance.

Conclusion: IV-MRI-guided, IV-HIFU has potential as a precision treatment option that could preserve critical blood vessel wall during ablation of nonresectable perivascular tumors or other pathologies.

Keywords: MR-guided ultrasound ablation; high intensity focused ultrasound (HIFU); intravascular MRI (IVMRI); liver and pancreatic cancer; vessel involvement.


Figures

Figure 1
Figure 1
Combined intravascular (IV) MRI and ultrasound (HIFU) ablation catheters (a-e) and the software interface (f). In initial studies, the IV-MRI antenna was taped (not shown) to the HIFU transducer (a). Subsequent IV-HIFU catheters incorporate a lumen to take an X-ray guidewire or the MRI antenna (b). Catheter denoted #1, #2 and #3 from Table 1 are pictured in (c)-(e). A screen-shot of the MATLAB-based real-time thermal monitoring software interface installed on a personal computer (PC), is shown in (f). The monitor is connected to the scanner console computer via an ethernet cable. Inset (bottom right) shows an experiment with data transfer between the scanner console and the PC.
Figure 2
Figure 2
Photo of a section of chicken breast tissue in the ablation plane following bench-testing with catheter #2 (a). A preserved tissue margin (pink) surrounds the probe location, inside the ablation lesion (white). The IV HIFU catheter ablation transducer (yellow arrows) and IV MRI loopless atenna whip junction (white arrows) are seen in orthogonal high-resolution IV MRI planes (b,c). Screen shots of online thermometry (scale in °C at right) during pre-ablation catheter cooling (d) and ablation (e) are shown. The catheter position is denoted by blue circles (yellow arrows). Part (f) is a photo annotated with contours of the 86% lethal thermal dose of CEM43=340 as determined by MRI thermometry (magenta) and with a contour (white) enclosing the lesion (bleached).
Figure 3
Figure 3
Images of the IV MRI antenna (white arrow) and HIFU catheter #1 (yellow arrow) in a blood vessel of pig liver ex vivo in transverse (a) and co-axial planes (b: inset denotes the expanded region in c). MRI thermometry shows temperature maps (scale in °C at right) from the transverse slice in (a): before ablation (d); during ablation at maximum temperature (e); and immediately after the HIFU transducer is turned off (f).
Figure 4
Figure 4
Co-registration of lethal thermal dose contours with lesions on tissues slices dissected after ablation experiments performed with catheter #1 located in pig liver blood vessels ex vivo. Tissue slices at the ablation location expose the pallid lesion area (white arrow) (a). The projected, normalized color mapping of the section differentiates the lesion from normal tissue (b, scale at right). The lesion area (white line) is identified by an active contour algorithm for object detection. The vessel wall is manually traced (blue line). The CEM43≥340 (magenta line) contour is calculated from MRI thermometry and co-registered on the anatomical MRI reference scan (c). The catheter (yellow circle) position and the enclosing vessel (green line) are identified manually on the reference scan. Landmarks identified from MRI, MRI thermometry and the photo color map are co-registered on the original photo for comparison and correlation (d).
Figure 5
Figure 5
Comparison of lesion sizes exceeding a thermal dose CEM43≥340 as measured from MRI thermometry, with lesions measured from photos of the dissected ablation planes. The radial depth, Lr (a); area, La (b) of lesions; and the average gap between lesion and vessel wall, Lg (c), are correlated (correlation coefficient, r >0.79; Pearson probability, p <0.02; solid lines, least-squares regression line; the dashed line is the identity line). Numbers near the data points denote the experiment number (a-c). Part (d) shows the Jaccard index (area of intersection divided by the area of the united lesion areas) for each experiment.
Figure 6
Figure 6
IV MRI of catheter #3 with thru-lumen design (from Fig.1b) in a porcine liver (a). IV MRI thermometry (scale, °C at right) shows pre-cooling (b); ablation in one direction (c); simultaneous ablation in two directions with both transducers turned-on (d) and after turning one transducer off (e; blue circle denotes catheter position). Part (f) is a photo of the dissected transverse section through the ablation showing lesion in both directions (white arrows; blue circle denotes the vessel hosting the catheter). Part (g) shows the Movat-stained histology indicating a margin of preserved tissue between the vessel wall and lesion (white arrow).
Figure 7
Figure 7
Placing an IV MRI HIFU catheter #3 in a porcine IVC from the right femoral vein in vivo (a) confirmed by fluoroscopy (b). The left femoral artery is accessed by a 5 French sheath (a), for a fiber-optic temperature probe to monitor the body temperature for base line calibration of the PRFS method. Sagittal T2wTSE MRI (c; white arrow). High-resolution IV MRI (d; pink arrow denotes catheter; S1 is the targeted psoas muscle; S2 is the colon, a second target; S3, aorta; S4 is the IVC; S5 is the spine).
Figure 8
Figure 8
Anatomical reference scan for an in vivo porcine study (a); and IV MRI thermometry frames (scale in °C at right) acquired pre-ablation (b); Initial mis-direction of the thermal beam was detected by thermometry (c) and redirected to the psoas muscle; during ablation of the psoas muscle (white arrow) and colon (yellow arrow; d); and immediately after turning the transducer power off (e). Blue circles denote the catheter location. Part (f) shows thermal lesions in the colon mucosa from multiple ablations (white arrows). Part (g) shows thermal lesions in psoas muscle (g, white arrows). Part (h) shows MT-stained histology of the lesion (black arrow).
Figure 9
Figure 9
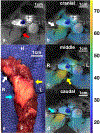
IV MRI thermometry of ablations performed at three locations (during pullback from head to feet direction) in the psoas muscle in a second in vivo porcine study using catheter #3. The anatomical MRI reference scan at the first location (a) shows the ablation target (red arrow). Part (b-d) shows the temperature rise (white, yellow and cyan arrows) during ablation (scale in °C at right) at three pullback locations. In (b) the thermal beam is slightly clockwise of the target so the device was rotated for the acquisitions in (c) and (d). Blue circles denote the catheter location. Part (e) shows the post-mortem photo of thermal lesions in the psoas muscle. The first ablation lesion (e; white arrow) is skewed relative to the second and third lesions (e; yellow and cyan arrows) which extend to form a continuous lesion.

Similar articles

Cited by

References

    1. Pancreatic Cancer - Cancer Stat Facts. SEER. https://seer.cancer.gov/statfacts/html/pancreas.html. Accessed March 13, 2019.
    1. Al-Hawary MM, Francis IR, Chari ST, et al. Pancreatic Ductal Adenocarcinoma Radiology Reporting Template: Consensus Statement of the Society of Abdominal Radiology and the American Pancreatic Association1. Gastroenterology 2014;146:291–304.e1 doi: 10.1053/j.gastro.2013.11.004. - DOI - PubMed
    1. Buchs NC, Chilcott M, Poletti P-A, Buhler LH, Morel P. Vascular invasion in pancreatic cancer: Imaging modalities, preoperative diagnosis and surgical management. World J. Gastroenterol. WJG 2010;16:818–831 doi: 10.3748/wjg.v16.i7.818. - DOI - PMC - PubMed
    1. Rossi M, Orgera G, Hatzidakis A, Krokidis M. Minimally Invasive Ablation Treatment for Locally Advanced Pancreatic Adenocarcinoma. Cardiovasc. Intervent. Radiol. 2014;37:586–591 doi: 10.1007/s00270-013-0724-x. - DOI - PubMed
    1. Petrou A, Moris D, Paul Tabet P, David Wensley Richards B, Kourounis G. Ablation of the locally advanced pancreatic cancer: An introduction and brief summary of techniques. J. BUON Off. J. Balk. Union Oncol. 2016;21:650–658. - PubMed

Publication types