

Effect of a gum-based thickener on the safety of swallowing in patients with poststroke oropharyngeal dysphagia
- PMID: 31402571
- PMCID: PMC6852432
- DOI: 10.1111/nmo.13695
Effect of a gum-based thickener on the safety of swallowing in patients with poststroke oropharyngeal dysphagia
Abstract
Background: Increasing viscosity with thickening agents is a valid therapeutic strategy for oropharyngeal dysphagia (OD). To assess the therapeutic effect of a xanthan gum-based thickener (Nutilis Clear® ) at six viscosities compared with thin liquid in poststroke OD (PSOD) patients.
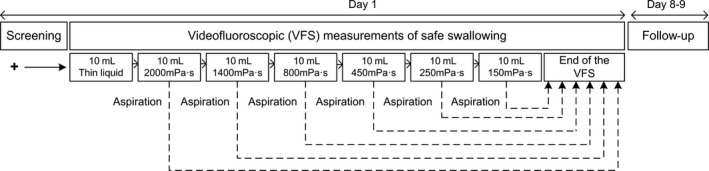
Methods: A total of 120 patients with PSOD were studied in this controlled, multiple-dose, fixed-order, and single-blind study using videofluoroscopy (VFSS). A series of boluses of 10 mL thin liquid and 2000, 1400, 800, 450, 250, and 150 mPa s viscosities were given in duplicate, interrupted in case of aspiration. We assessed the safety and efficacy of swallow and the kinematics of the swallow response.
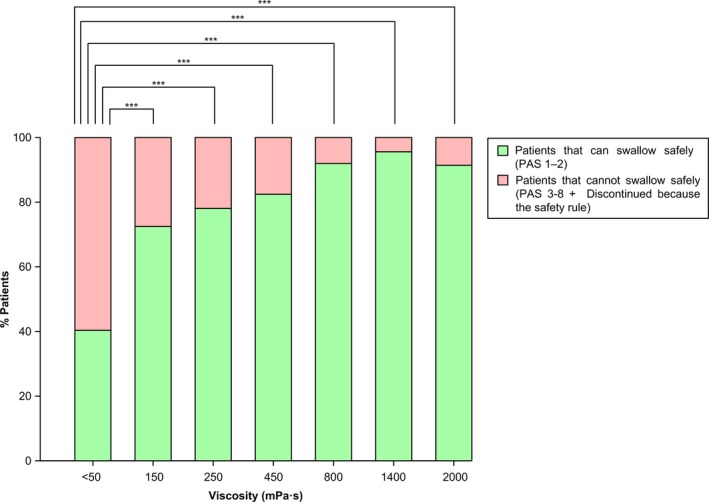
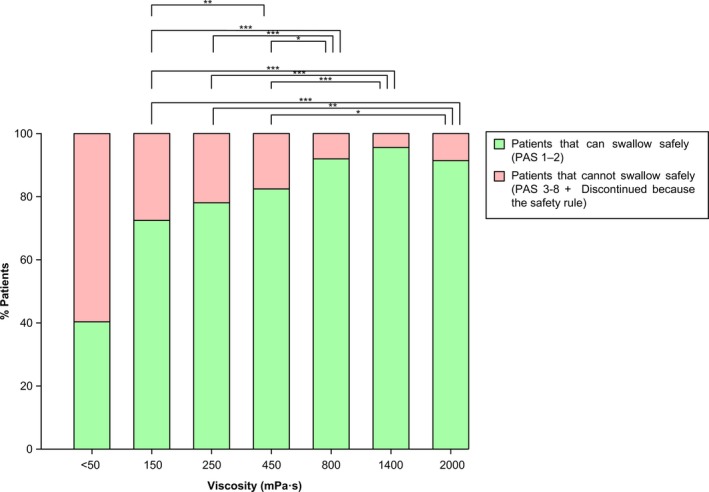
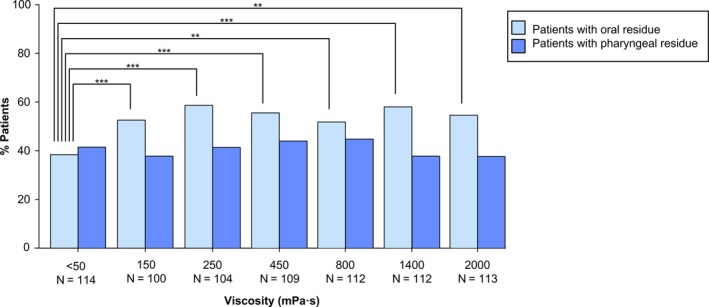
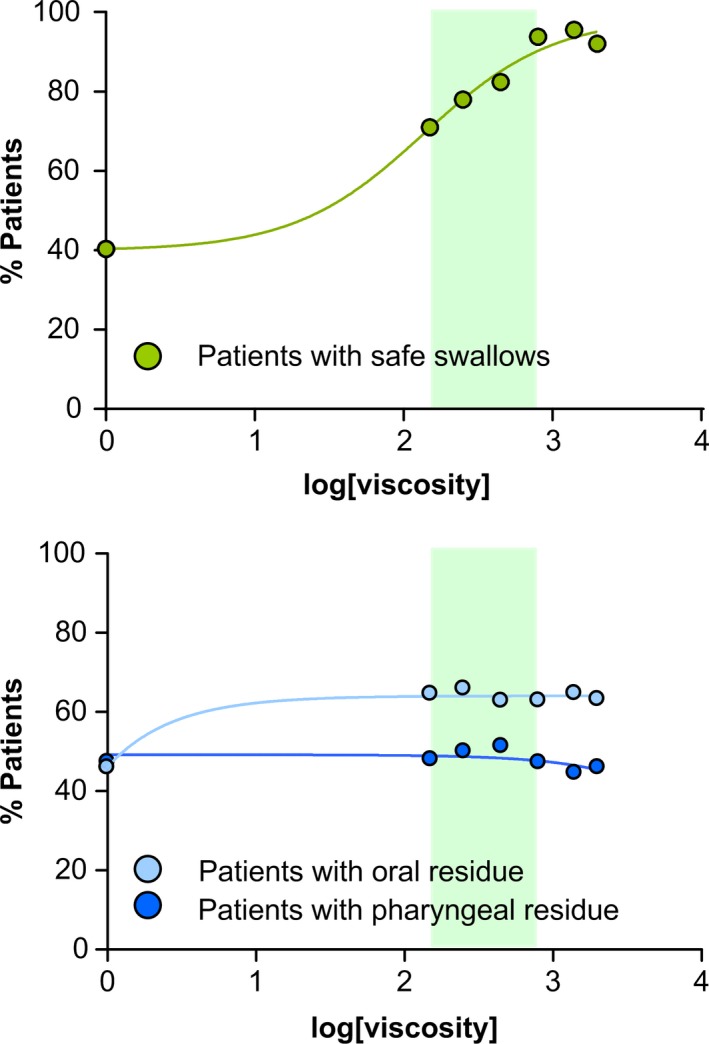
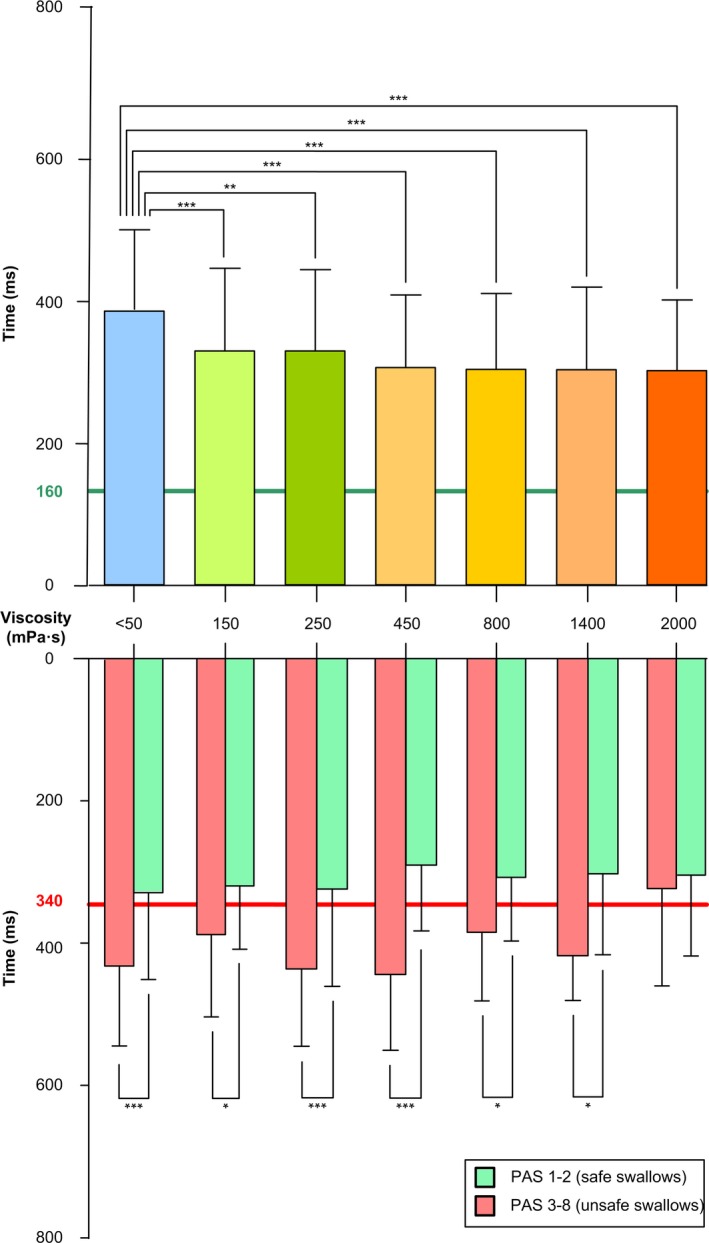
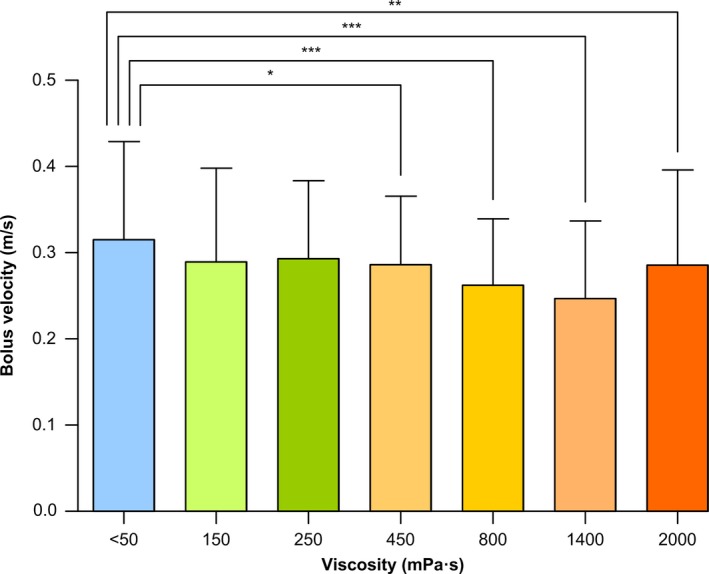
Key results: A total of 41.2% patients had safe swallow at thin liquid which significantly increased for all viscosities from 71.9% at 150 mPa s to 95.6% at 1400 mPa s (P < .001). PAS score (3.7 ± 2.3) at thin liquid was also reduced by increasing bolus viscosity (P < .001). The prevalence of patients with aspiration at thin liquid was 17.5% and decreased at all viscosities (P < .01), except at 150 mPa s. Increasing viscosity shortened time to laryngeal vestibule closure (LVC) at all viscosities (P < .01) and reduced bolus velocity at ≥450 mPa s (P < .05). The prevalence of patients with pharyngeal residue at each viscosity 37.7%-44.7% was similar to that at thin liquid (41.2%).
Conclusions and inferences: The prevalence of unsafe swallow with thin liquids is very high in PSOD. Increasing shear bolus viscosity with this xanthan gum-based thickener significantly increased the safety of swallow in patients with PSOD in a viscosity-dependent manner without increasing the prevalence of pharyngeal residue.
Keywords: aspiration; deglutition disorders; shear viscosity; stroke; swallow response; thickener; xanthan gum.
© 2019 The Authors. Neurogastroenterology & Motility published by John Wiley & Sons, Ltd.
Conflict of interest statement
Declaration of personal interests: Clavé has served as consultant and received research funding from Danone Nutricia Research. Guida, Ripken, and Lansink are employees of Danone Nutricia Research.
Figures
Similar articles
-
The effects of a xanthan gum-based thickener on the swallowing function of patients with dysphagia.Aliment Pharmacol Ther. 2014 May;39(10):1169-79. doi: 10.1111/apt.12696. Epub 2014 Mar 13. Aliment Pharmacol Ther. 2014. PMID: 24628492 Clinical Trial.
-
Shear-Viscosity-Dependent Effect of a Gum-Based Thickening Product on the Safety of Swallowing in Older Patients with Severe Oropharyngeal Dysphagia.Nutrients. 2023 Jul 24;15(14):3279. doi: 10.3390/nu15143279. Nutrients. 2023. PMID: 37513697 Free PMC article.
-
A Comparative Study Between Modified Starch and Xanthan Gum Thickeners in Post-Stroke Oropharyngeal Dysphagia.Dysphagia. 2016 Apr;31(2):169-79. doi: 10.1007/s00455-015-9672-8. Epub 2015 Nov 25. Dysphagia. 2016. PMID: 26607158
-
Effect of Bolus Viscosity on the Safety and Efficacy of Swallowing and the Kinematics of the Swallow Response in Patients with Oropharyngeal Dysphagia: White Paper by the European Society for Swallowing Disorders (ESSD).Dysphagia. 2016 Apr;31(2):232-49. doi: 10.1007/s00455-016-9696-8. Epub 2016 Mar 25. Dysphagia. 2016. PMID: 27016216 Free PMC article. Review.
-
Rheological Issues on Oropharyngeal Dysphagia.Dysphagia. 2023 Apr;38(2):558-585. doi: 10.1007/s00455-021-10337-w. Epub 2021 Jul 3. Dysphagia. 2023. PMID: 34216239 Review.
Cited by
-
A Comparative Study on the Effect of Acute Pharyngeal Stimulation with TRP Agonists on the Biomechanics and Neurophysiology of Swallow Response in Patients with Oropharyngeal Dysphagia.Int J Mol Sci. 2022 Sep 15;23(18):10773. doi: 10.3390/ijms231810773. Int J Mol Sci. 2022. PMID: 36142680 Free PMC article.
-
Rheological Properties and Stability of Thickeners for Clinical Use.Nutrients. 2022 Aug 23;14(17):3455. doi: 10.3390/nu14173455. Nutrients. 2022. PMID: 36079712 Free PMC article.
-
European Stroke Organisation and European Society for Swallowing Disorders guideline for the diagnosis and treatment of post-stroke dysphagia.Eur Stroke J. 2021 Sep;6(3):LXXXIX-CXV. doi: 10.1177/23969873211039721. Epub 2021 Oct 13. Eur Stroke J. 2021. PMID: 34746431 Free PMC article.
-
Therapeutic Effect on Swallowing Function and on Hydration Status of a New Liquid Gum-Based Thickener in Independently-Living Older Patients with Oropharyngeal Dysphagia.Nutrients. 2023 Oct 31;15(21):4621. doi: 10.3390/nu15214621. Nutrients. 2023. PMID: 37960274 Free PMC article.
-
Texture-Modified Food for Dysphagic Patients: A Comprehensive Review.Int J Environ Res Public Health. 2021 May 12;18(10):5125. doi: 10.3390/ijerph18105125. Int J Environ Res Public Health. 2021. PMID: 34066024 Free PMC article. Review.
References
-
- Clavé P, Shaker R. Dysphagia: current reality and scope of the problem. Nat Rev Gastroenterol Hepatol. 2015;12(5):259‐270. - PubMed
-
- World Health Organization . International Statistical Classification of Diseases and Related Health Problems 10th Revision. 2016. Available from: http://apps.who.int/classifications/icd10/browse/2016/en. Accessed February 6, 2019.
-
- Rofes L, Muriana D, Palomeras E, et al. Prevalence, risk factors and complications of oropharyngeal dysphagia in stroke patients: a cohort study. Neurogastroenterol Motil. 2018;30(8):1‐10. - PubMed
-
- Rofes L, Arreola V, Romea M, et al. Pathophysiology of oropharyngeal dysphagia in the frail elderly. Neurogastroenterol Motil. 2010;22(8):1‐9. - PubMed
-
- Martino R, Foley N, Bhogal S, Diamant N, Speechley M, Teasell R. Dysphagia after stroke: incidence, diagnosis, and pulmonary complications. Stroke. 2005;36(12):2756‐2763. - PubMed
Publication types
MeSH terms
Substances
LinkOut - more resources
Full Text Sources
Medical
