. 2019 Jul 24;5(7):1146-1158.
doi: 10.1021/acscentsci.9b00052. Epub 2019 Jun 4.

Biowire Model of Interstitial and Focal Cardiac Fibrosis

Affiliations

Biowire Model of Interstitial and Focal Cardiac Fibrosis

Erika Yan Wang et al. ACS Cent Sci. .

Abstract

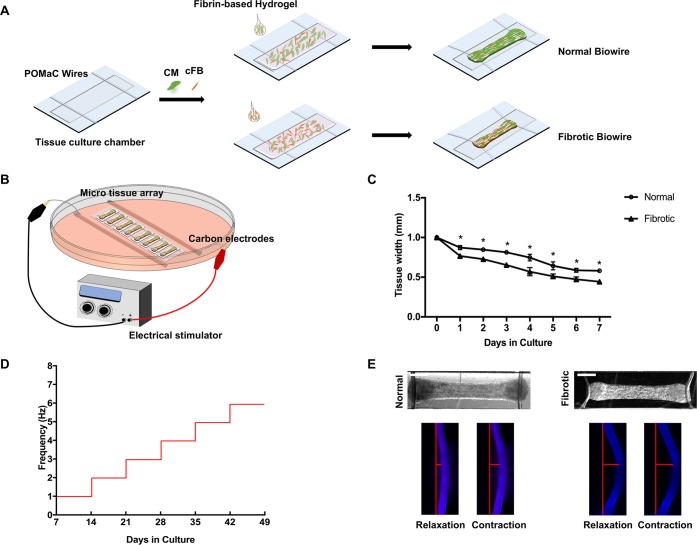
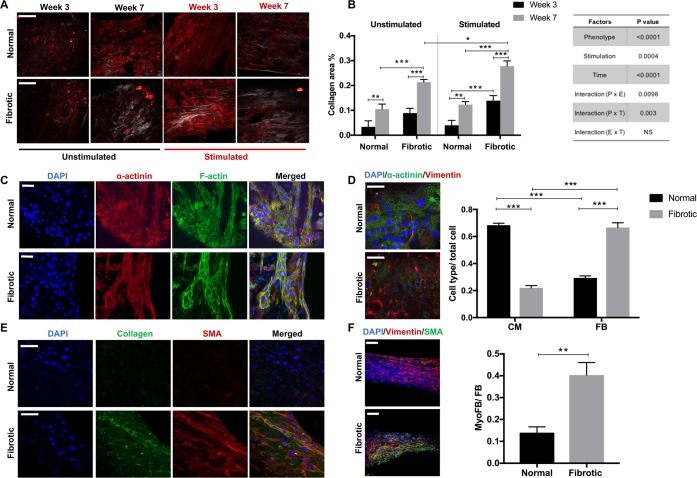
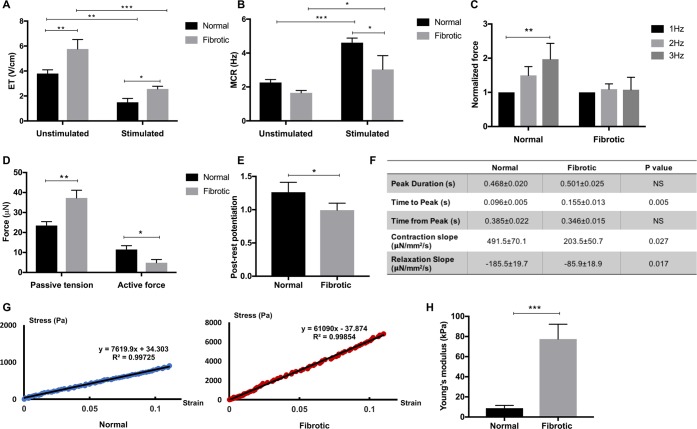
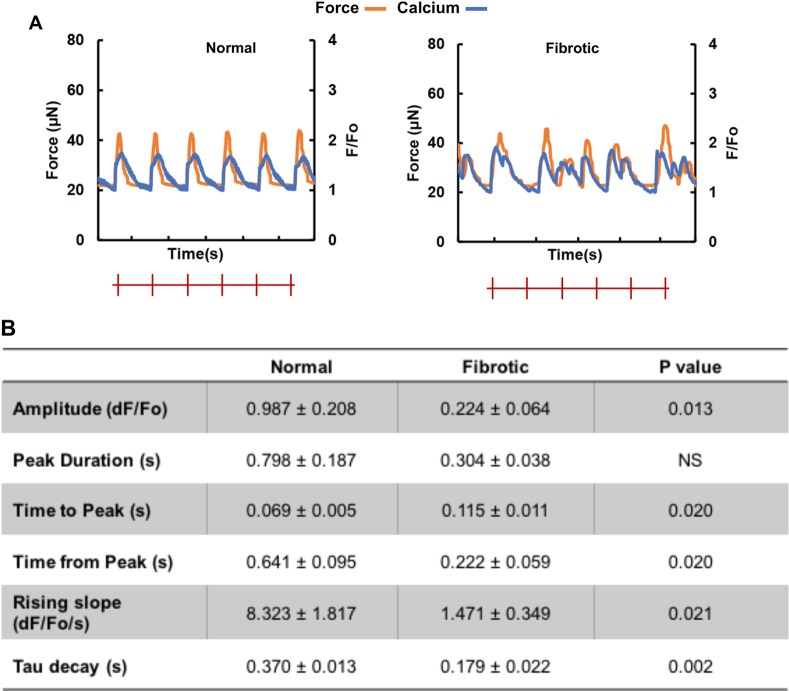
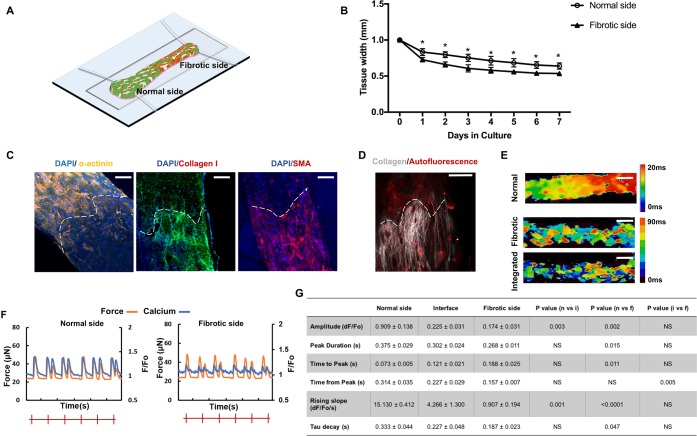
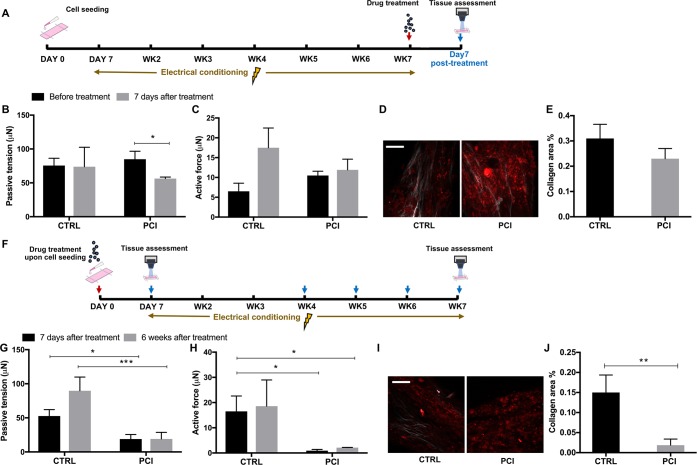
Myocardial fibrosis is a severe global health problem due to its prevalence in all forms of cardiac diseases and direct role in causing heart failure. The discovery of efficient antifibrotic compounds has been hampered due to the lack of a physiologically relevant disease model. Herein, we present a disease model of human myocardial fibrosis and use it to establish a compound screening system. In the Biowire II platform, cardiac tissues are suspended between a pair of poly(octamethylene maleate (anhydride) citrate) (POMaC) wires. Noninvasive functional readouts are realized on the basis of the deflection of the intrinsically fluorescent polymer. The disease model is constructed to recapitulate contractile, biomechanical, and electrophysiological complexities of fibrotic myocardium. Additionally, we constructed a heteropolar integrated model with fibrotic and healthy cardiac tissues coupled together. The integrated model captures the regional heterogeneity of scar lesion, border zone, and adjacent healthy myocardium. Finally, we demonstrate the utility of the system for the evaluation of antifibrotic compounds. The high-fidelity in vitro model system combined with convenient functional readouts could potentially facilitate the development of precision medicine strategies for cardiac fibrosis modeling and establish a pipeline for preclinical compound screening.


Conflict of interest statement

The authors declare the following competing financial interest(s): Y.Z. and M.R. are co-founders of TARA Biosystems Inc. and hold equity in this company. TARA Biosystems Inc. uses the Biowire II technology described in this manuscript for commercial applications. All other authors have no conflicts of interest.

Figures

Figure 1
Figure 1
Generation of the disease model on the Biowire II platform. (A) Schematic of the Biowire II chip design and tissue construction. (B) Schematic of the electrical stimulation chamber for tissue maturation. (C) Quantification of compaction based on the tissue width measurement during the first 7 days of culture (mean ± SD, n = 3, one-way repeated measures ANOVA within each group). (D) Protocol used to electrically condition tissues upon compaction to promote tissue organization and maturation. (E) Representative bright field images of normal and fibrotic tissues and intrinsically fluorescent POMaC wires observed under blue fluorescent light as the tissues undergo relaxation–contraction cycles. Wire bending due to passive tension and the maximum active force development generated by the tissues are illustrated with the red bars. (Scale bar = 500 μm).
Figure 2
Figure 2
Fibrotic tissues exhibit enhanced collagen deposition and elevated myofibroblast content. (A, B) Representative secondary harmonic generation (SHG) images and quantification of collagen content in normal and fibrotic tissues measured at week 3 and 7 of cultivation. Stimulated is the group subjected to electrical conditioning during cultivation. Unstimulated is the control. Scale bar = 100 μm (mean ± SD, n ≥ 3, three-way ANOVA). The table show results of three-way ANOVA. (C) Representative immunostaining images of normal and fibrotic tissues at the stimulation end point stained for filamentous actin (F-actin) cytoskeleton and sarcomeric α-actinin and counterstained with the nuclear stain DAPI. Scale bar = 100 μm. (D) Representative immunostaining images of normal and fibrotic tissues at stimulation end point double-stained for vimentin and sarcomeric α-actinin and counterstained with the nuclear stain DAPI (scale bar = 50 μm). CM and cFB number are normalized to the total cell count at the tissue cultivation end point (mean ± SD, n ≥ 3, two-way ANOVA). (E) Representative immunostaining images of normal and fibrotic tissues at the stimulation end point stained for collagen type I and α-smooth muscle actin (α-SMA) and counterstained with the nuclear stain DAPI (scale bar = 50 μm). (F) Representative immunostaining images of normal and fibrotic tissues at the stimulation end point double-stained for vimentin and α-SMA and counterstained with the nuclear stain DAPI (scale bar = 100 μm). myoFB fraction in the total fibroblast population (mean ± SD, n = 3, Student’s t test).
Figure 3
Figure 3
Fibrotic tissues exhibit inferior contractile properties compared to the controls. (A, B) Excitation threshold (ET) and maximum capture rate (MCR) measurements for the normal and fibrotic tissues cultivated with (stimulated) or without (unstimulated) electrical conditioning (mean ± SD, n ≥ 3, two-way ANOVA). (C) Active force of normal and fibrotic tissues when stimulated from 1 to 3 Hz (mean ± SD, n ≥ 3, one-way ANOVA within each group). (D) Passive tension and active force for the normal and fibrotic tissues at the electrical conditioning end point (mean ± SD, n = 3, Student’s t test within each group). (E) Postrest potentiation (PRP) of force (normalized to the last pacing frequency) in both groups at the end point of electrical conditioning (mean ± SD, n ≥ 3, Student’s t test). (F) Quantification of force dynamics (mean ± SD, n ≥ 3, Student’s t test). (G) Representative stress–strain relationship for the Young’s modulus in each group. The experimental data are from the linear regions of stress–strain curves obtained by the MicroSquisher stretching test. (H) Young’s moduli of normal and fibrotic tissues at the end of electrical conditioning (mean ± SD, n ≥ 3, Student’s t test).
Figure 4
Figure 4
Fibrotic tissues exhibit abnormal calcium transients and electrophysiological properties compared to the controls. (A) Representative active force (orange) and calcium transient (blue) traces of normal and fibrotic electrically conditioned tissues under electrical field stimulation at 1 Hz. The red marks indicate pacing frequency. (B) Quantification of the calcium transient properties (mean ± SD, n ≥ 3, Student’s t test).
Figure 5
Figure 5
Construction and characterization of the scar-myocardium integrated model. (A) Schematics of the integrated scar-myocardium model. A model of focal fibrosis is generated by seeding a normal (25%) and a high (75%) percentage of FBs together with CMs at the opposing ends of the Biowire II tissue. (B) Quantification of compaction based on the tissue width measurement on the two opposing sides of the integrated tissue during the first 7 days of culture (mean ± SD, n ≥ 3, one-way repeated measures ANOVA within each group). (C) Representative immunostaining images of the integrated tissue stained for sarcomeric α-actinin, collagen type I, and α-SMA. The dashed lines mark the geometrical segregation at the interface (scale bar = 100 μm). (D) SHG imaging of collagen. The dashed lines mark the geometrical segregation at the interface (scale bar = 100 μm). (E) Conduction velocity maps for normal, fibrotic, and integrated tissues (scale bar = 500 μm). The color scale represents the time for an electrical pulse to pass through in milliseconds. (F) Representative active force (orange) and calcium transient (blue) traces of normal and fibrotic sides on the same integrated tissue under electrical field stimulation at 1 Hz. (G) Corresponding quantification of calcium transients on the opposing sides of the tissues and the interface (mean ± SD, n ≥ 3, one-way ANOVA).
Figure 6
Figure 6
Proof of concept drug screening. (A) Schematic of the drug screening timelines of the late treatment (Regimen 1). (B, C) Passive tension and active force before and after 7 days of PCI treatment with matured fibrotic tissues based on Regimen 1 (mean ± SD, n = 3, Student’s t test within each group). (D) Representative SHG images of fibrotic tissues treated with PCI for 7 days compared to the DMSO control (scale bar = 100 μm). (E) Corresponding quantification of the collagen area ratio (mean ± SD, n ≥ 3, Student’s t test). (F) Schematic of the drug screening timeline of the early treatment (Regimen 2). (G, H) Passive tension and active force after 7 days and 6 weeks of PCI treatment based on Regimen 2 (mean ± SD, n = 3, two-way ANOVA). (I, J) Representative SHG images (scale bar = 100 μm) and corresponding quantification of fibrotic tissues treated with PCI for 7 days based on Regimen 2 (mean ± SD, n ≥ 3, Student’s t test).

Similar articles

Cited by

References

    1. Kong P.; Christia P.; Frangogiannis N. G. The pathogenesis of cardiac fibrosis. Cell. Mol. Life Sci. 2014, 71, 549–574. 10.1007/s00018-013-1349-6. - DOI - PMC - PubMed
    1. Krenning G.; Zeisberg E. M.; Kalluri R. The origin of fibroblasts and mechanism of cardiac fibrosis. J. Cell. Physiol. 2010, 225, 631–637. 10.1002/jcp.22322. - DOI - PMC - PubMed
    1. Leask A. Getting to the heart of the matter: new insights into cardiac fibrosis. Circ. Res. 2015, 116, 1269–1276. 10.1161/CIRCRESAHA.116.305381. - DOI - PubMed
    1. Lajiness J. D.; Conway S. J. Origin, development, and differentiation of cardiac fibroblasts. J. Mol. Cell. Cardiol. 2014, 70, 2–8. 10.1016/j.yjmcc.2013.11.003. - DOI - PMC - PubMed
    1. Fan Z.; Guan J. Antifibrotic therapies to control cardiac fibrosis. Biomaterials research 2016, 20, 13–13. 10.1186/s40824-016-0060-8. - DOI - PMC - PubMed