

The interactome of KRAB zinc finger proteins reveals the evolutionary history of their functional diversification
- PMID: 31403225
- PMCID: PMC6745500
- DOI: 10.15252/embj.2018101220
The interactome of KRAB zinc finger proteins reveals the evolutionary history of their functional diversification
Abstract
Krüppel-associated box (KRAB)-containing zinc finger proteins (KZFPs) are encoded in the hundreds by the genomes of higher vertebrates, and many act with the heterochromatin-inducing KAP1 as repressors of transposable elements (TEs) during early embryogenesis. Yet, their widespread expression in adult tissues and enrichment at other genetic loci indicate additional roles. Here, we characterized the protein interactome of 101 of the ~350 human KZFPs. Consistent with their targeting of TEs, most KZFPs conserved up to placental mammals essentially recruit KAP1 and associated effectors. In contrast, a subset of more ancient KZFPs rather interacts with factors related to functions such as genome architecture or RNA processing. Nevertheless, KZFPs from coelacanth, our most distant KZFP-encoding relative, bind the cognate KAP1. These results support a hypothetical model whereby KZFPs first emerged as TE-controlling repressors, were continuously renewed by turnover of their hosts' TE loads, and occasionally produced derivatives that escaped this evolutionary flushing by development and exaptation of novel functions.
Keywords: KAP1; KRAB zinc finger proteins; coelacanth; evolution; mass spectrometry.
© 2019 The Authors. Published under the terms of the CC BY 4.0 license.
Conflict of interest statement
The authors declare that they have no conflict of interest.
Figures
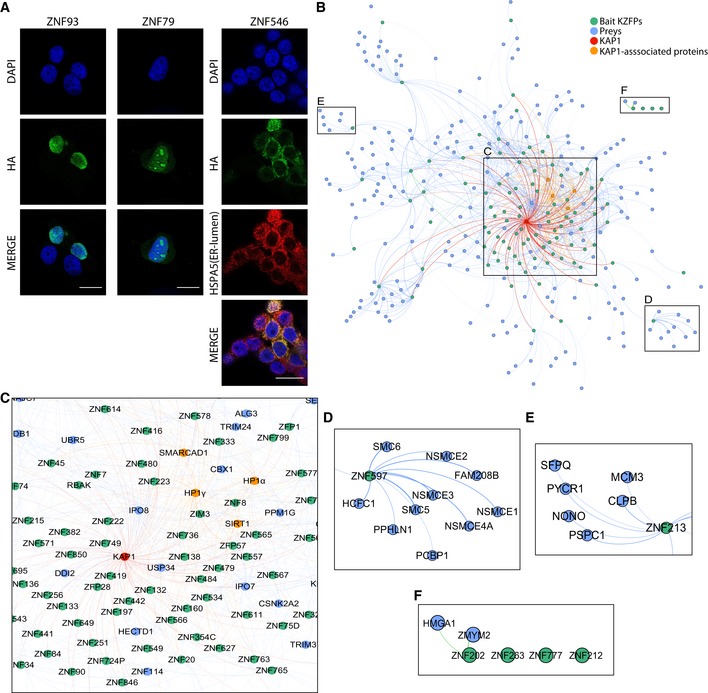
- A
IF by confocal microscopy performed on KRAB‐HA‐overexpressing 293T cells. Staining was performed with anti‐HA (Alexa‐488, green) and anti‐HSPA5 (Alexa‐647, red) antibodies, and DNA was stained with DAPI (blue). The scale bar represents 20 μm.
- B
Force‐directed network representing high‐confidence interactions. Each bait KZFP is represented by a blue circle (“node”) and linked to green nodes that represent its preys. KAP1 is represented in red and its associated proteins SIRT1, SMARCAD1, and HP1α and HP1γ in orange. All interactions represented are below the false discovery rate of 1%. The topology of the network is established by a force‐directed process that follows certain rules: All nodes repel each other and are attracted to the center by artificial “gravity”, and nodes with links attract each other. Weighted links between any nodes are based on the average fold change over controls.
- C
Zoom‐in on the KAP1‐centered core of the interactome.
- D, E
Zoom‐in on KZFPs enriched with unique interactors.
- F
Zoom‐in on the subset of KZFPs not connected to the main interactome.
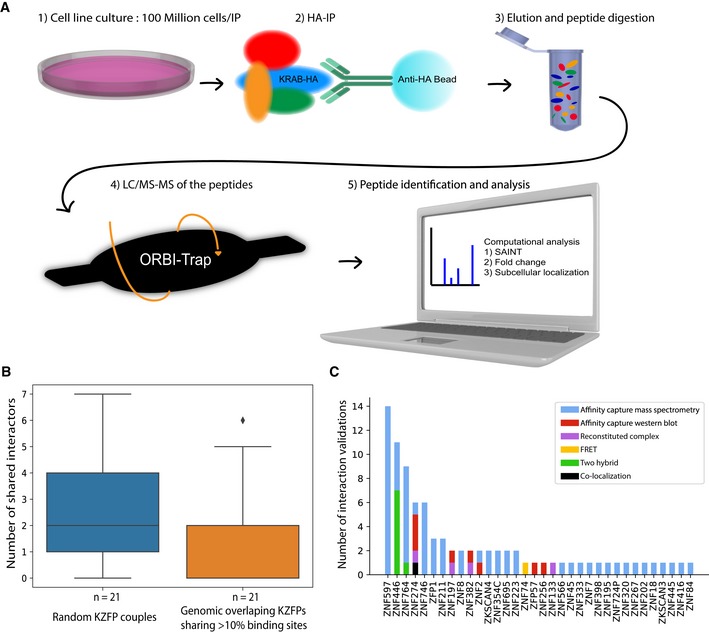
Graphical representation of AP‐MS protocol major steps and filters used for the computational analysis.
Boxplot presenting the number of shared interactors for KZFP couples sharing more than 10% of their binding sites in a reciprocal fashion compared to the number of shared interactors for the same amount of random KZFP couples. Boxplots are shown as median, and 25th (Q1) and 75th (Q3) percentiles. The upper whisker extends to the last data point less than Q3 + 1.5*IQR, where IQR = Q3–Q1. Similarly, the lower whisker extends to the first data point greater than Q1 – 1.5*IQR.
Number of interactions observed in previous studies (Table EV2) associated with their corresponding KZFP. The method used for the interaction detection is indicated by a specific color.
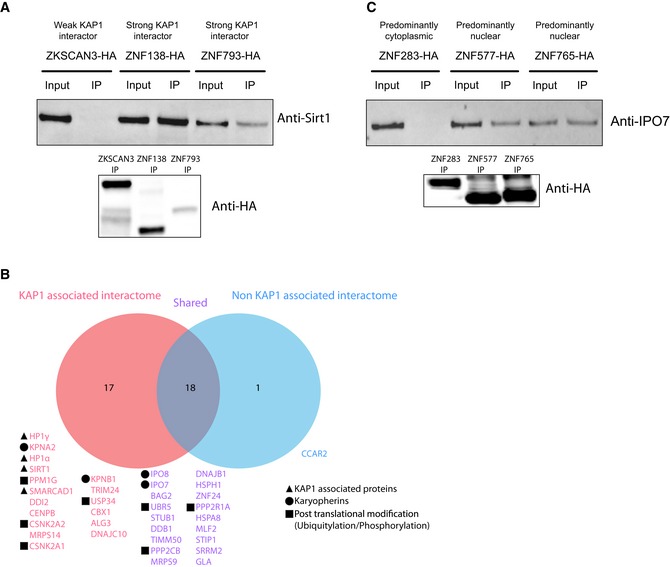
SIRT1 interaction validation. HA‐tagged KZFPs transduced cell lines were used for immunoprecipitations. HA immunoprecipitation of weak KAP1 interactor ZKSCAN3 and candidates ZNF138 and ZNF793, followed by the detection of endogenous SIRT1 in the immunoprecipitates through Western blot using an anti‐SIRT1 antibody. Input = cellular lysate, IP = immunoprecipitate. Western blot using an anti‐HA antibody on the IPs at the bottom.
Venn diagram representing all the common preys that were detected in 5 and more KZFP interactomes. In pink are shown the common preys that only appear in interactomes alongside KAP1, in blue the prey that only appears in interactomes devoid of KAP1, and in purple the preys that are in both type of interactomes.
IPO7 interaction validation. HA‐tagged KZFPs transduced cell lines were used for immunoprecipitations. HA immunoprecipitation of predominantly cytoplasmic ZNF283 and candidates ZNF577 and ZNF765, followed by the detection of endogenous IPO7 through Western blot using an anti‐IPO7 antibody. Input = cellular lysate, IP = immunoprecipitate. Western blot using an anti‐HA antibody on the IPs at the bottom.
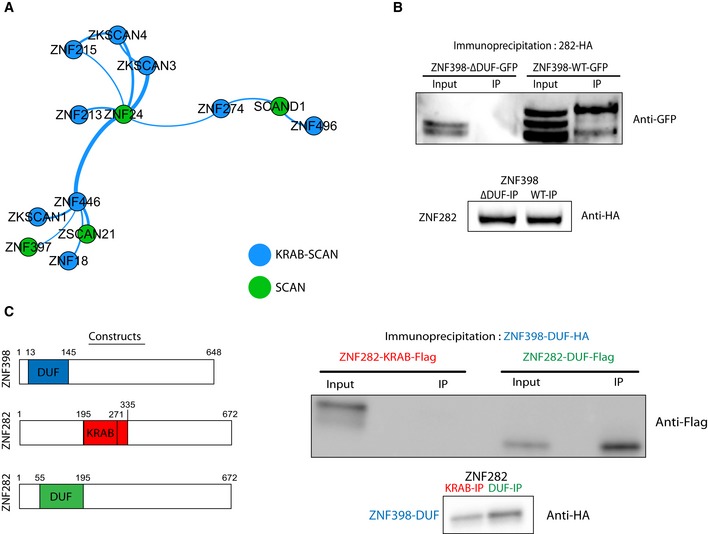
Force‐directed network representing the SCAN interactome displaying SCAN‐containing baits and their SCAN‐containing preys.
HA immunoprecipitation of stably expressed ZNF282‐HA in cells previously transfected with ΔDUF3669‐ZNF398‐GFP and WT‐ZNF398‐GFP followed by the detection of ZNF398 constructs in the IPs through Western blot using an anti‐GFP antibody. Bottom: Western blot using an anti‐HA antibody on the IPs. Input = cellular lysate, IP = immunoprecipitate.
Left: DUF3669‐only and KRAB domain constructs used. Right: HA immunoprecipitation in cells previously co‐transfected with ZNF398‐DUF3669‐HA and either ZNF282‐KRAB‐Flag or ZNF282‐DUF3669‐Flag followed by the detection of either of these protein constructs in the IPs through Western blot using an anti‐Flag antibody. Bottom: Western blot using an anti‐HA antibody on the IPs.
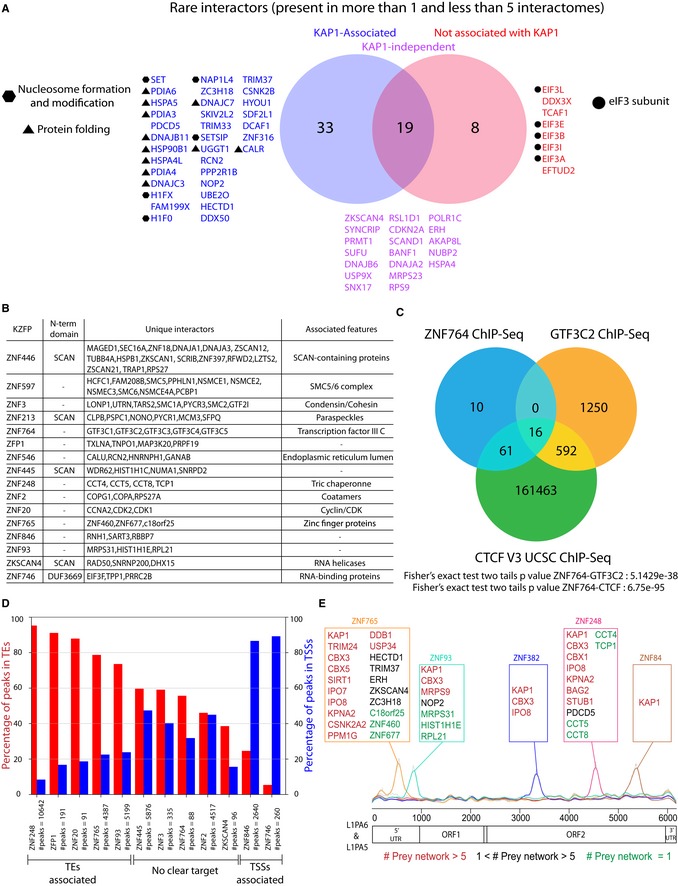
Venn diagram representing all preys detected in less than 5 and more than 1 KZFP interactomes. In blue, are shown the preys that only appear in interactomes alongside KAP1, in red the preys that only appear in interactomes devoid of KAP1, and in purple the preys that are in both types of interactomes.
This table displays all the KZFPs associating with 3 or more unique interactors, the identity of these interactors as well as the features associated with them.
Venn diagram representing the binding sites overlaps between ZNF764, TFIIIC subunit GTF3C2, and CTCF. The GTF3C2 bedfile was obtained from Encode (ENCFF002CYL), and CTCF bedfile was obtained from Encode version 3. The overlap and resulting P‐values were obtained using the Bedtools Fisher exact test.
Histograms representing the percentage of KZFPs (identified in Fig 3B) binding sites falling in TEs (red) or TSSs (blue).
KZFPs binding sites on L1PA5 and L1PA6. Top: Boxes containing the interactors of KZFPs found enriched on L1PA5 and L1PA6. Middle: plot showing the average ChIP‐exo signals (scaled between 0 and 1) for each selected KZFP plotted on top of L1PA5 and L1PA6 multiple sequence alignment (MSA). Bottom: schematic representation of L1PA5 and L1PA6 different domains.
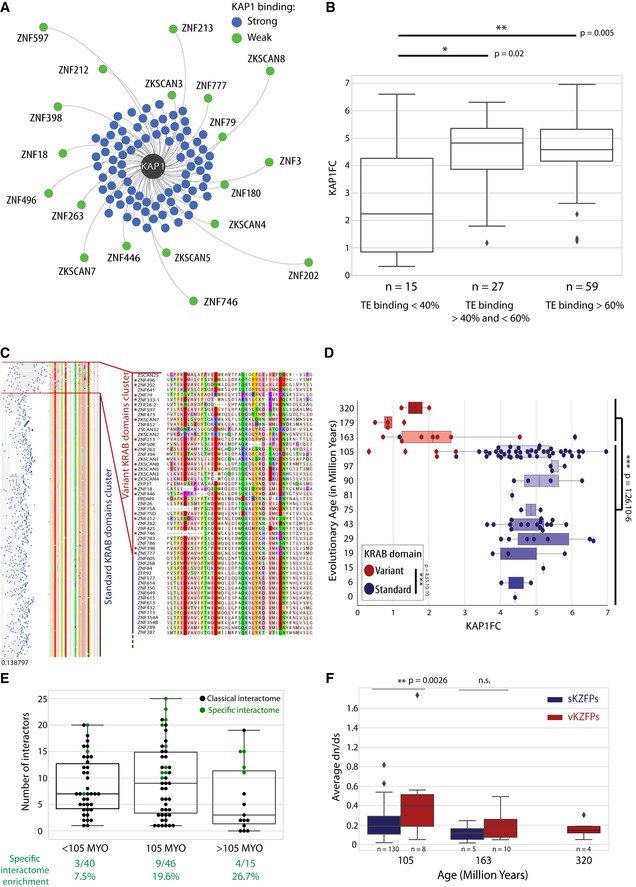
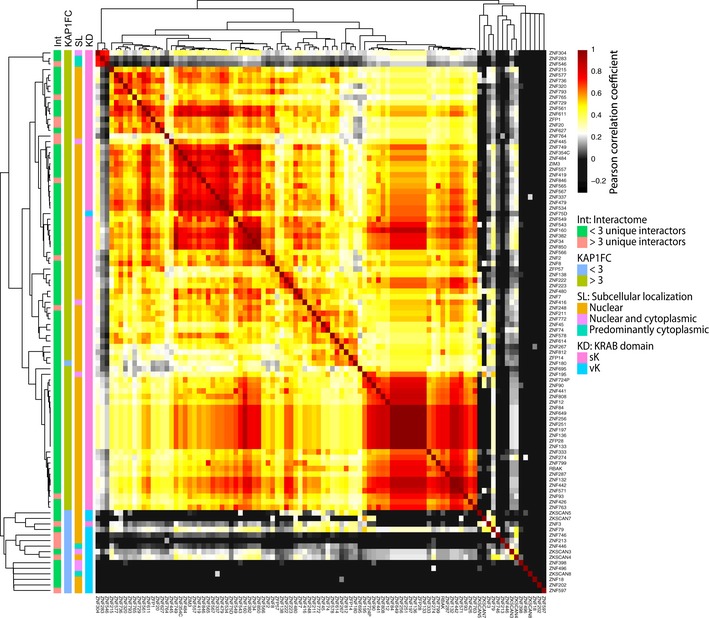
KAP1 force‐directed network. The distance KZFP‐KAP1 is inversely proportional to the measured KAP1 enrichment over controls (KAP1FC). KZFPs with KAP1FC values above three were colored in blue and the ones below in green.
Boxplot representing the KAP1FC value of our baits in function of the percentage of their binding sites falling in TEs. Mann–Whitney two‐sided rank test.
Human KZFPs KRAB domain A‐boxes protein phylogenetic tree associated with their corresponding amino acid sequences colored according to the Clustal Zappo color scheme (residues sharing common physicochemical properties display the same color:
http://www.jal-view.org/help/html/colourSchemes/zappo.html ). This figure also displays a zoom‐in on the variant KRAB domain cluster (right). On this zoom‐in, the tested vKZFPs, whose interactomes were defined in our study, were marked by an asterisk.Box plot representing KAP1FC values in function of KZFPs age. On a superimposed swarm plot, the individual vKZFPs corresponding KAP1FC values were represented by red dots and for their sKZFPs counterparts, by blue dots. Mann–Whitney two‐sided rank test.
Boxplot representing the number of interactors of KZFPs in function of their evolutionary age. On a superimposed swarm plot, individual KZFPs number of preys were represented by dots. When green, the interactome of this KZFP contained 3 or more unique interactors (Fig 3B).
Boxplot representing the average dn/ds ratios for all vK (red) and sK (blue) domains displaying the same evolutionary ages. Mann–Whitney two‐sided rank test.
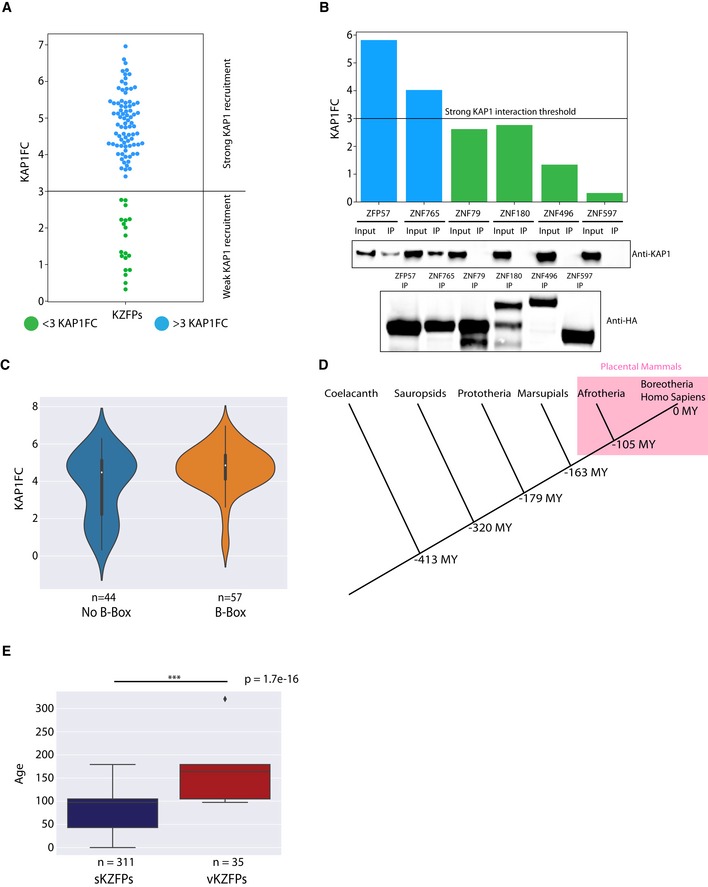
Swarm plot representing the observed range of KAP1FC values as well as the determination of a strong KAP1 interaction threshold of 3.
Double representation of KAP1 interaction for selected strong and weak KAP1‐interacting KZFPs. Top: Experimentally determined KAP1FC values are represented by a histogram. Bottom: KAP1 interaction determined by immunoprecipitations. HA‐tagged KZFPs transduced cell lines were used for immunoprecipitations. Input = cellular lysate, IP = immunoprecipitate. HA immunoprecipitation of KZFPs followed by endogenous KAP1 detection through Western blot using an anti‐KAP1 antibody. Western blot using an anti‐HA antibody on the IPs at the bottom.
Violin plot representing the KAP1FC values for KZFPs in function of the presence of a B‐box in their KRAB domain.
Simple phylogenetic tree representing the time of divergences of coelacanth and different tetrapod clades from the Homo sapiens lineage.
Evolutionary age of all sKZFPs and vKZFPs present in the UniProt database and our previous study (Imbeault et al, 2017). Mann–Whitney two‐sided rank test.
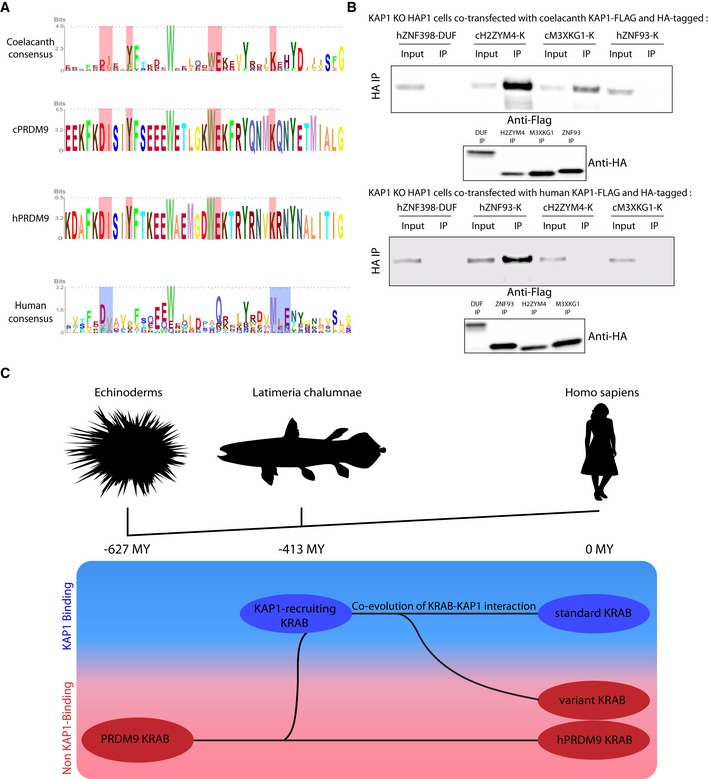
Consensus sequences for KRAB A‐boxes from top to bottom: coelacanth KRAB domains, coelacanth PRDM9 KRAB domain, human PRDM9 KRAB domain, and human KRAB domains. Residues conserved between the first three sequences and not present in human KRAB consensus were highlighted in red. In the human KRAB consensus, residues crucial for KAP1 recruitment were highlighted in blue (Margolin et al,1994).
Immunoprecipitations of HA‐tagged KRAB domains in order to check interaction with cKAP1. Co‐transfection of Flag‐tagged cKAP1 (upper panel) or Flag‐tagged hKAP1 (lower panel) and HA‐tagged ZNF398 DUF3669 domain negative control, H2ZYM4 and M3XKG1 cKRAB domains, and ZNF93 hKRAB domain in KAP1 KO HAP1 cells followed by HA immunoprecipitation. cKAP1 and hKAP1 presence was revealed by Western blot using an anti‐Flag antibody. Input = cellular lysate, IP = immunoprecipitate. Western blot using an HA antibody on the IPs at the bottom.
Evolutionary KRAB model: On top, a simple phylogenetic tree represents the links between echinoderms, coelacanth, and human. At the bottom, different KRAB domain versions ranging from the ancestral PRDM9‐related KRAB domain to the classical KAP1 binding human KRAB are represented. Their position on this model depends (i) under which species or clades they were detected, hence reflecting the last common ancestor in which they putatively appeared and (ii) whether they bind KAP1, in the blue rectangle, or not, in the pink rectangle. Briefly, the echinoderm‐conserved PRDM9‐related KRAB domain is the putative ancestor of KAP1‐binding KRAB domain that emerged in the coelacanth. The KRAB domain and KAP1 co‐evolved, maintaining their association in tetrapods. Meanwhile, certain KZFPs have lost KAP1 binding to become vKZFPs.
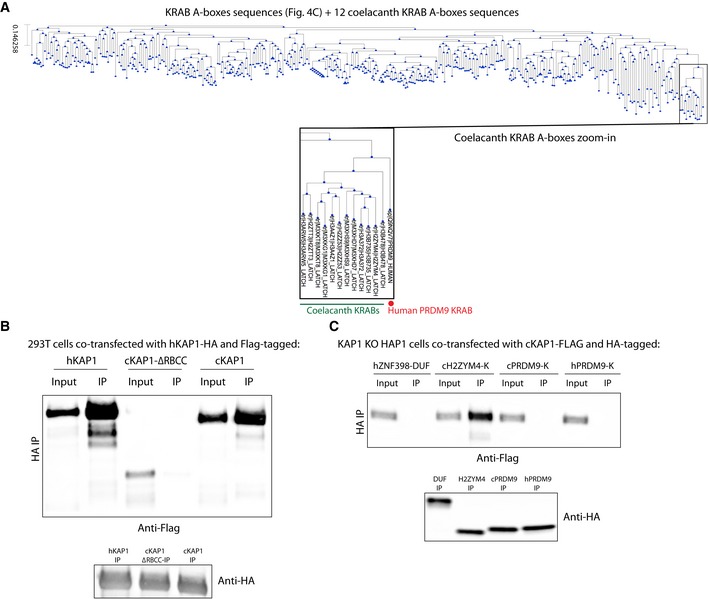
Phylogenetic tree built based on amino acid sequence alignment of human KZFP KRAB A‐boxes and UniProt‐determined coelacanth KZFP KRAB A‐boxes domains, bottom: zoom‐in on the cluster containing all of the coelacanth KRAB domains, coelacanth KRAB domains are indicated in green while hPRDM9 KRAB is indicated in red.
Immunoprecipitation of HA‐tagged hKAP1 domain in order to check interaction with cKAP1. Co‐transfection of HA‐tagged hKAP1 and Flag‐tagged hKAP1, negative control ΔRBCC cKAP1 (the RBCC domain mediates KAP1 oligomerization), and cKAP1 in 293T cells followed by HA immunoprecipitation. The presence of different KAP1 constructs was revealed by Western blot using an anti‐Flag antibody. Input = cellular lysate, IP = immunoprecipitate. Western blot using an anti‐HA antibody on the IPs at the bottom.
Immunoprecipitation of HA‐tagged human and coelacanth PRDM9 KRAB domains in order to check interaction with cKAP1. Co‐transfection of Flag‐tagged cKAP1 and HA‐tagged ZNF398 DUF3669 domain, H2ZYM4 cKRAB domain, and PRDM9 hKRAB and cKRAB domains in KAP1 KO HAP1 cells followed by HA immunoprecipitation. cKAP1 presence was revealed by Western blot using an anti‐Flag antibody. Input = cellular lysate, IP = immunoprecipitate. Western blot using an anti‐HA antibody on the IPs at the bottom.
Similar articles
-
Take a walk on the KRAB side.Trends Genet. 2023 Nov;39(11):844-857. doi: 10.1016/j.tig.2023.08.003. Epub 2023 Sep 14. Trends Genet. 2023. PMID: 37716846 Review.
-
Conserved paradoxical relationships among the evolutionary, structural and expressional features of KRAB zinc-finger proteins reveal their special functional characteristics.BMC Mol Cell Biol. 2021 Jan 22;22(1):7. doi: 10.1186/s12860-021-00346-w. BMC Mol Cell Biol. 2021. PMID: 33482715 Free PMC article.
-
Individual retrotransposon integrants are differentially controlled by KZFP/KAP1-dependent histone methylation, DNA methylation and TET-mediated hydroxymethylation in naïve embryonic stem cells.Epigenetics Chromatin. 2018 Feb 26;11(1):7. doi: 10.1186/s13072-018-0177-1. Epigenetics Chromatin. 2018. PMID: 29482634 Free PMC article.
-
Structure and functional mapping of the KRAB-KAP1 repressor complex.EMBO J. 2022 Dec 15;41(24):e111179. doi: 10.15252/embj.2022111179. Epub 2022 Nov 7. EMBO J. 2022. PMID: 36341546 Free PMC article.
-
KRAB zinc finger proteins.Development. 2017 Aug 1;144(15):2719-2729. doi: 10.1242/dev.132605. Development. 2017. PMID: 28765213 Free PMC article. Review.
Cited by
-
Biology and Physics of Heterochromatin-Like Domains/Complexes.Cells. 2020 Aug 11;9(8):1881. doi: 10.3390/cells9081881. Cells. 2020. PMID: 32796726 Free PMC article. Review.
-
ChAHP2 and ChAHP control diverse retrotransposons by complementary activities.Genes Dev. 2024 Jul 19;38(11-12):554-568. doi: 10.1101/gad.351769.124. Genes Dev. 2024. PMID: 38960717 Free PMC article.
-
Transcriptional Contribution of Transposable Elements in Relation to Salinity Conditions in Teleosts and Silencing Mechanisms Involved.Int J Mol Sci. 2022 May 6;23(9):5215. doi: 10.3390/ijms23095215. Int J Mol Sci. 2022. PMID: 35563606 Free PMC article.
-
Integrative genome-wide analysis of dopaminergic neuron-specific PARIS expression in Drosophila dissects recognition of multiple PPAR-γ associated gene regulation.Sci Rep. 2021 Nov 2;11(1):21500. doi: 10.1038/s41598-021-00858-7. Sci Rep. 2021. PMID: 34728675 Free PMC article.
-
TRIM28 regulates SARS-CoV-2 cell entry by targeting ACE2.Cell Signal. 2021 Sep;85:110064. doi: 10.1016/j.cellsig.2021.110064. Epub 2021 Jun 17. Cell Signal. 2021. PMID: 34146659 Free PMC article.
References
-
- Bastian M, Heymann S, Jacomy M (2009) Gephi: an open source software for exploring and manipulating networks. Third Int AAAI Conf Weblogs Soc Media 361–362
-
- Birtle Z, Ponting CP (2006) Meisetz and the birth of the KRAB motif. Bioinformatics 22: 2841–2845 - PubMed
-
- Boissinot S, Furano AV (2001) Adaptive evolution in LINE‐1 retrotransposons. Mol Biol Evol 18: 2186–2194 - PubMed
Publication types
MeSH terms
Substances
Associated data
- Actions
Grants and funding
LinkOut - more resources
Full Text Sources
Other Literature Sources
Molecular Biology Databases
Miscellaneous
